2008.07.16 Gamma-gamma invariant mass cut study
Ilya Selyuzhenkov July 16, 2008
Three data sets:
- pp2006 - STAR 2006 pp longitudinal data (~ 3.164 pb^1) after applying gamma-jet isolation cuts.
- gamma-jet - data-driven Pythia gamma-jet sample (~170K events). Partonic pt range 5-35 GeV.
- QCD jets - data-driven Pythia QCD jets sample (~4M events). Partonic pt range 3-65 GeV.
My simple gamma-gamma finder is trying to
find a second peaks (clusters) in each SMD u and v planes,
match u and v plane high strip intersections,
and calculate the invaraint mass from associated tower energies (3x3 cluster)
according to the energy sharing between SMD clusters.
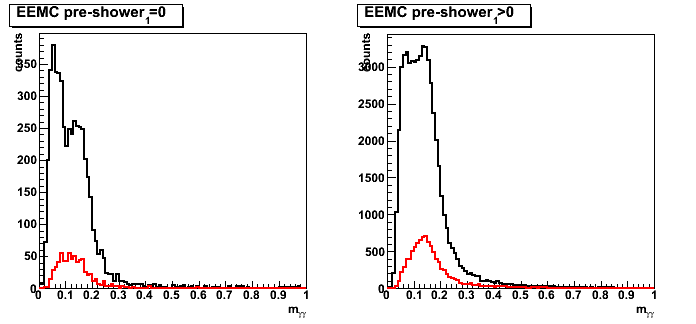
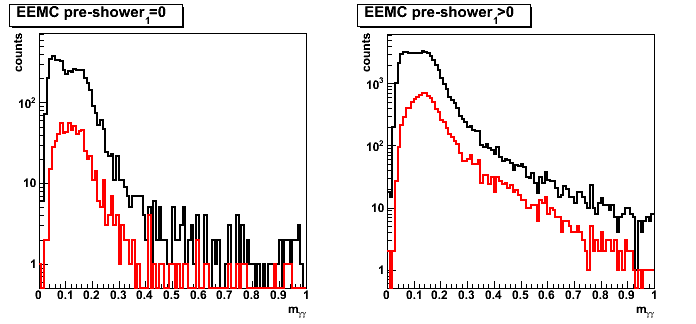
Figure 1: Gamma-gamma invariant mass plot.
Only pp2006 data are shown: black: no pt cuts, red: gamma pt>7GeV and jet pt>5 GeV.
Clear pi0 peak in the [0.1,0.2] invariant mass region.
Same data on the log scale
Gamma pt distributions
Figure 2: Gamma pt distribution (no inv mass cuts).
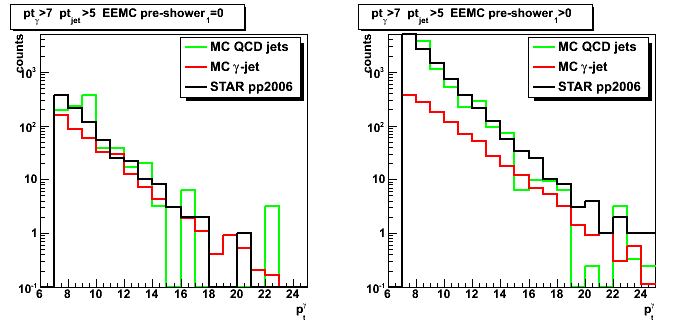
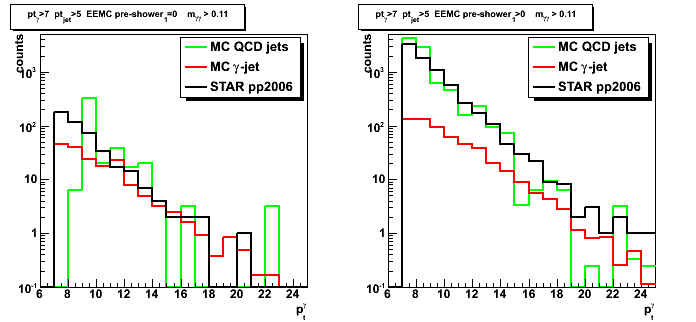
Figure 3: Gamma pt distribution (m_invMass<0.11 or no second peak found).
This cut improves signal to background ratio.
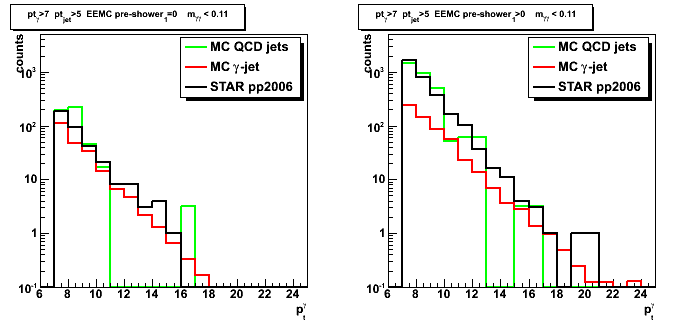
Figure 4: Gamma pt distribution (m_invMass>0.11).
Mostly background events.
Shower shapes
Figure 5: Shower shapes (no pre1 and no invMass cuts).
Good match between shapes in case of no energy in pre-shower1 layer (pre1=0 case).
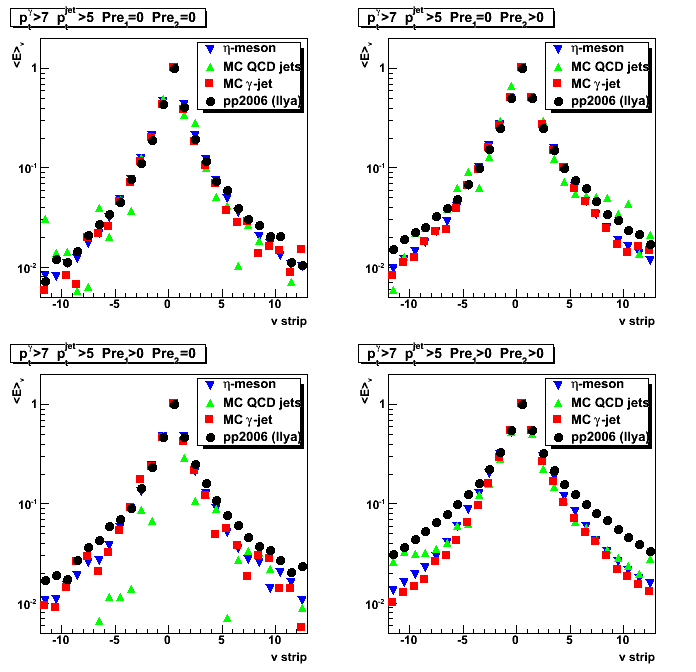
Figure 6: Shower shapes (pre1<5MeV, no invMass cuts).
For pre1&2>0 case shapes getting closer to ech other, but still do not match.
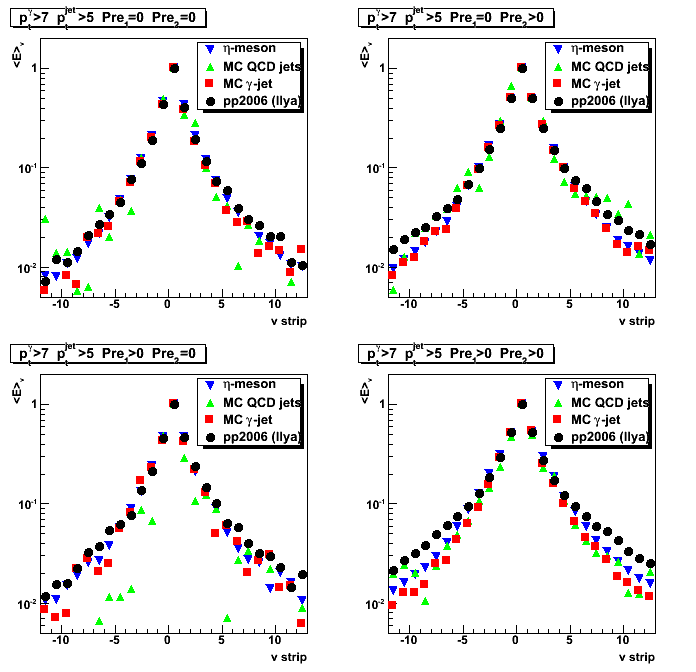
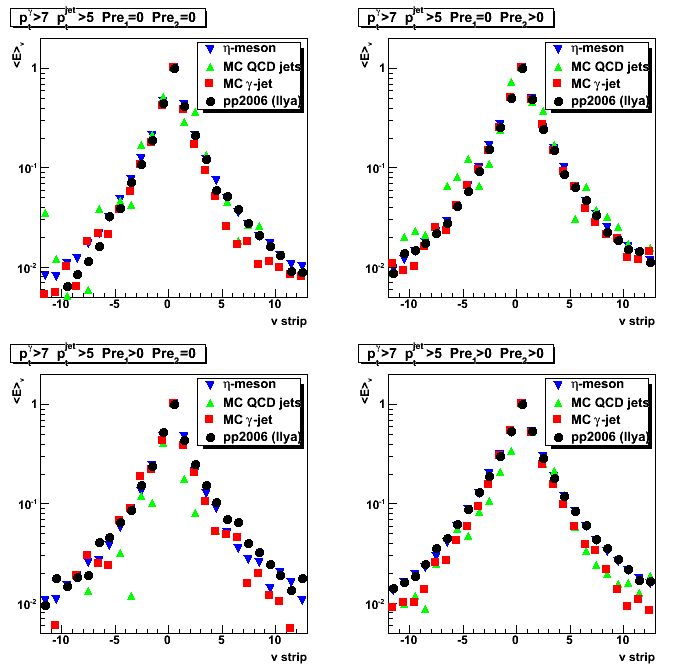
Figure 7: Shower shapes (cuts: pre1<5MeV, invMass<0.11 or no second peak found).
Note, the surprising agreement between eta-meson shapes (blue) and data (black).
Gamma-gamma invariant mass plots
Figure 8: Invariant mass distribution (MC vs. pp2006 data): no pre1 cut
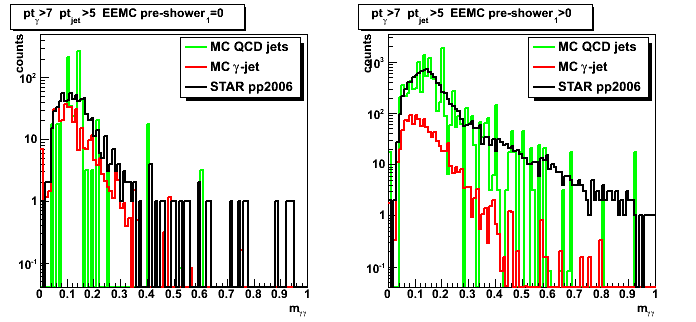
Figure 9: Invariant mass distribution (MC vs. pp2006 data): pre1<5MeV
Left side is the same as in Figure 8
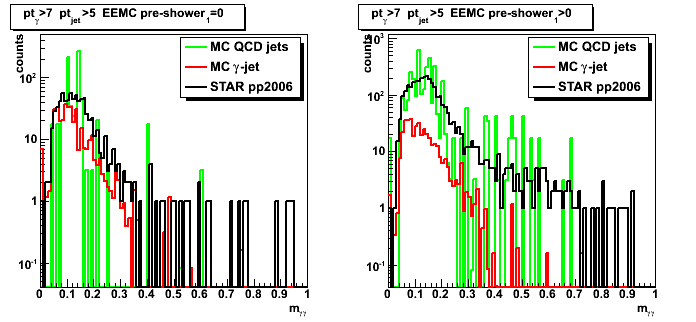
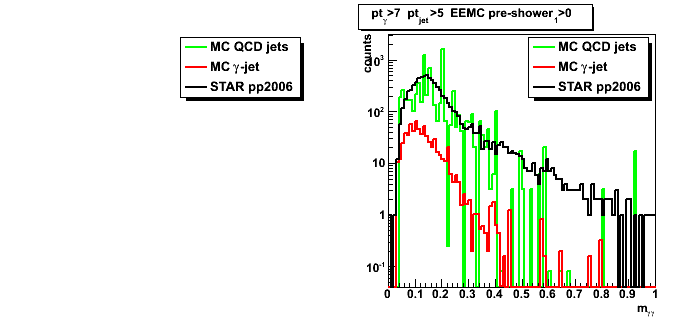
Figure 10: Invariant mass distribution (MC vs. pp2006 data): pre1>5MeV
Left side plot is empty, since there is no events with [pre1=0 and pre1>5MeV]
- Printer-friendly version
- Login or register to post comments