2008.07.07 Pre-shower1 < 5MeV cut study
Ilya Selyuzhenkov July 07, 2008
Data sets:
- pp2006 - STAR 2006 pp longitudinal data (~ 3.164 pb^1) after applying gamma-jet isolation cuts.
- gamma-jet - data-driven Pythia gamma-jet sample (~170K events). Partonic pt range 5-35 GeV.
- QCD jets - data-driven Pythia QCD jets sample (~4M events). Partonic pt range 3-65 GeV.
Figure 1: Correlation between 3x3 cluster energy in pre-shower2 vs. pre-shower1 layers
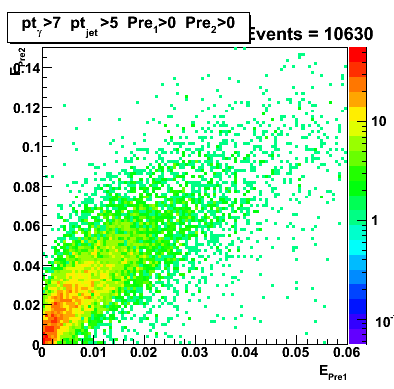
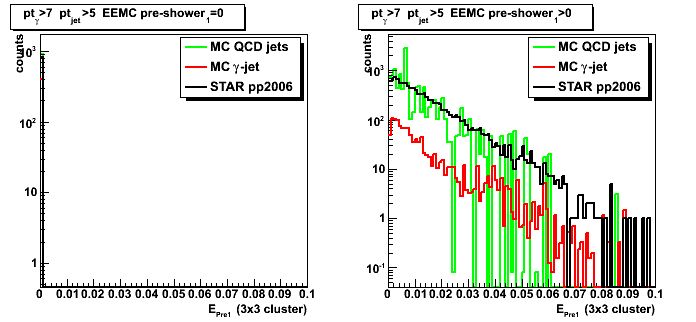
Figure 1a: Distribution of the 3x3 cluster energy in pre-shower1 layer (zoom in for Epre1<0.03 region)
(pp2006 data vs. MC gamma-jet and QCD events)
Figure 2: Shower shapes after pre-shower1 < 5MeV cut.
Shapes are narrower than those without pre1 cut (see Fig. 2)
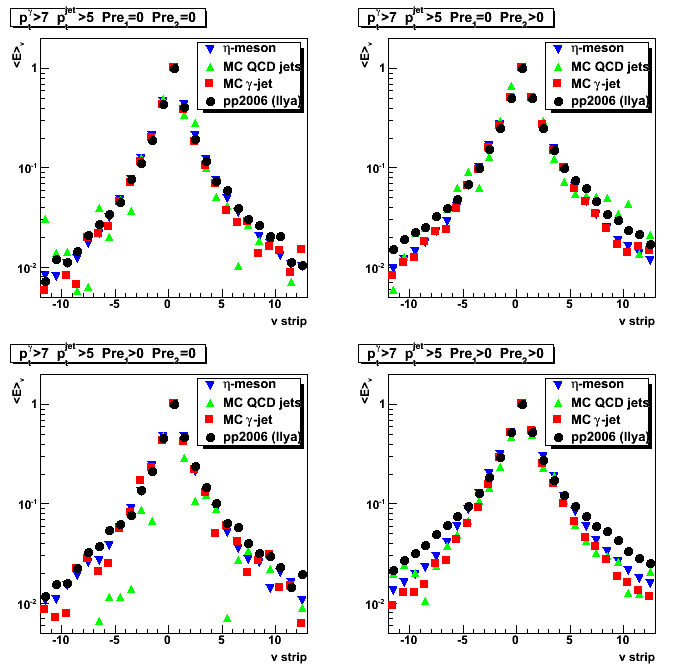
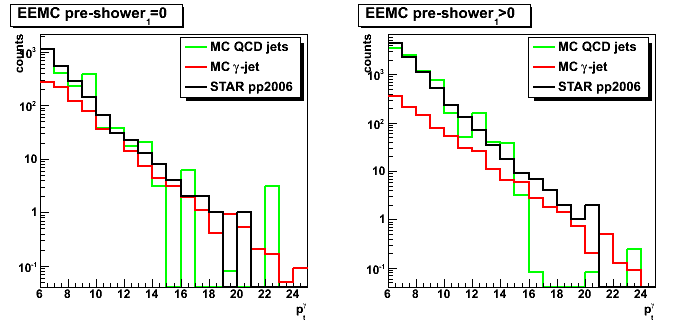
Figure 3: Gamma pt distribution with pre-shower1 < 5MeV cut.
Compare with distribution withoud pre-shower1 (Fig. 3)
Sided residual (before and after pre-shower1 < 5MeV cut)
Figure 4: Fitted peak vs. maximum sided residual (no pre-shower1 cuts)
Only points for pp2006 data are shown.
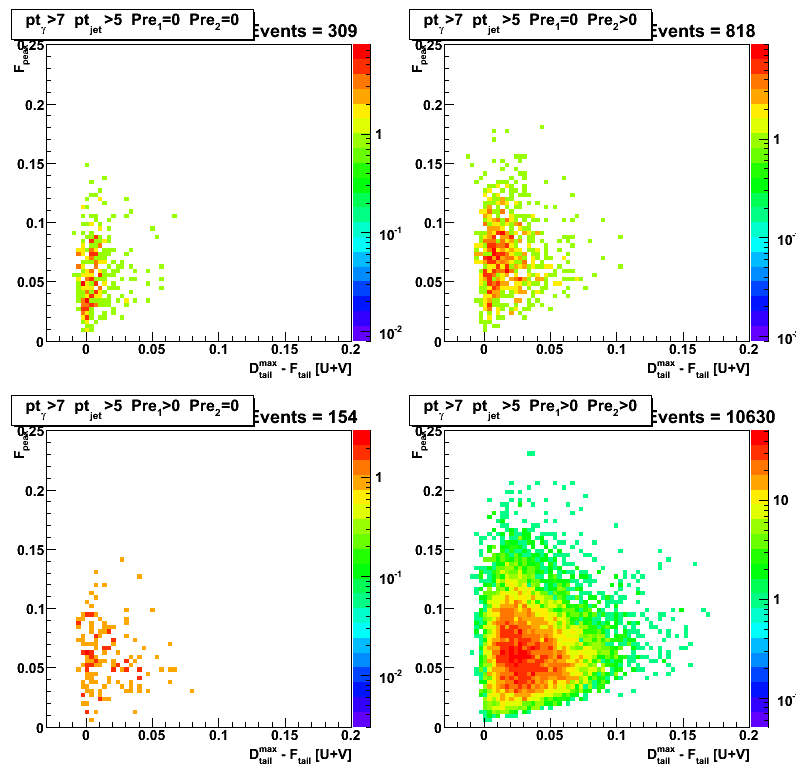
Figure 5: Fitted peak vs. maximum sided residual (after pre-shower1 < 5MeV cut).
Only points for pp2006 data are shown.
Note that distribution for pre1>0,pre2>0 case are narrower
compared to that in Fig.4 (without pre-shower1 cuts).
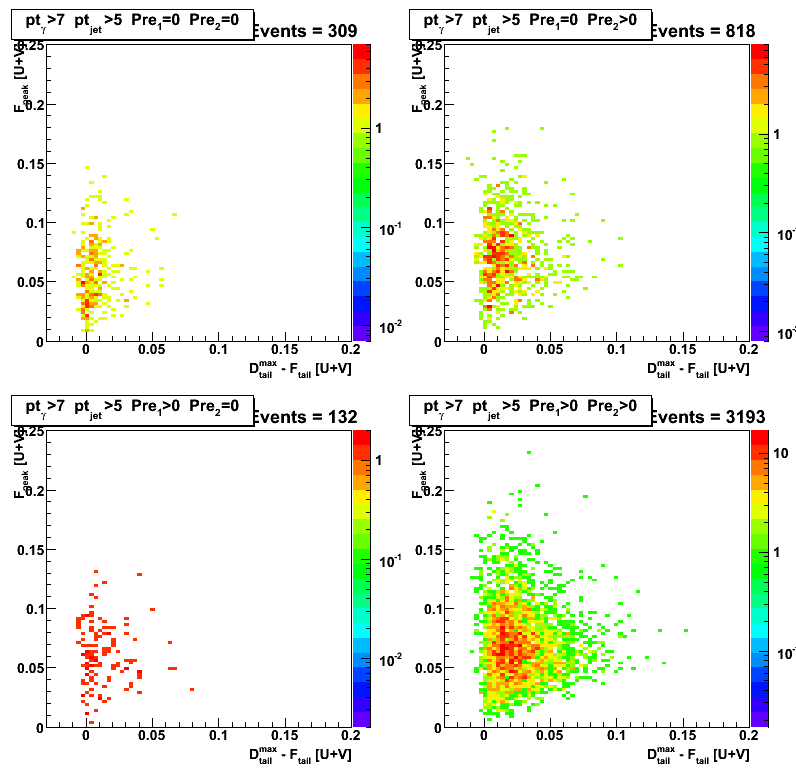
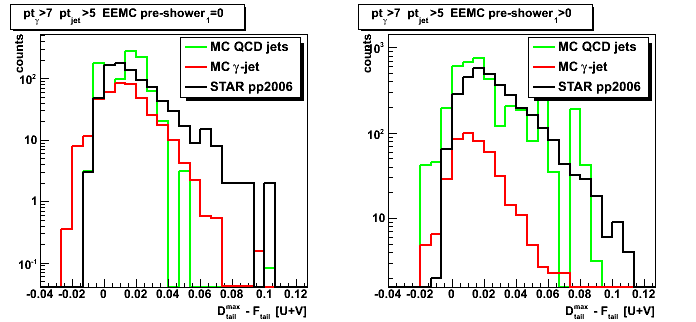
Figure 6: Distribution of maximum sided residual with pre-shower1 < 5MeV cut.
- Printer-friendly version
- Login or register to post comments