2010.01.08 EEMC response 2006 vs. 2009: phi cuts
EEMC migration plots with cuts on TPC sector boundaries
Click here for results before phi cuts
Monte-Carlo setup
- Throwing one photon per event
- Full STAR y2006h/y2009a configurations
- Throw particles flat in eta (1.08, 2.0), phi (0, 2pi), and energy (5-35 GeV)
- Using A2Emaker to get reconstructed Tower/SMD energy (no EEMC SlowSimulator in chain)
- Vertex z=0
- ~50K/per particle type
- Non-zero energy: 3 sigma above pedestal
Geometry configurations:
- y6h:10KeV (black) - y2006h with emc_10KeV option
- y9a:10KeV (red) - y2009a with emc_10KeV option
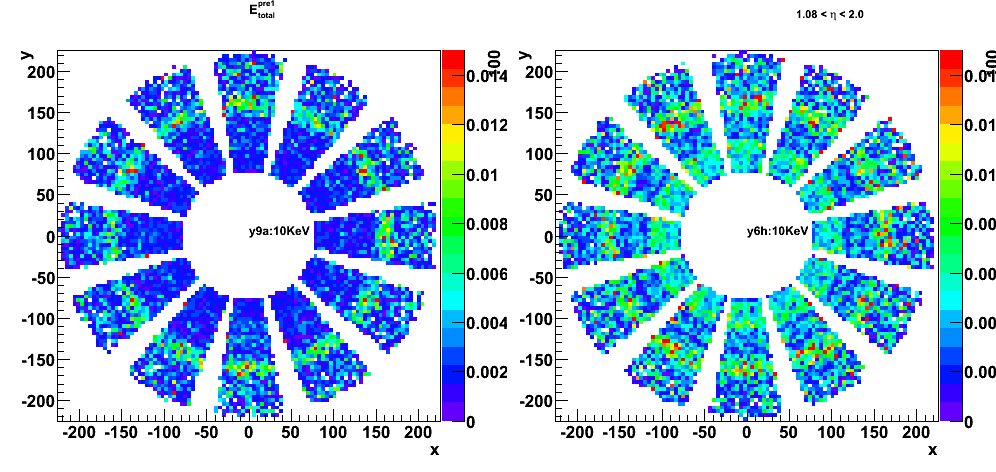
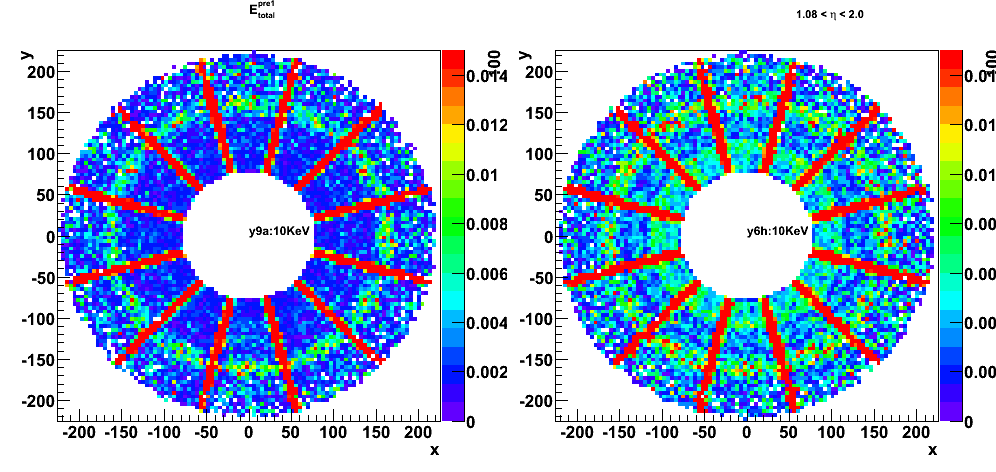
Figure 1: Average pre-shower1 energy vs. thown photon position in EEMC
with cuts on TPC sector boundaries: cos(12*(phi-Pi/6.)) < -0.65 (similar plot before phi cuts)
(left) y2009a with emc_10KeV
(right) y2006h with emc_10KeV
Figure 2: Pre-shower 1 sampling fraction (E_pre1/E_thrown) vs. thrown eta
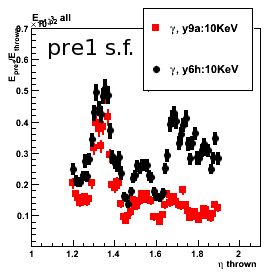
Figure 3: EEMC sampling fraction
(left) vs. thrown photon energy (with 1.2 < eta < 1.9 cut)
(right) vs. thrown photon eta
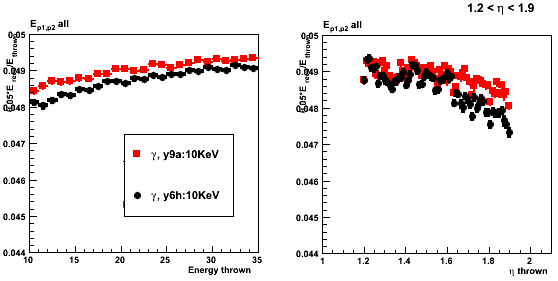
Figure 4: Pre-shower migration (1.2 < eta < 1.9)
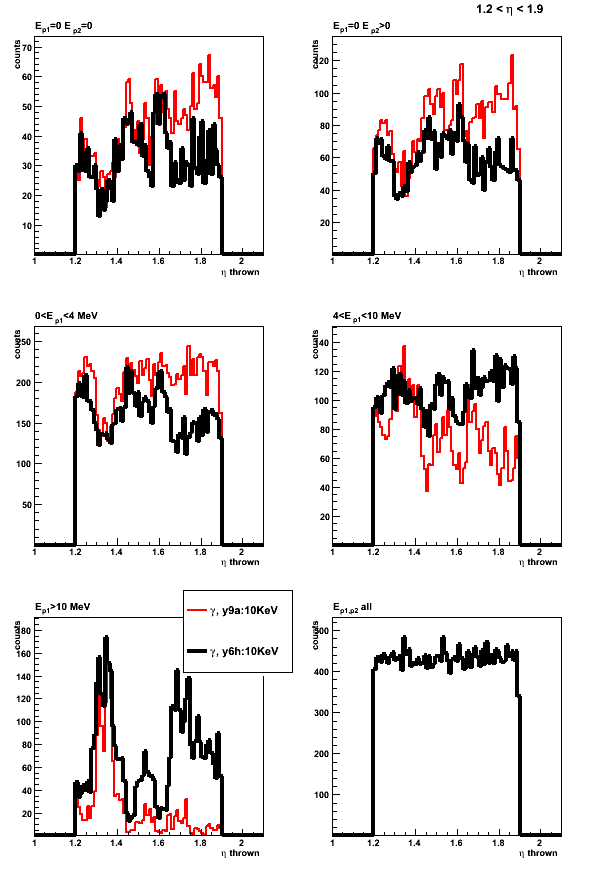
Groups:
- Printer-friendly version
- Login or register to post comments