- BEMC
- BEMC Detector Operator Manual
- Calibrations
- BPRS
- BSMD
- BTOW - Calibration Procedure
- Run 12 BTOW Calibration
- Run 3 BTOW Calibration
- Run 4 BTOW Calibration
- Run 5 BTOW Calibration
- Run 6 BTOW Calibration
- Run 7 BTOW Calibration
- Run 8 BTOW Calibration (2008)
- Run 9 BTOW Calibration
- 01 BTOW HV Mapping
- 02 Comparing 2007, 2008 and 2009 BTOW Slopes
- 03 study of 2009 slopes (jan)
- 04 Spectra from Problem PMT Channels
- 05 Summary of HV Adjustment Procedure
- 06 comparison of BTOW status bits L2ped vs. L2W , pp 500 (jan)
- 07 BTOW status tables ver 1, uploaded to DB, pp 500
- 08 End or run status
- 09 MIP peaks calculated using L2W stream
- 10 Electron E/p from pp500 L2W events
- 12 Correcting Relative gains from 500 GeV L2W
- 13 Updating Calibration using the latest L2W production
- 14 200 GeV Calibration
- Database
- Hardware
- Mapping
- Service Tasks
- Software
- Useful Documents
- EEMC
- ETOF
- FCS
- FGT
- FPD & FMS & FPS
- FTPC
- FTT
- HLT
- L3
- PMD
- PP2PP
- RICH
- Roman Pot Phase II*
- SSD
- SVT
- Slow Controls
- TPC
- TRG
- Trigger Detectors
- VPD
- test
09 MIP peaks calculated using L2W stream
Updated on Mon, 2009-09-21 11:53. Originally created by mattheww on 2009-09-16 13:00.
Under:
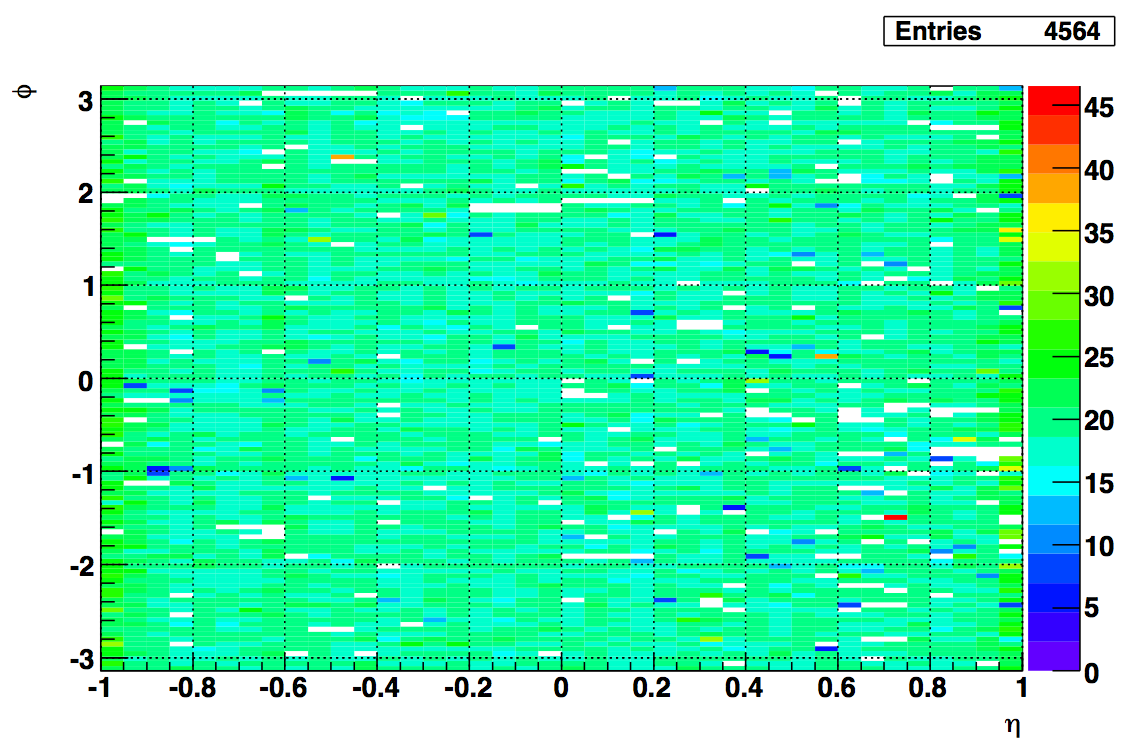
The MIP peaks plotted in the attachment come from the L2W data. 4564 towers had a good MIP peak, 157 towers did not have enough counts in the spectra to fit, and 79 towers had fitting failures. 52 were recovered by hand for inclusion into calibration.
Also attached is a list of the 236 towers with bad or missing peaks.
I compared the 157 empty spectra with towers that did not have good slopes for relative gains calculated by Joe. Of the 157 towers, 52 had good slopes from his calculation. Those are in an attached list.
Fig 1 MIP peak position:

»
- Printer-friendly version
- Login or register to post comments
