2009.10.02 Jason vs. CVS EEMC geometry: sampling fraction and shower shapes

Tests with Jason geometry file (ecalgeo.g23)
Monte-Carlo setup:
- One photon per event
- EEMC only geometry with LOW_EM option
- Throw particles flat in eta (1.08, 2.0), phi (0, 2pi), and pt (6-10 GeV)
- Using A2Emaker to get reconstructed Tower/SMD energy
(no EEMC SlowSimulator in chain) - Vertex z=0
- ~50K/per particle type
- Non-zero energy: 3 sigma above pedestal
Color coding:
- Photon with Jason geometry (single particle MC)
- Photon with CVS (cAir fix) geometry (single particle MC)
- Eta-meson [pp2006 data] (single photons from eta-meson decay)
Sampling fraction
Figure 1: Sampling fraction vs. thrown energy (upper plot)
and vs. azimuthal angle (lower left) and rapidity (lower right)

Shower shapes
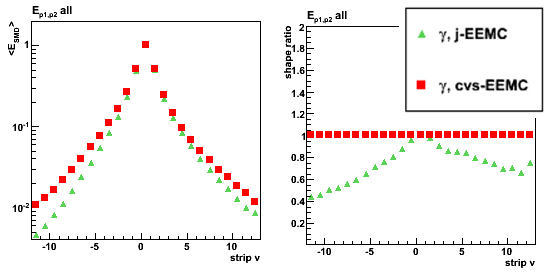
Single particle kinematic cuts: pt=7-8GeV, eta=1.2-1.4
Eta-meson shower shapes (blue) taken from Fig. 1 from here of this post
All shapes are normalized to 1 at peak (central strip)
Figure 2: Shower shapes
Shower shapes sorted by pre-shower energy
Pre-shower bins:
- Ep1 = 0, Ep2 = 0 (no energy in both EEMC pre-shower layers)
- Ep1 = 0, Ep2 > 0
- 0 < Ep1 < 4 MeV
- 4 < Ep1 < 10 MeV
- Ep1 > 10 MeV
- All pre-shower bins combined
Ep1/Ep2 is the energy deposited in the 1st/2nd EEMC pre-shower layer.
For a single particle MC it is a sum over
all pre-shower tiles in the EEMC with energy of 3 sigma above pedestal.
For eta-meson from pp2006 data the sum is over 3x3 tower patch
Figure 3: Shower shapes (left) and their ratio (right)
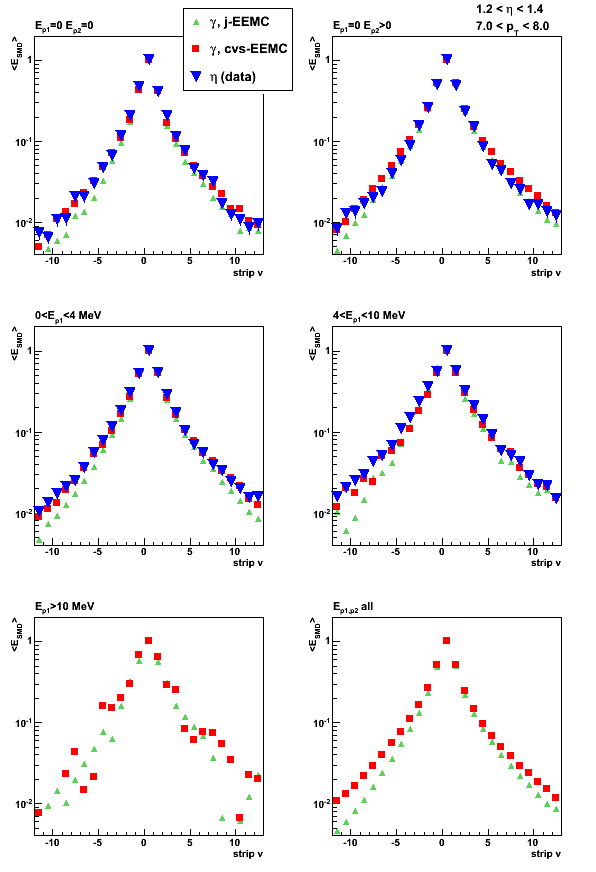
Figure 4: Shower shape ratios

Groups:
- Printer-friendly version
- Login or register to post comments