- Hard Probes
- Heavy Flavor
- Jet-like correlations
- Other Groups
- Peripheral Collisions
- Spin
- Spin PWG
- Spin/Cold-QCD Older Physics Analysis
- 2006 EEMC Neutral Pion Cross Section and A_LL
- 2006 Gamma + Jet
- 2009 Lambda D_LL @ 200 GeV
- 2009 dijet x-sect/A_LL @ 200 GeV
- 2011 FMS Jet-like correlations @ 500 GeV
- 2011 FMS inclusive pions @ 500 GeV
- 2012 EEMC Neutral Pion A_LL
- 2012 Jet A_LL @ 500 GeV
- 2012 Lambda D_TT @200GeV
- 2012 Pi0 - Jet A_LL @ 500
- 2012 Pions in Jets A_UT @ 200 GeV
- 2012 dijet A_LL @ 500
- 2012/13 FMS A_LL @ 500 GeV
- 2013 Di-jet A_LL @ 500 GeV
- A New Users Guide to PDSF Success
- Analyses from the early years
- (A) List of Physics Analysis Projects (obsolete)
- Common Analysis Trees
- EEMC Direct Photon Studies (Pibero Djawotho, 2006-2008)
- G/h Discrimination Algorithm (Willie)
- Neutral Pions 2005: Frank Simon
- Neutral strange particle transverse asymmetries (tpb)
- Photon-jet with the Endcap (Ilya Selyuzhenkov)
- Relative Luminosity Analysis
- Run 6 Dijet Cross Section (Tai Sakuma)
- Run 6 Dijet Double Longitudinal Spin Asymmetry (Tai Sakuma)
- Run 6 Inclusive Jet Cross Section (Tai Sakuma)
- Run 6 Neutral Pions
- 2006 Neutral Pion Paper Page
- 2006 Neutral Pion Update (9/27/07)
- A_LL
- BEMC Related Studies
- Cross Section Analysis
- DIS 2008 proceedings
- DNP 2007 Inclusive Hadron Talk
- Pions in Jets study
- Run QA
- SPIN 2008 Talk for Neutral Pions
- Spin PWG Meeting (2/22/07)
- Spin PWG meeting (2/12/09)
- Towards a Preliminary A_LL
- Tower By Tower Pion Peaks
- Run 6 Relative Luminosity (Tai Sakuma)
- Run 8 trigger planning (Jim Sowinski)
- Run 9
- Beam Polarizations
- Charged Pions
- Fully Reconstructed Ws
- Jet Trees
- W 2009 analysis , pp 500 GeV
- W 2011 AL
- Useful Links
- Working Group Members
Tower and SMD info
Updated on Thu, 2007-05-17 08:35. Originally created by staruser on 2007-01-23 15:31.
Under:
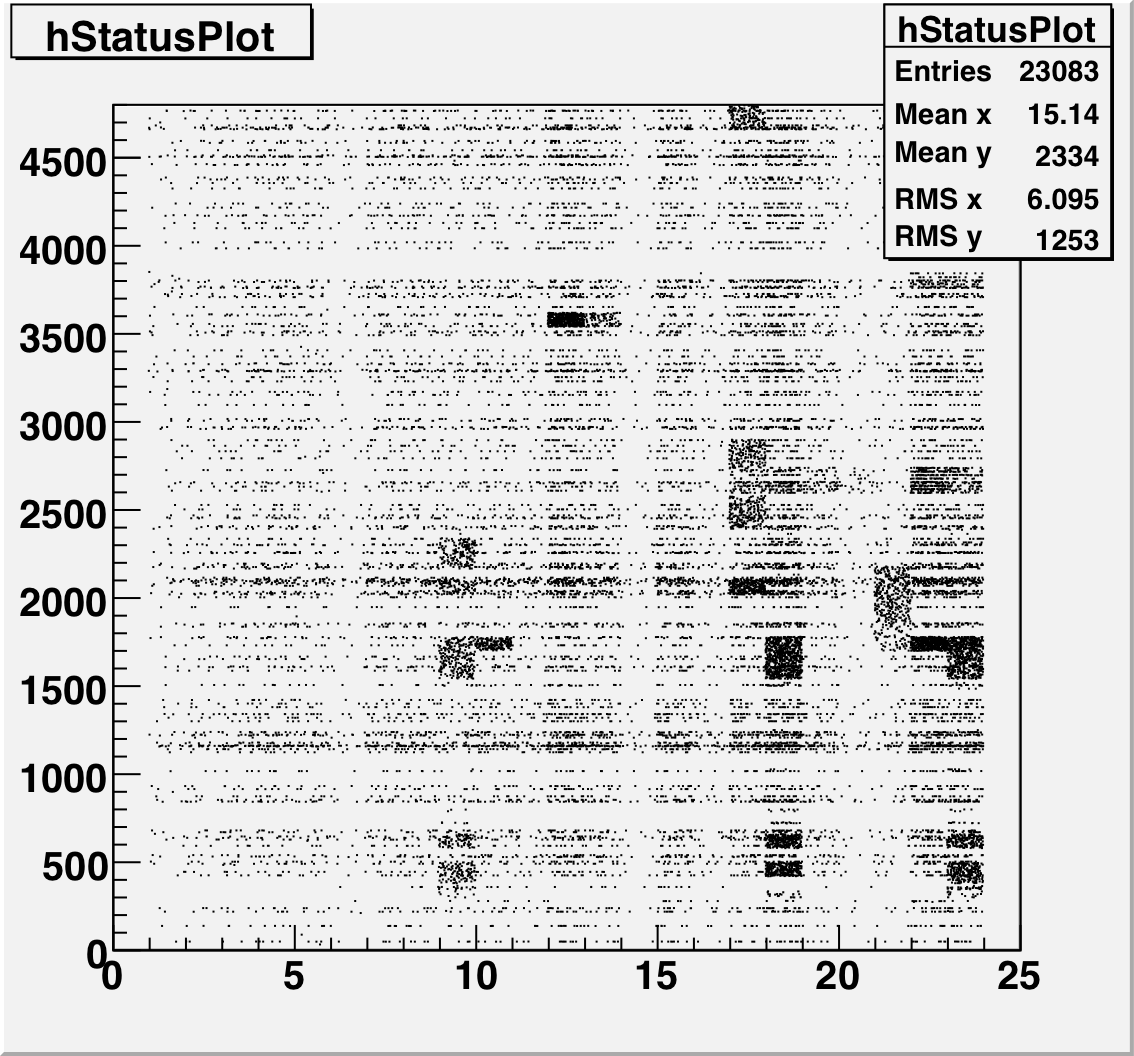
This is a plot of the tower status as a function of relative day (since the start of the second longitudinal period.) The 4800 towers are on the Y-Axis and Days are on the X axis. A dot means that that tower had a status other than good during that time period.
Tower Status Geometry
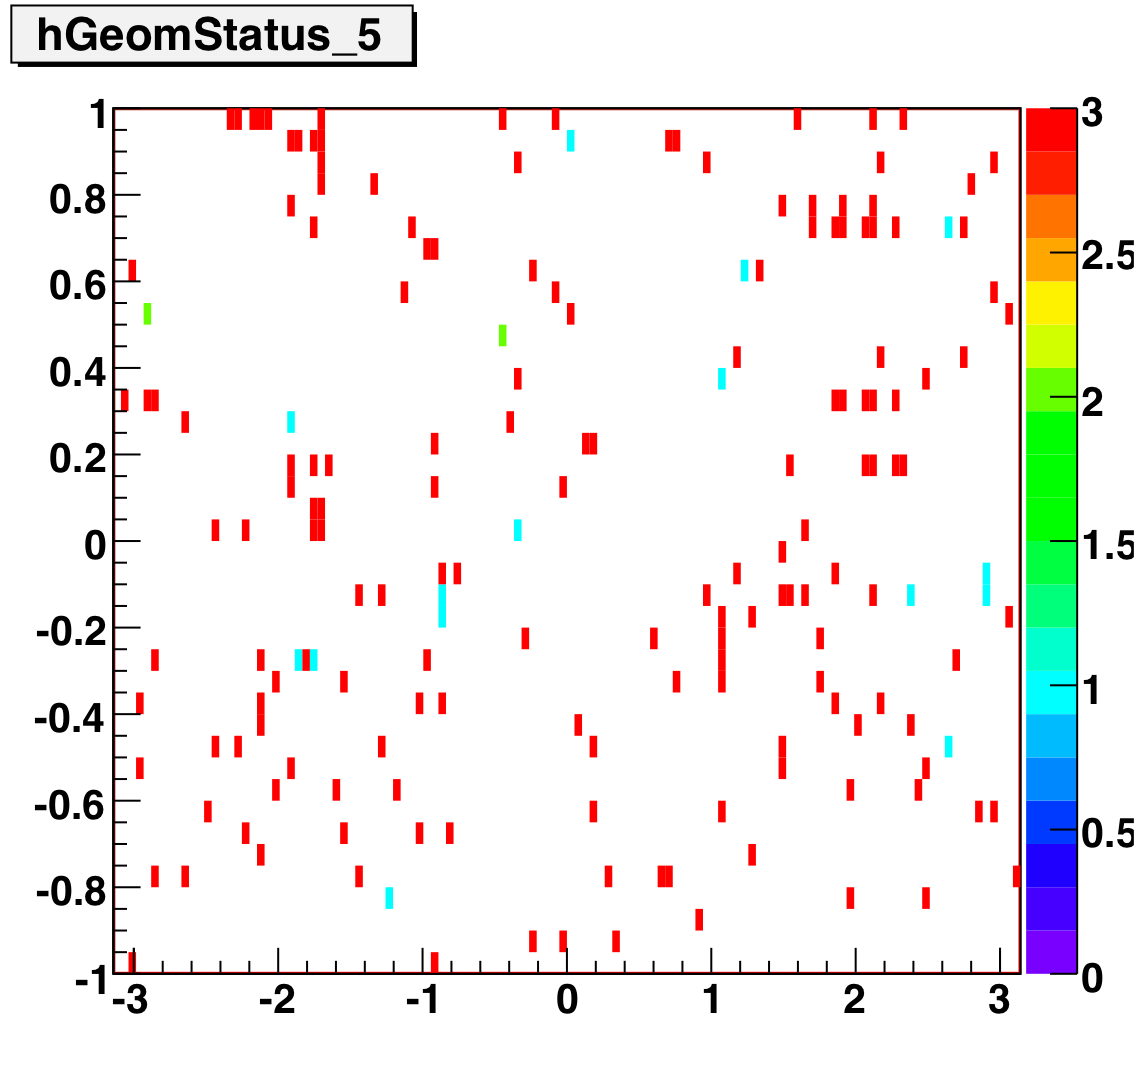
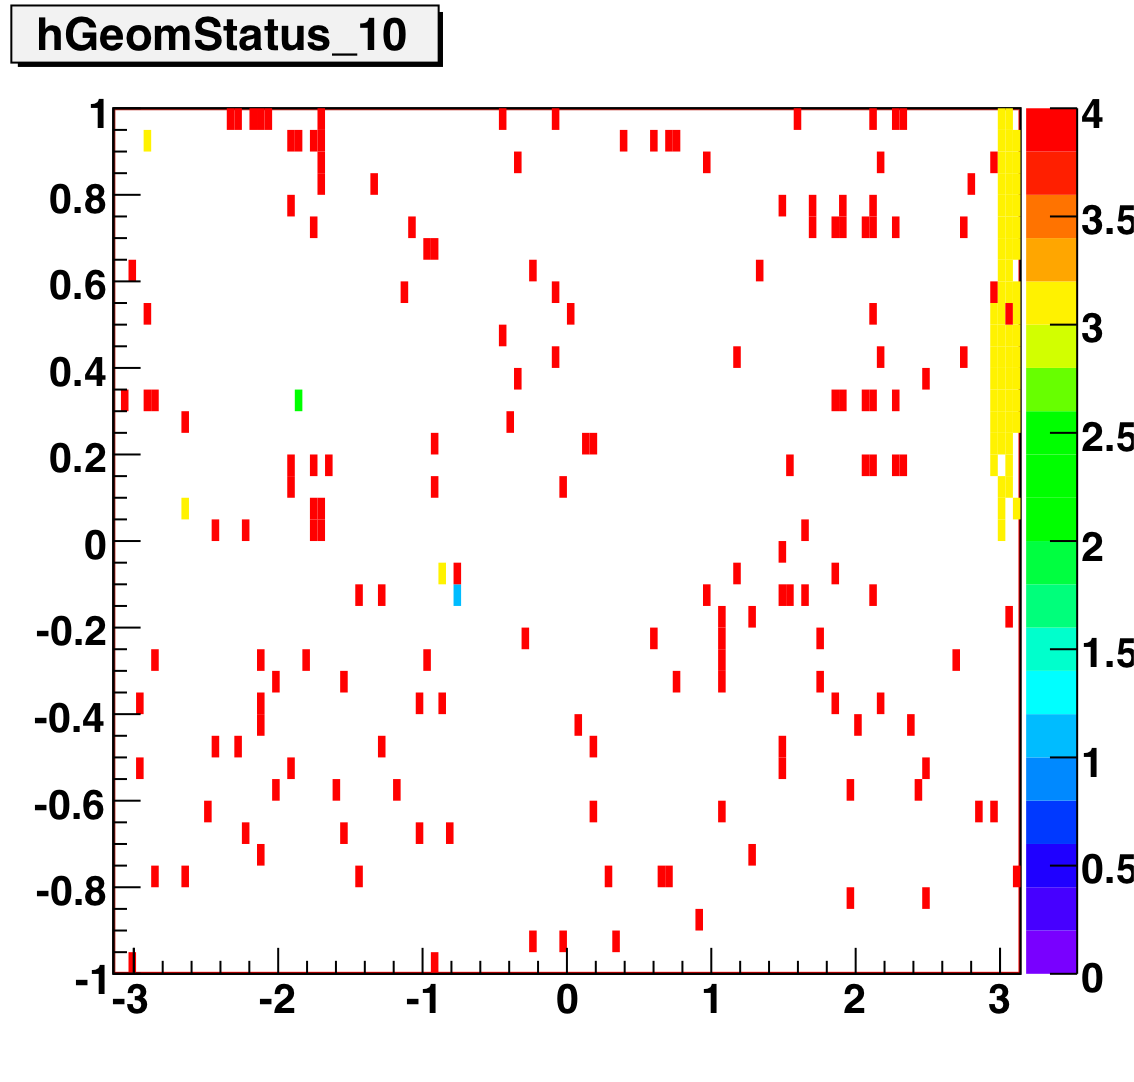
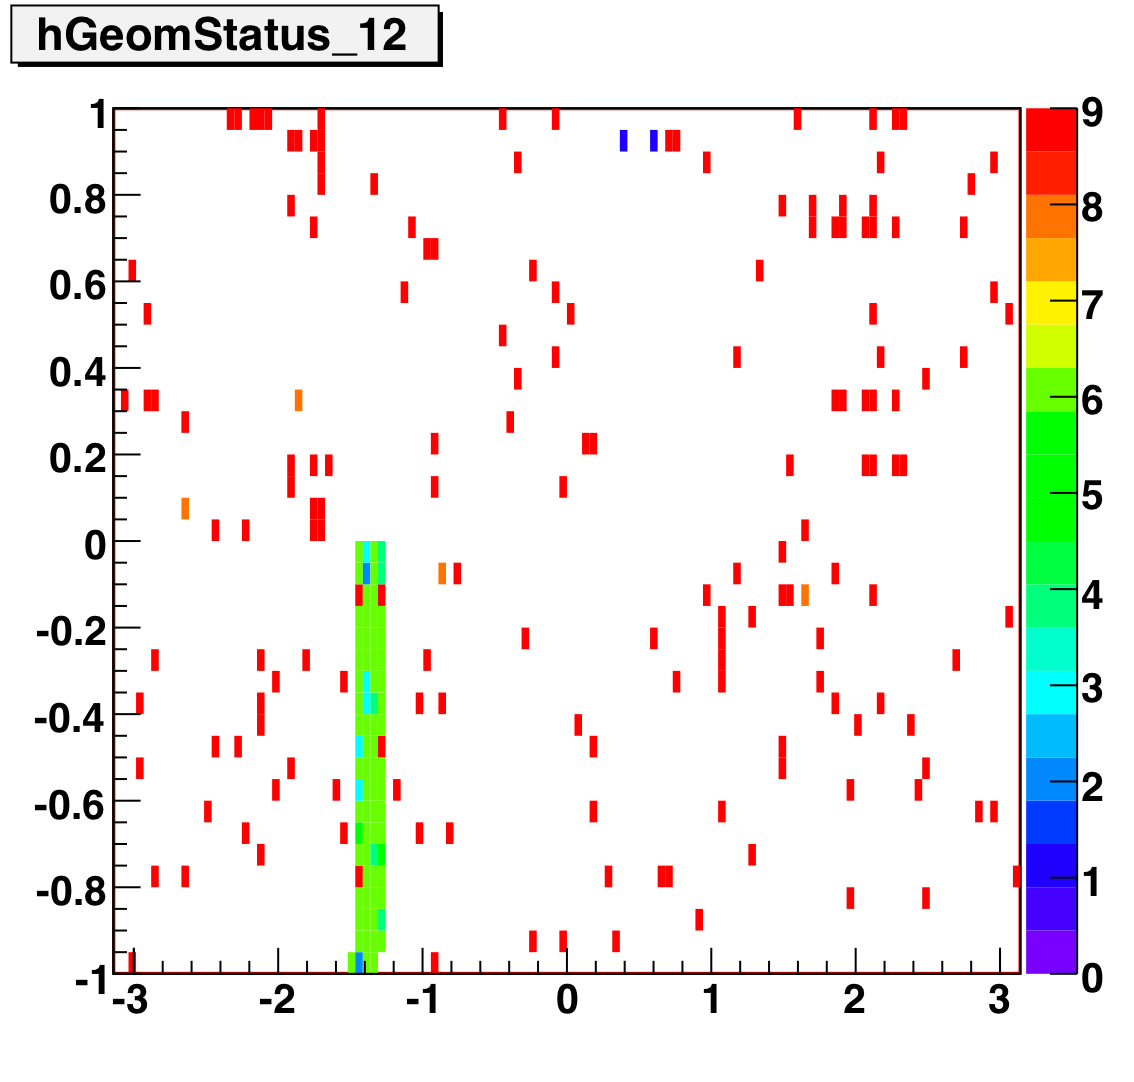
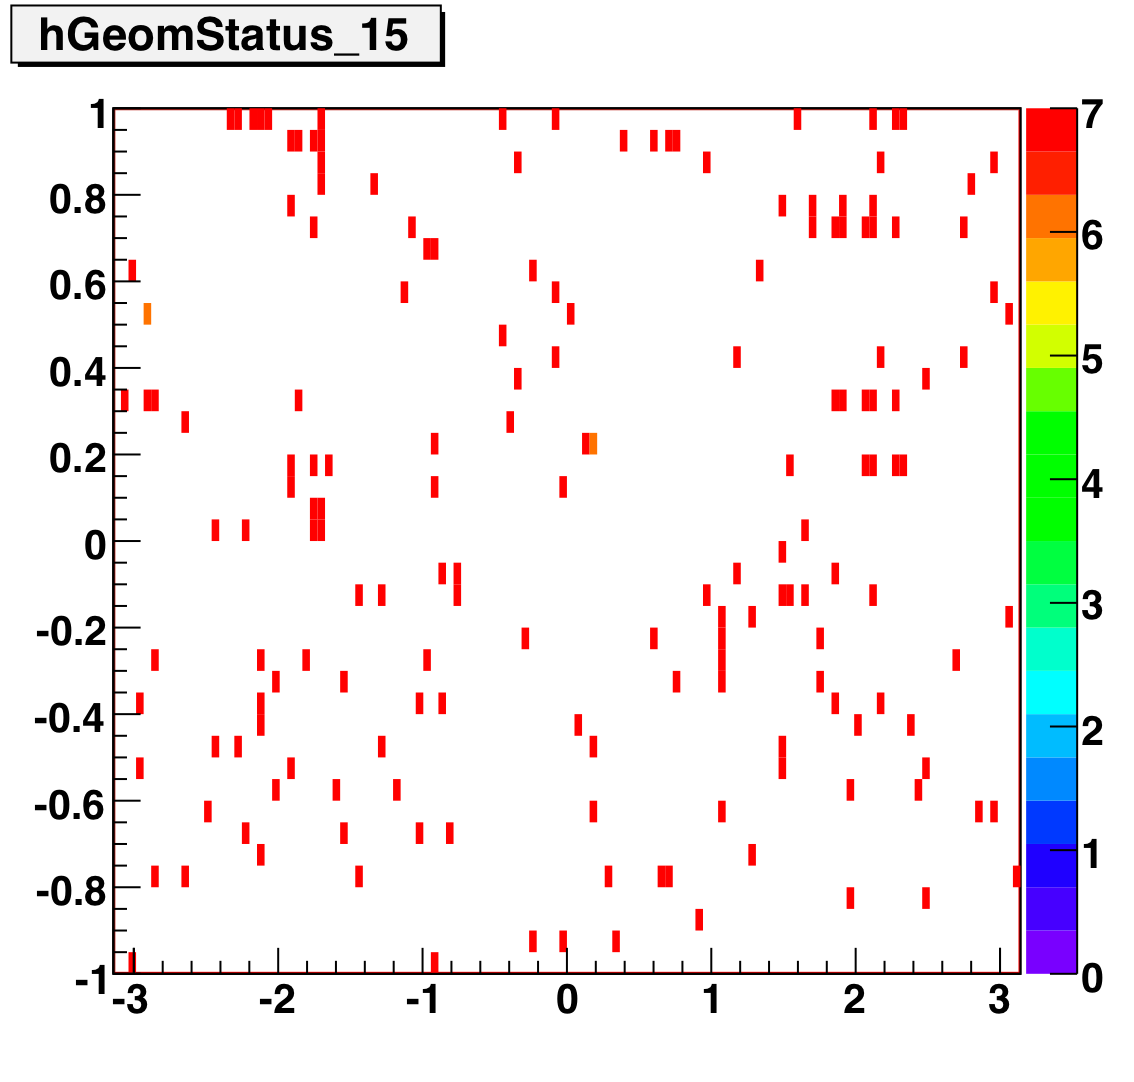
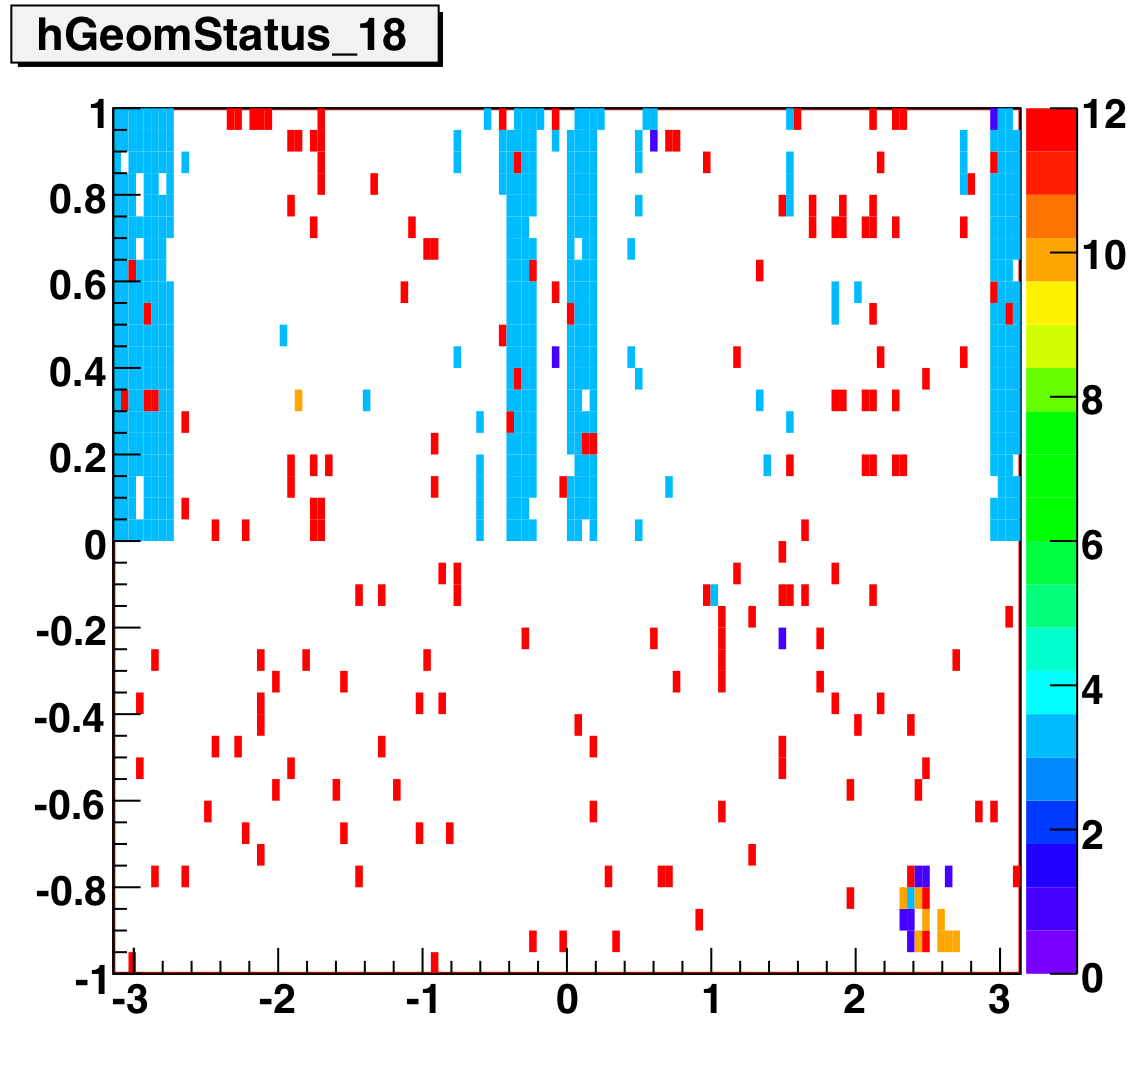
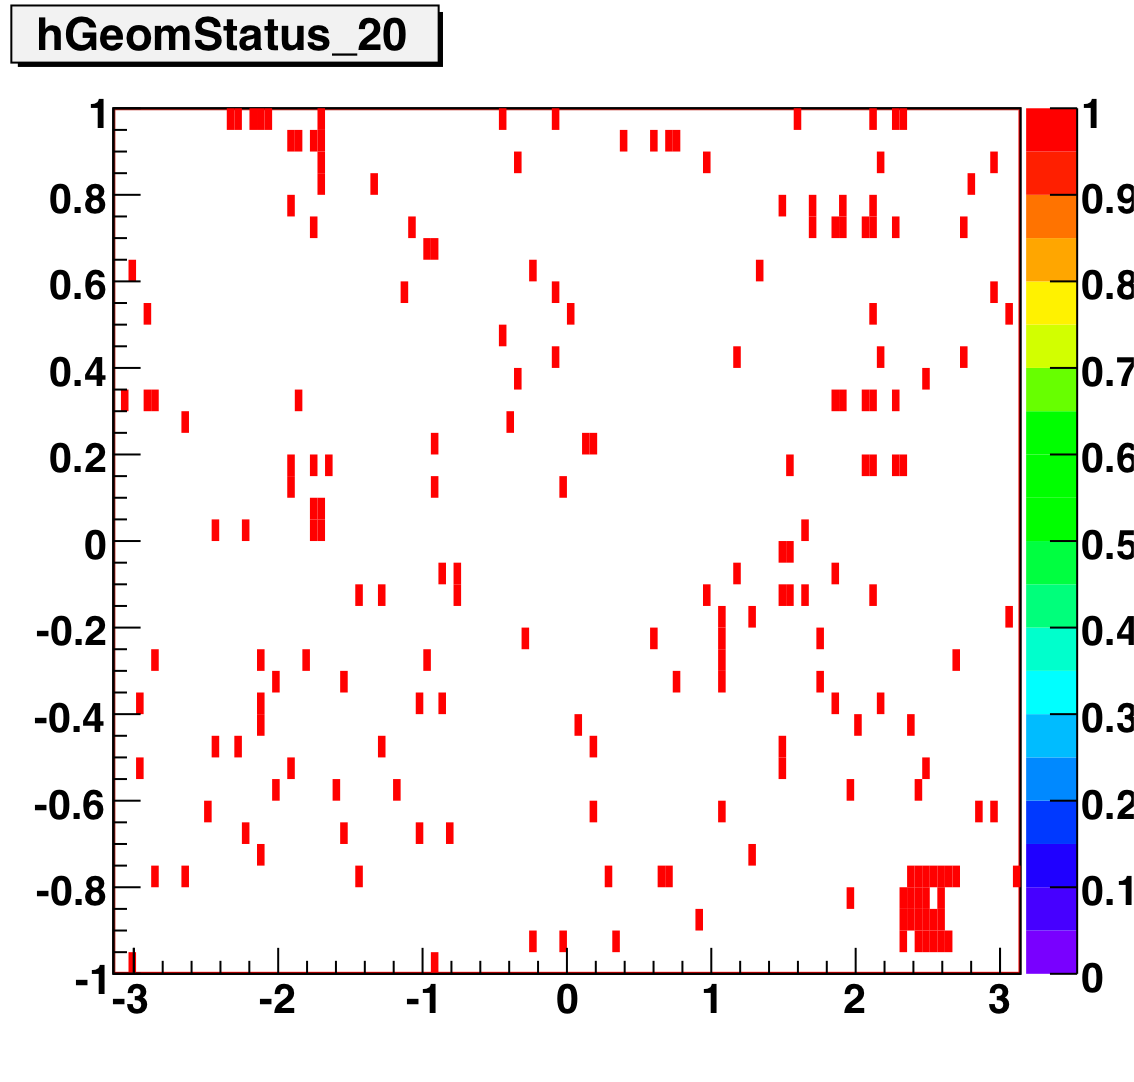
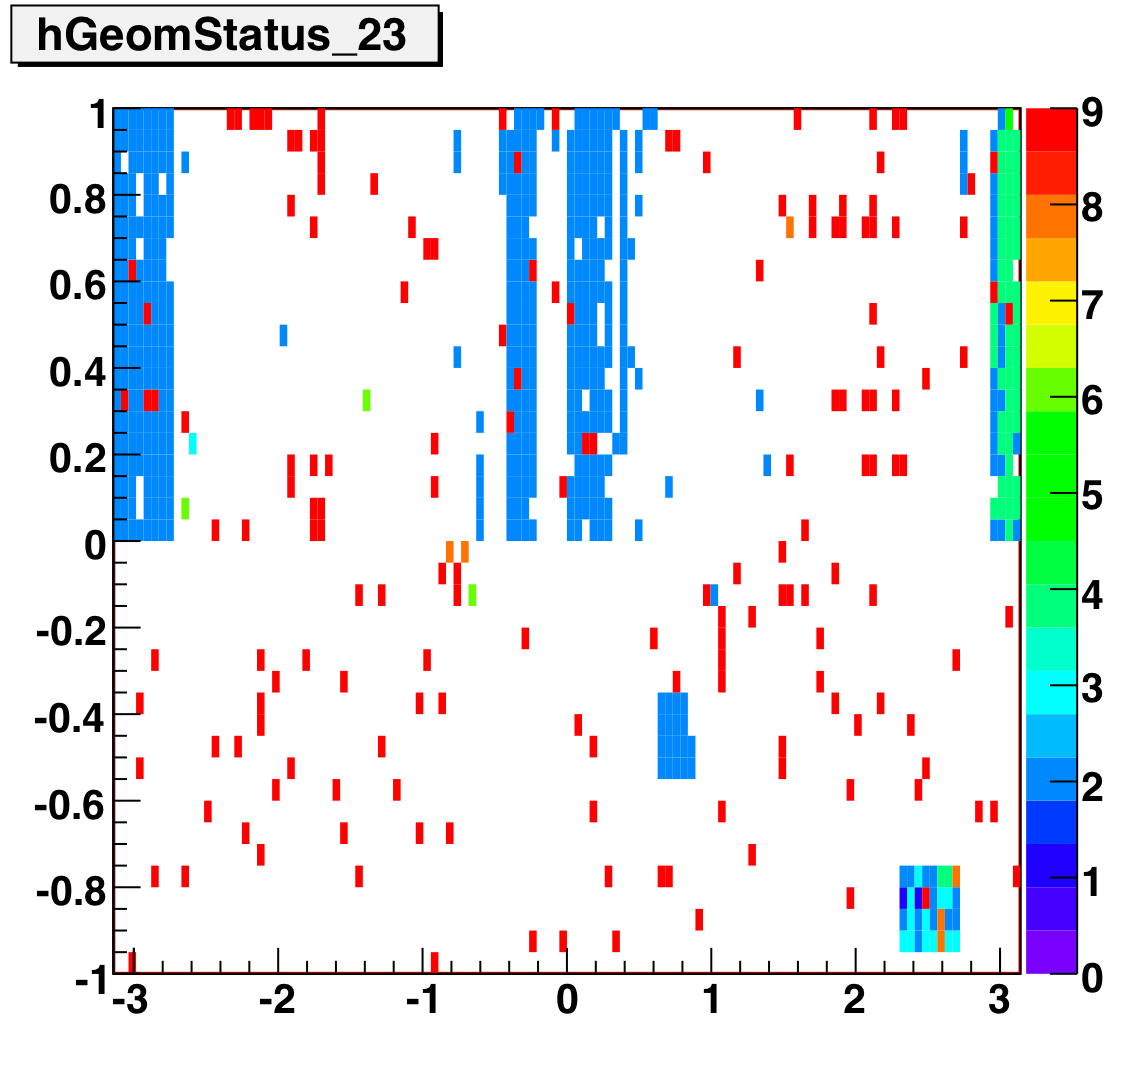
The below plots show the status as a function of phi and eta for different days representing different status periods. The title of the histogram refers to the relative day in the second longitudinal period (e.g. hGeomStatus_5 is for the fifth day of long-2.) The x and y axes correspond to detector phi and eta, and any space that is not white is considered a 'bad' tower. As you can see, for most of the barell for most of the time, most of the towers are good. Only for specific day ranges are there chunks of the barrel missing.
SMD Status
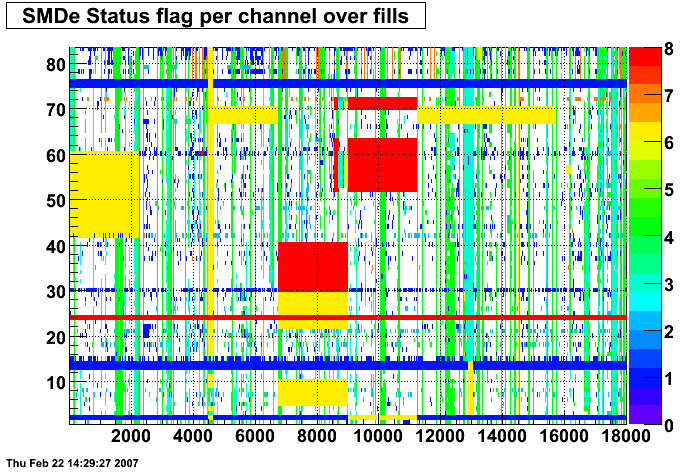
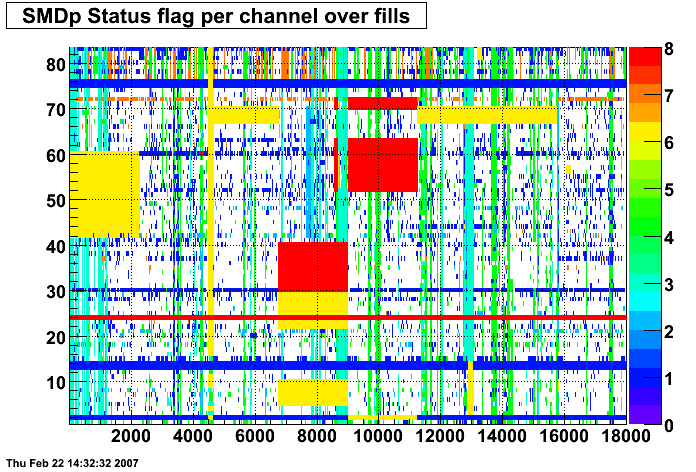
These two plots were made by Priscilla and they show the SMD status flags for SMD strips vs. Fill number. In these plots the strip number is plotted along the X-axis and the fill index number is plotted along the Y-Axis. Priscilla's fill index list can be found here. The important range for my particular analysis (i.e. the second longitudinal range) runs between fill indices 41 - 74. For my analysis I ignore any SMD strip that has a status other than good (== 0).
SMD Status Geometry
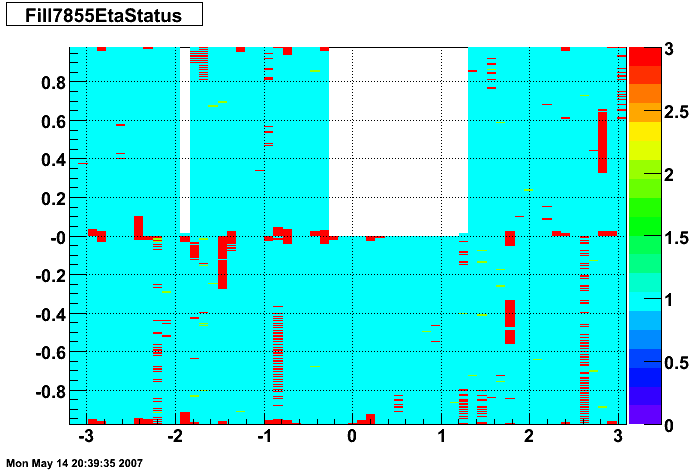
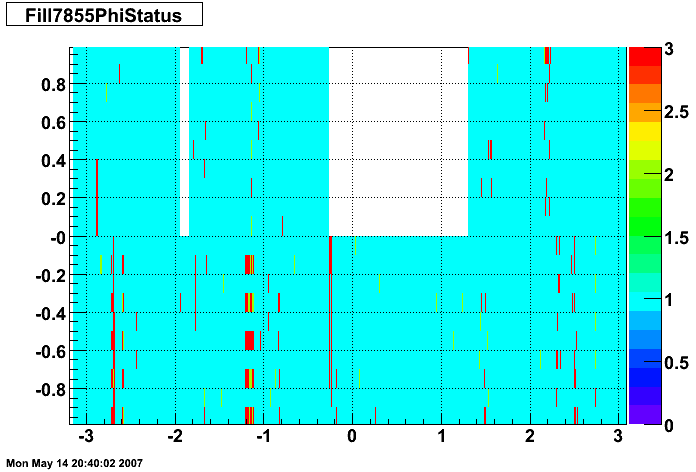
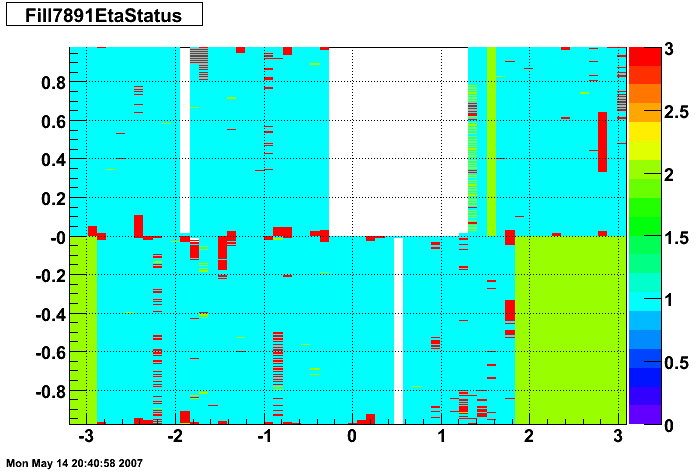
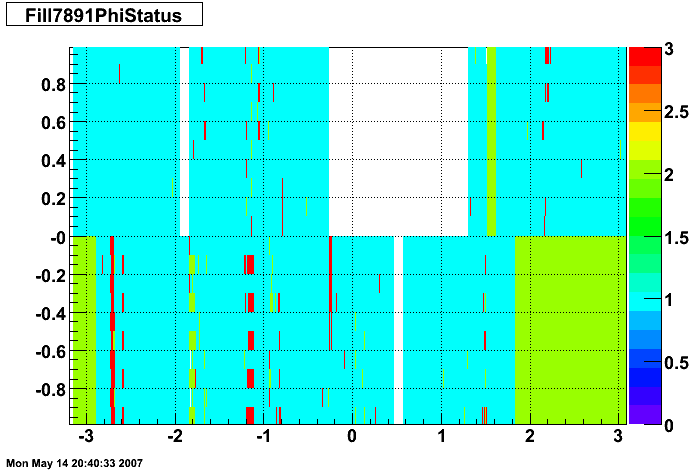
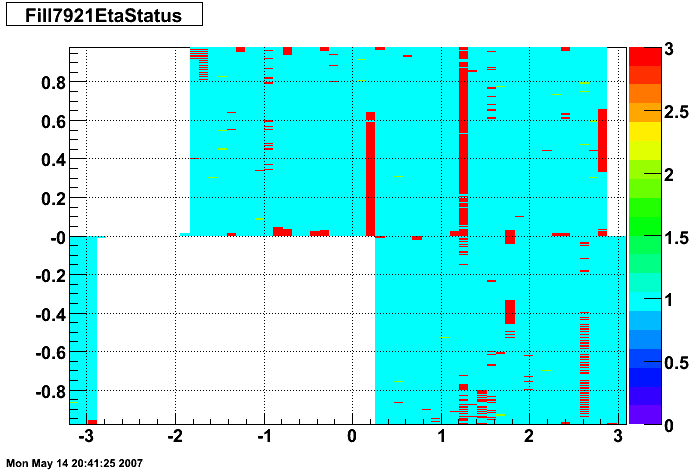
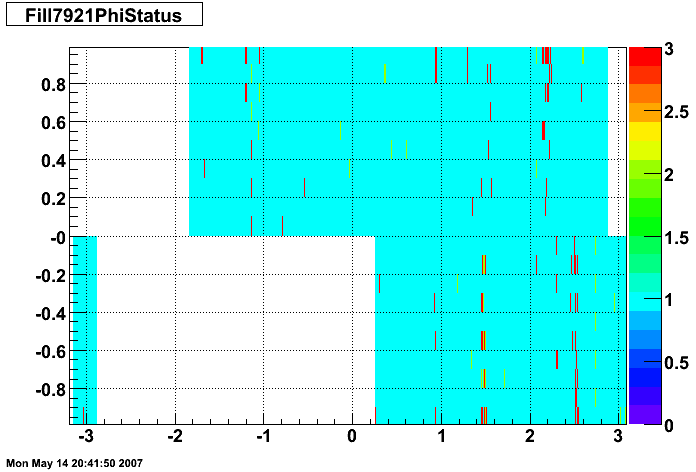
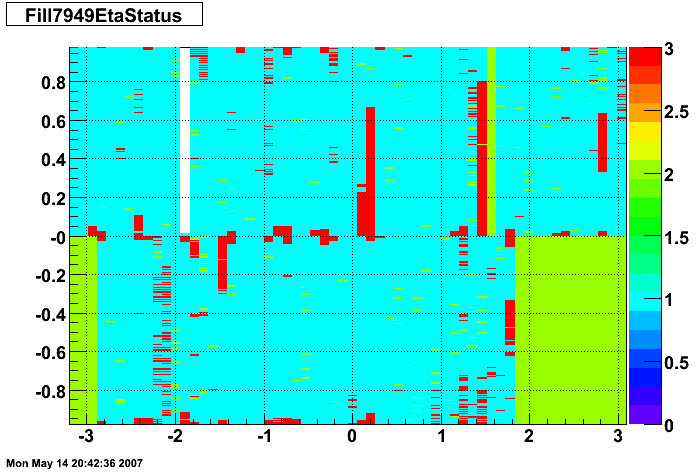
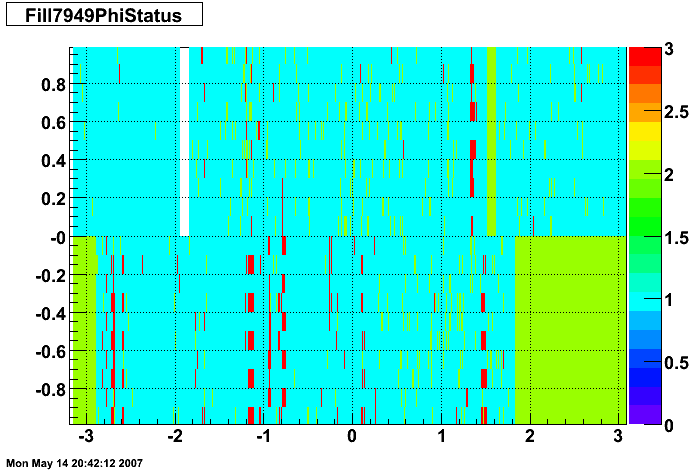
The plots below show the smd status as a function of geometry. The location of the strip in eta-phi space (w/ phi on the x axis and eta on the y axis.) You can see the eta and phi strip planes for four different fills (representative of different configurations) 7855, 7891, 7921, and 7949. Using Priscilla's iindexing these fills correspond to fills 46, 57, 68, and 72 in the above plots. We can see that these runs mark the beginning of major changes in the status tables, and each plot below represents a relativley stable running period. For my analysis I consider any area that is not light blue (i.e. any area with status other than 1) to be bad. Please note the difference between the SMD geometry plots and the BTOW geometry plots, namely, in the SMD plots whitespace represents 'bad' strips, whereas in the BTOW plots whitespace represents 'good' towers. All plots below were made by Priscilla.

This is a plot of the tower status as a function of relative day (since the start of the second longitudinal period.) The 4800 towers are on the Y-Axis and Days are on the X axis. A dot means that that tower had a status other than good during that time period.
Tower Status Geometry
The below plots show the status as a function of phi and eta for different days representing different status periods. The title of the histogram refers to the relative day in the second longitudinal period (e.g. hGeomStatus_5 is for the fifth day of long-2.) The x and y axes correspond to detector phi and eta, and any space that is not white is considered a 'bad' tower. As you can see, for most of the barell for most of the time, most of the towers are good. Only for specific day ranges are there chunks of the barrel missing.


SMD Status


These two plots were made by Priscilla and they show the SMD status flags for SMD strips vs. Fill number. In these plots the strip number is plotted along the X-axis and the fill index number is plotted along the Y-Axis. Priscilla's fill index list can be found here. The important range for my particular analysis (i.e. the second longitudinal range) runs between fill indices 41 - 74. For my analysis I ignore any SMD strip that has a status other than good (== 0).
SMD Status Geometry
The plots below show the smd status as a function of geometry. The location of the strip in eta-phi space (w/ phi on the x axis and eta on the y axis.) You can see the eta and phi strip planes for four different fills (representative of different configurations) 7855, 7891, 7921, and 7949. Using Priscilla's iindexing these fills correspond to fills 46, 57, 68, and 72 in the above plots. We can see that these runs mark the beginning of major changes in the status tables, and each plot below represents a relativley stable running period. For my analysis I consider any area that is not light blue (i.e. any area with status other than 1) to be bad. Please note the difference between the SMD geometry plots and the BTOW geometry plots, namely, in the SMD plots whitespace represents 'bad' strips, whereas in the BTOW plots whitespace represents 'good' towers. All plots below were made by Priscilla.


»
- Printer-friendly version
- Login or register to post comments
