- BEMC
- BTOF
- DAQ
- Detector Upgrades
- EEMC
- EPD
- 2017 cosmic ray tests at OSU and BNL
- Calibrations
- EPD Meetings
- EPD Slow-Control Manual
- EPD-GSTAR
- IV Scan
- Individual's pages
- Known issues and problems
- Mapping
- Offline DataBase
- Operations 2017
- Operations 2018
- Operations 2019
- Operations 2024
- Operations 2025
- Operations 2025
- Software
- Start-of-run EPD tasks and instructions
- Useful EPD documents
- Useful Links
- ETOF
- FCS
- FGT
- FPD & FMS & FPS
- FTPC
- FTT
- HFT
- HLT
- L3
- MTD
- MTD NPS Maps
- PMD
- PP2PP
- RICH
- Roman Pot Phase II*
- Run-18 calibrations
- SSD
- SVT
- Slow Controls
- TPC
- TRG
- Trigger Detectors
- VPD
- test
Cosmic tests at BNL
Updated on Wed, 2018-05-30 13:36 by adams92. Originally created by lisa on 2017-06-05 07:06.
Under:
Cosmic tests at BNL - strange results (Dec. 7, 2017)
All of the relevant plots, only a few of which are shown in this blog as examples, can be found here: https://drupal.star.bnl.gov/STAR/blog/adams92/te-chuan-huangs-plots-cosmic-tests-bnl
So far, here at BNL, we have taken 7 full cosmic runs. The cosmic runs use 4 large (~0.1 m wide by ~1 m long) paddles and tests 3 supersectors. One pair of paddles sits above the supersectors and another pair sits below. They can only cover half of a supersector, so we do a run with the odds covered and then do a separate run with the evens covered. The paddles can be used to determine the position and incident angle of each cosmic ray; however, we have been using the supersectors as offline triggers to isolate vertical cosmic rays (as was done at OSU). Some more detail is given in my presentation from this week's EPD meeting: https://drupal.star.bnl.gov/STAR/system/files/Cosmic%20Ray%20Testing%20at%20BNL.pdf
We realized earlier today that two of the 7 cosmic runs have strange results. These two runs were with (in one configuration) supersectors 21, 29, and 30 and (in another configuration) supersectors 23, 25, and 27. The strange results are:
1.1) The "zero" channels, which are non-existent supersector tiles, show what seems to be MIP peaks. There should of course be nothing.
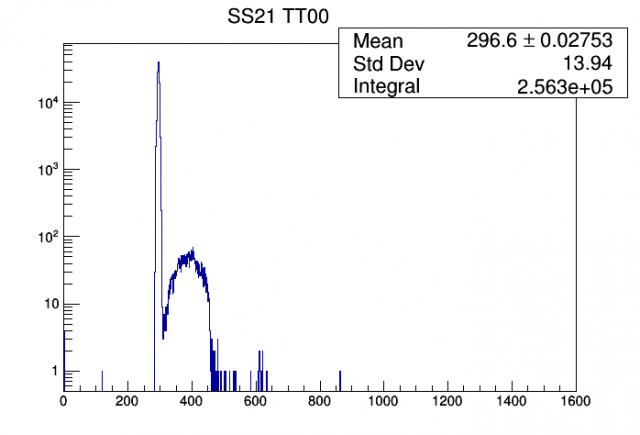 SS21_TT00:  
For all 6 supersectors in the aforementioned "problem" runs, the tile 0 ADC distributions look like this.
1.2) For the configuration with supersectors 02, 03, and 04, the tile 0 ADCs also show what seem to be a very small MIP peak.
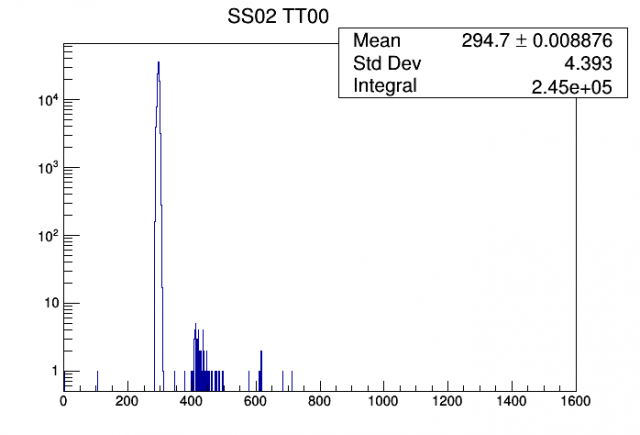 SS02_TT00:  
For all 3 supersectors, this is seen in tile 0. In fact, this configuration (even tiles of supersectors 02, 03, and 04) was taken twice, and each 24-hour run shows this behavior in all 3 supersectors.
2.1) The ADC distributions do not represent standard MIP peaks. There is a bump to the right of the peak.
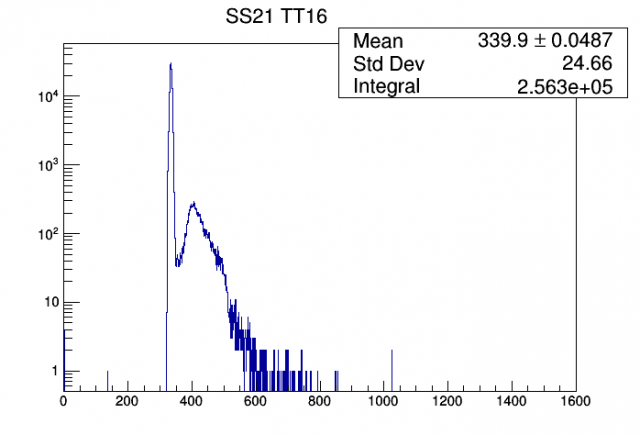 SS21_TT16:  
You guessed it: this is seen for all even tiles of supersectors 21, 23, 25, 27, 29, and 30. Supersectors 02, 03, and 04, which had the very small tile 0 signals, do not show this bump.
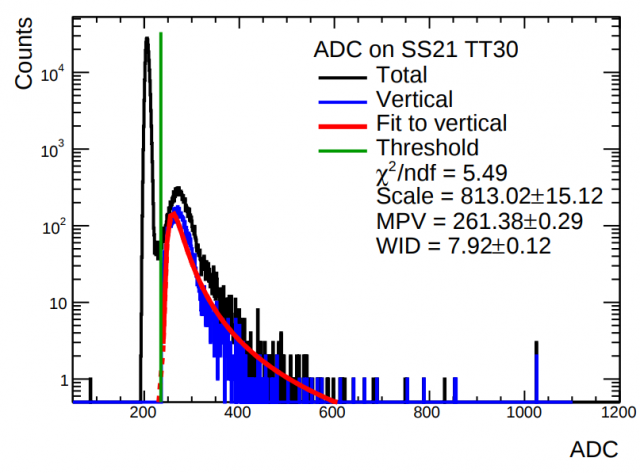
2.1)The bump to the right of the peak persists (is not reduced in height) after a vertical cosmic ray cut for the small tiles, but it is significantly reduced for the larger tiles.
This is simply attributed to the fact that larger tiles have more statistics, so the shoulder is drowned out.
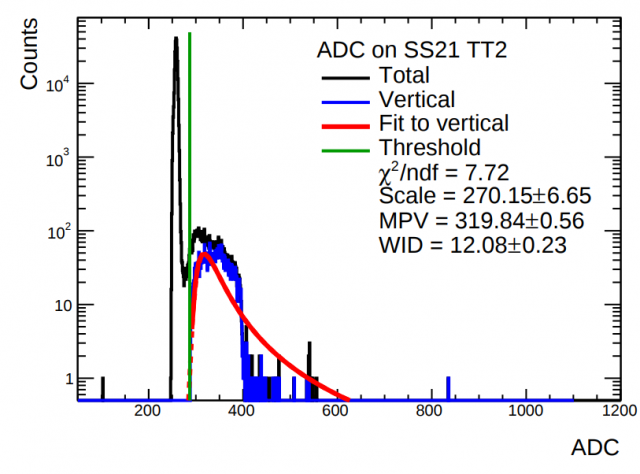 SS21_TT02_vertical:  
 SS21_TT30_vertical:  
At this point, I feel like I don't have to say that this behavior is true of supersectors 21, 23, 25, 27, 29, and 30.
Some notes:
1) The same fiber bundles are being used for all runs.
2) The same ADC channels, receiver cards, and trigger paddles are being used for the even and the odds.
3) Vertical cosmics are determined offline from the supersectors by requiring hits above some threshold in the same tile number of each supersector.
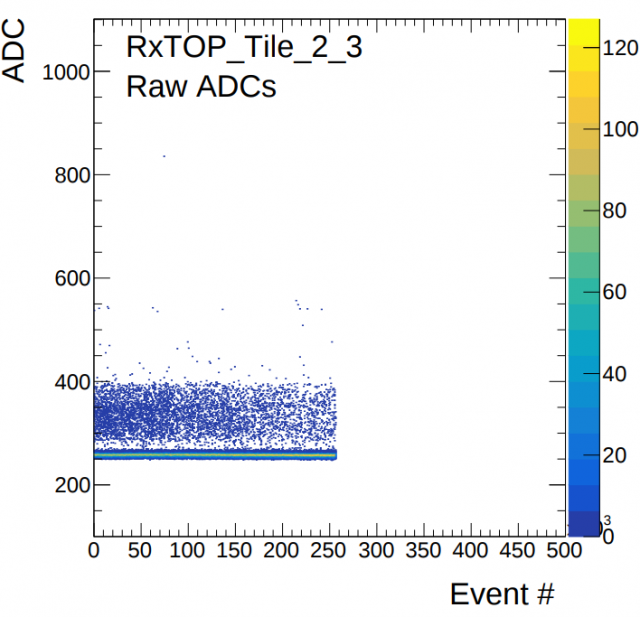
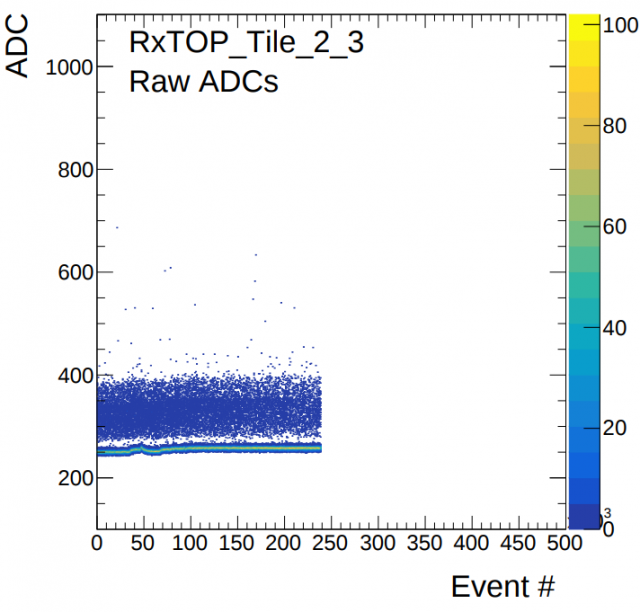
4) At OSU, we saw some random spikes and drops in the ADCs that were generally short lived but significant in magnitude. Here, they have been pretty stable.
 SS21_TT02_strip:  
 SS25_TT02_strip:  
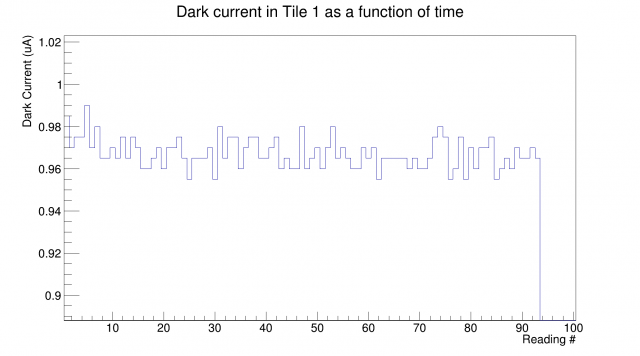
5) At OSU, when performing the heat map tests at high bias voltage (~66 V), we saw the dark current walk in each tile independently.
 DarkWalk_TT01:  
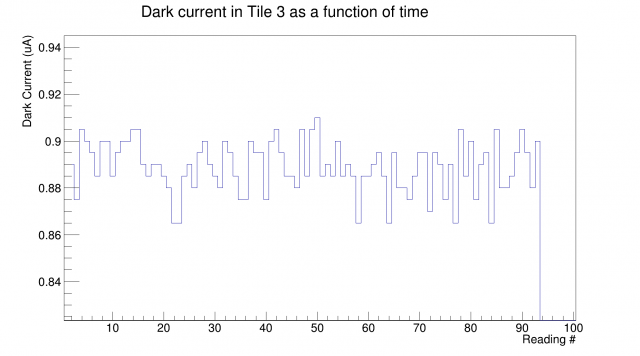 DarkWalk_TT03:  
A profile histogram showing all odd tile dark currents walking on average:
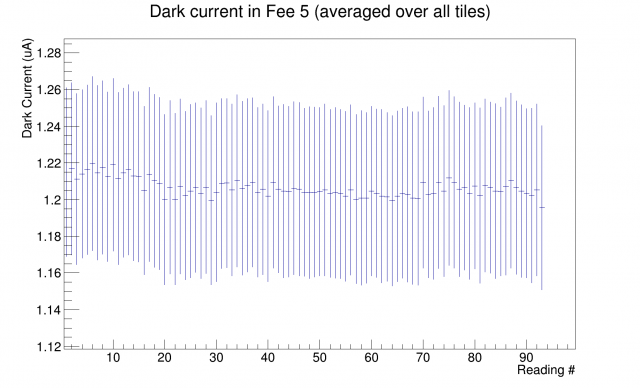 DarkWalk_FEE5:  
6) (Dec. 8th) Tim Camarda and I looked inside the FEE box to make sure everything was connected properly. We found nothing apparently wrong with the setup and proceeded to switch the FSCs in FEEs 5 and 6 (as well as their corresponding RX cables in the back of the corresponding RX card) to read the even tiles out of an "odd" FEE (i.e. a FEE previously used to measure only odd tiles). We didn't take enough data to see something wrong with the ADC distributions, but we DID see a non-pedestal signal in tile 0. I can't imagine there is anything physically creating a signal (let's just take that probability to be 0), so this implies that whatever problem we are seeing exists in ALL FEE cards and only happened to show up during the even runs.
7) The transmission of the fiber bundles we are using here at BNL are:
FB 10: -62%
FB 11: -62%
FB 17: -63%
The transmissions of the fiber bundles used at OSU are:
FB 02: -55%
FB 03: -54%
FB 04: -63%
FB 05: -62%
8) (Dec. 11th) It was realized in this week's EPD meeting that events with more than a few tiles firing were not thrown out; this cut was being applied for the cosmic testing at OSU. Te-Chuan Huang plotted the ADC_{Tile 0} vs the ADC_{Tile X}, and we see three main features: a pedestal (which is all that we should get in theory), a diagonal line (which likely is the shoulder we see in the "big" problem even tiles), and some fuzz in-between.
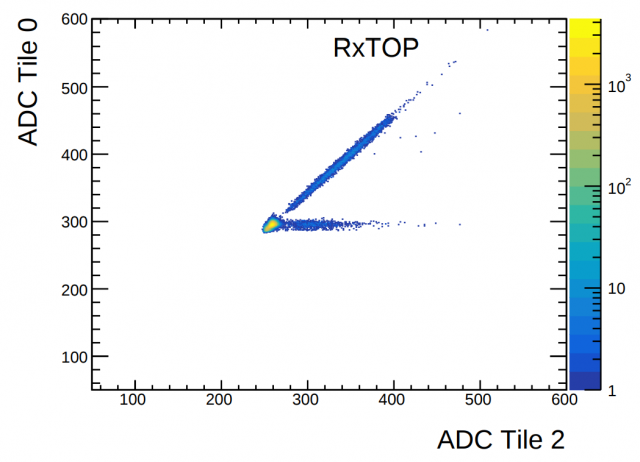 TOP_SS212930:  
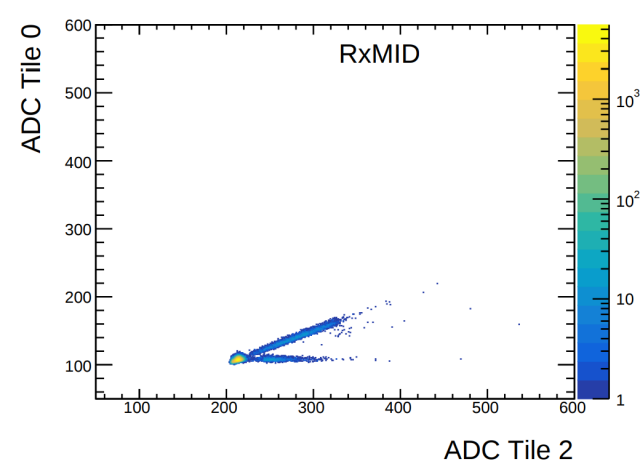 MID_SS212930:  
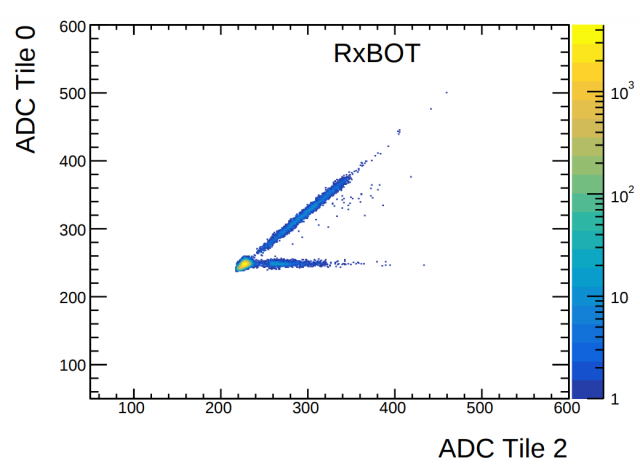 BOT_SS212930:  
This is plotted against ADC_{Tile 2}, but the same behavior exists for all tiles. The slopes are not the same in every case, but the slope associated with RxMID is consistently lower than the slopes of RxTOP and RxBOT. The diagonal is likely associated with all channels firing at once.
For the "small" problem runs, we see the same features: a pedestal, a diagonal, and some fuzz in-between. The difference is that there are fewer "diagonal" or "fuzz in-between" events in these runs.
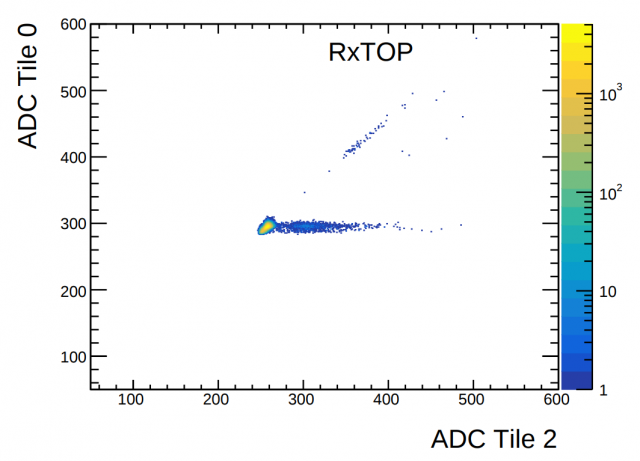 TOP_SS020304:  
It seems likely that the "small" and "big" problems are really the same, time-varying problem; that this problem just so happened not to be present during the odd runs, to be more dominant during the first two even runs, and not to be as dominant during the following even runs.
8) (Dec. 12th) In order to rule out cross talk at the FSC, I produced a cross-talk heat map including tile 0. The "Excess Current With Source [underneath]" obviously doesn't make sense for tile 0, so I took it to be 0.1 uA (other tiles typically have an excess of 0.5 uA) to make the colors more discernible.
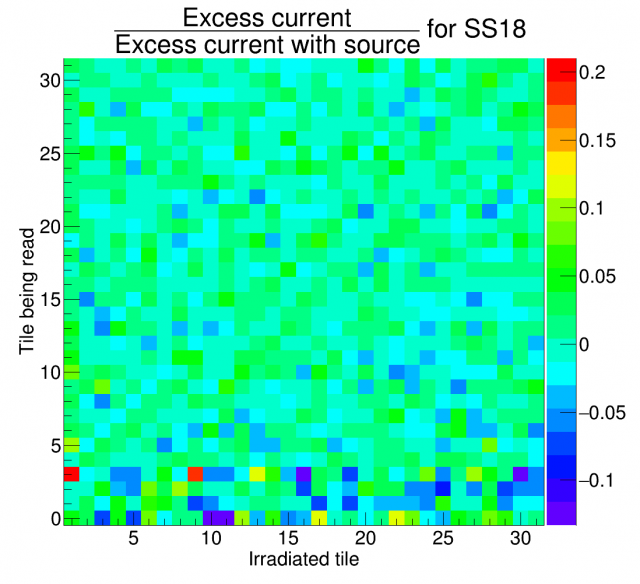 FSC_xTalk:  
We see from the bottom row (the only relevant part of the plot) that there is just noise. If the FSC cross talk was existent, we would see it between tile 0 and tiles 1, 2, 8, 9, and 10; we don't see that here.
9) (Dec. 12th) In order to see whether the problem is isoloated to a given FEE/Rx card or if it is global, ADC_{tile 0, RxTOP} was plotted against ADC_{tile X, RxMID} and ADC_{tile X, RxBOT}.
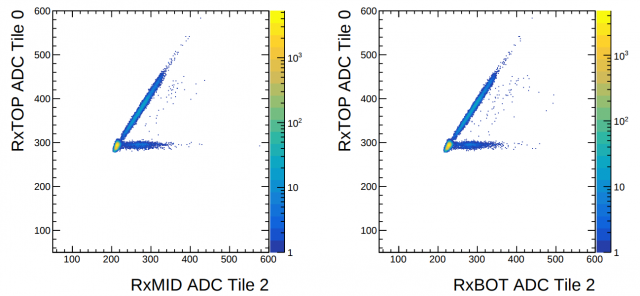 TOP0vsMIDandBOT:  
There are no noticeable differences between these plots and those within the same Rx card (see point 8), indicating that this is a global problem
10) (Dec. 12th) In an attempt to remove the diagonal and "fuzz" addressed in point 8, a cut was applied to throw away events with more than 10 tiles in a given supersector reading hits. This removed most of the diagonal and fuzz.
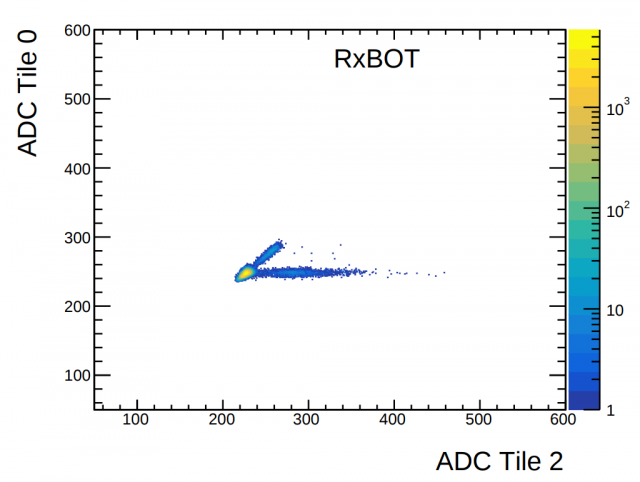 ADC_10hitCut:  
There is a soft cutoff in ADC_{tile 0} for each plot.
11) (Dec. 12th) Just to make sure that this problem is not isolated to tile 0, ADC_{tile 10} was plotted against ADC_{tile X} with the cut mentioned in point 9.
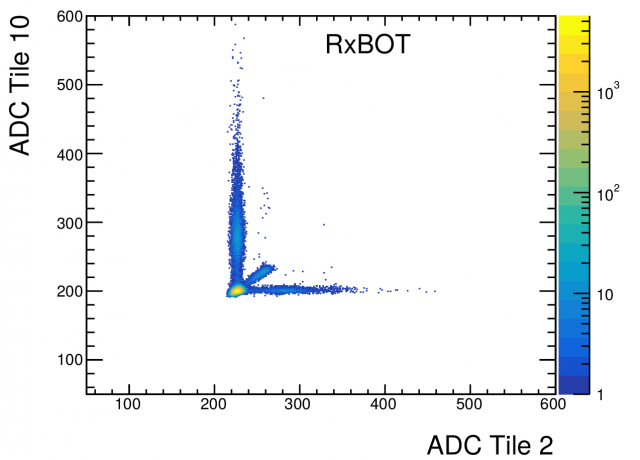 ADC_tile10vsTileX:  
Unsurprisingly, we see that this problem is not isolated to tile 0.
___________________________________________________________________________________________________________________________________________________________________________________________
All of the relevant plots, only a few of which are shown in this blog as examples, can be found here: https://drupal.star.bnl.gov/STAR/blog/adams92/te-chuan-huangs-plots-cosmic-tests-bnl
So far, here at BNL, we have taken 7 full cosmic runs. The cosmic runs use 4 large (~0.1 m wide by ~1 m long) paddles and tests 3 supersectors. One pair of paddles sits above the supersectors and another pair sits below. They can only cover half of a supersector, so we do a run with the odds covered and then do a separate run with the evens covered. The paddles can be used to determine the position and incident angle of each cosmic ray; however, we have been using the supersectors as offline triggers to isolate vertical cosmic rays (as was done at OSU). Some more detail is given in my presentation from this week's EPD meeting: https://drupal.star.bnl.gov/STAR/system/files/Cosmic%20Ray%20Testing%20at%20BNL.pdf
We realized earlier today that two of the 7 cosmic runs have strange results. These two runs were with (in one configuration) supersectors 21, 29, and 30 and (in another configuration) supersectors 23, 25, and 27. The strange results are:
1.1) The "zero" channels, which are non-existent supersector tiles, show what seems to be MIP peaks. There should of course be nothing.
 SS21_TT00:  
For all 6 supersectors in the aforementioned "problem" runs, the tile 0 ADC distributions look like this.
1.2) For the configuration with supersectors 02, 03, and 04, the tile 0 ADCs also show what seem to be a very small MIP peak.
 SS02_TT00:  
For all 3 supersectors, this is seen in tile 0. In fact, this configuration (even tiles of supersectors 02, 03, and 04) was taken twice, and each 24-hour run shows this behavior in all 3 supersectors.
2.1) The ADC distributions do not represent standard MIP peaks. There is a bump to the right of the peak.
 SS21_TT16:  
You guessed it: this is seen for all even tiles of supersectors 21, 23, 25, 27, 29, and 30. Supersectors 02, 03, and 04, which had the very small tile 0 signals, do not show this bump.
2.1)
 SS21_TT02_vertical:  
 SS21_TT30_vertical:  
At this point, I feel like I don't have to say that this behavior is true of supersectors 21, 23, 25, 27, 29, and 30.
Some notes:
1) The same fiber bundles are being used for all runs.
2) The same ADC channels, receiver cards, and trigger paddles are being used for the even and the odds.
3) Vertical cosmics are determined offline from the supersectors by requiring hits above some threshold in the same tile number of each supersector.
4) At OSU, we saw some random spikes and drops in the ADCs that were generally short lived but significant in magnitude. Here, they have been pretty stable.
 SS21_TT02_strip:  
 SS25_TT02_strip:  
5) At OSU, when performing the heat map tests at high bias voltage (~66 V), we saw the dark current walk in each tile independently.
 DarkWalk_TT01:  
 DarkWalk_TT03:  
A profile histogram showing all odd tile dark currents walking on average:
 DarkWalk_FEE5:  
6) (Dec. 8th) Tim Camarda and I looked inside the FEE box to make sure everything was connected properly. We found nothing apparently wrong with the setup and proceeded to switch the FSCs in FEEs 5 and 6 (as well as their corresponding RX cables in the back of the corresponding RX card) to read the even tiles out of an "odd" FEE (i.e. a FEE previously used to measure only odd tiles). We didn't take enough data to see something wrong with the ADC distributions, but we DID see a non-pedestal signal in tile 0. I can't imagine there is anything physically creating a signal (let's just take that probability to be 0), so this implies that whatever problem we are seeing exists in ALL FEE cards and only happened to show up during the even runs.
7) The transmission of the fiber bundles we are using here at BNL are:
FB 10: -62%
FB 11: -62%
FB 17: -63%
The transmissions of the fiber bundles used at OSU are:
FB 02: -55%
FB 03: -54%
FB 04: -63%
FB 05: -62%
8) (Dec. 11th) It was realized in this week's EPD meeting that events with more than a few tiles firing were not thrown out; this cut was being applied for the cosmic testing at OSU. Te-Chuan Huang plotted the ADC_{Tile 0} vs the ADC_{Tile X}, and we see three main features: a pedestal (which is all that we should get in theory), a diagonal line (which likely is the shoulder we see in the "big" problem even tiles), and some fuzz in-between.
 TOP_SS212930:  
 MID_SS212930:  
 BOT_SS212930:  
This is plotted against ADC_{Tile 2}, but the same behavior exists for all tiles. The slopes are not the same in every case, but the slope associated with RxMID is consistently lower than the slopes of RxTOP and RxBOT. The diagonal is likely associated with all channels firing at once.
For the "small" problem runs, we see the same features: a pedestal, a diagonal, and some fuzz in-between. The difference is that there are fewer "diagonal" or "fuzz in-between" events in these runs.
 TOP_SS020304:  
It seems likely that the "small" and "big" problems are really the same, time-varying problem; that this problem just so happened not to be present during the odd runs, to be more dominant during the first two even runs, and not to be as dominant during the following even runs.
8) (Dec. 12th) In order to rule out cross talk at the FSC, I produced a cross-talk heat map including tile 0. The "Excess Current With Source [underneath]" obviously doesn't make sense for tile 0, so I took it to be 0.1 uA (other tiles typically have an excess of 0.5 uA) to make the colors more discernible.
 FSC_xTalk:  
We see from the bottom row (the only relevant part of the plot) that there is just noise. If the FSC cross talk was existent, we would see it between tile 0 and tiles 1, 2, 8, 9, and 10; we don't see that here.
9) (Dec. 12th) In order to see whether the problem is isoloated to a given FEE/Rx card or if it is global, ADC_{tile 0, RxTOP} was plotted against ADC_{tile X, RxMID} and ADC_{tile X, RxBOT}.
 TOP0vsMIDandBOT:  
There are no noticeable differences between these plots and those within the same Rx card (see point 8), indicating that this is a global problem
10) (Dec. 12th) In an attempt to remove the diagonal and "fuzz" addressed in point 8, a cut was applied to throw away events with more than 10 tiles in a given supersector reading hits. This removed most of the diagonal and fuzz.
 ADC_10hitCut:  
There is a soft cutoff in ADC_{tile 0} for each plot.
11) (Dec. 12th) Just to make sure that this problem is not isolated to tile 0, ADC_{tile 10} was plotted against ADC_{tile X} with the cut mentioned in point 9.
 ADC_tile10vsTileX:  
Unsurprisingly, we see that this problem is not isolated to tile 0.
___________________________________________________________________________________________________________________________________________________________________________________________
»
- Printer-friendly version
- Login or register to post comments
