- General information
- Data readiness
- Calibration
- BeamLine Constraint
- Run 10, Au+Au 200 GeV
- Run 10, Au+Au 39 GeV
- Run 11
- Run 12
- Run 13
- Run 15 pAu200
- Run 15 pp200
- Run 2 (200 GeV pp)
- Run 3 (200 GeV dAu and pp)
- Run 4 (pp)
- Run 5
- Run 6 (pp)
- Run 6: Issues with 2006 BeamLine calibration
- Run 7 (200GeV AuAu)
- Run 8 (200 GeV dAu and pp)
- Run 8 (9GeV AuAu)
- Run 9 (pp500 and pp200)
- Run 9, pp200 GeV Full Field (FF) - new calibration (May 2012)
- Calibration Run preparation
- Calibration Schedules
- Calibration topics by dataset
- Docs
- STAR Automated Calibration Project
- SVT Calibrations
- TPC Calibrations
- BeamLine Constraint
- Databases
- Quality Assurance
- Calibration
- Grid and Cloud
- Infrastructure
- Machine Learning
- Offline Software
- Production
- S&C internal group meetings
- Test tree
Run 6: Issues with 2006 BeamLine calibration
Updated on Wed, 2009-03-18 18:00. Originally created by genevb on 2006-08-22 19:15.
Under:
From the beamline constraint calibration which has been done for the BeamLine constraint calibration for p+p 2006, there is some reason for concern over the relatively large fluctuations seen in the vertical position of the beamline constraint during periods II and III of the run (the transverse polarization period and the second longitudinal polarization period). To investigate this further, I have examined the beamline constraint as a function of luminosity (as measured by the east+west sum of the zdc rates).
In order to get the zdc information, I averaged all zdc values of each run to use a a single value for each run. I plot here the average for each day just for demonstration.
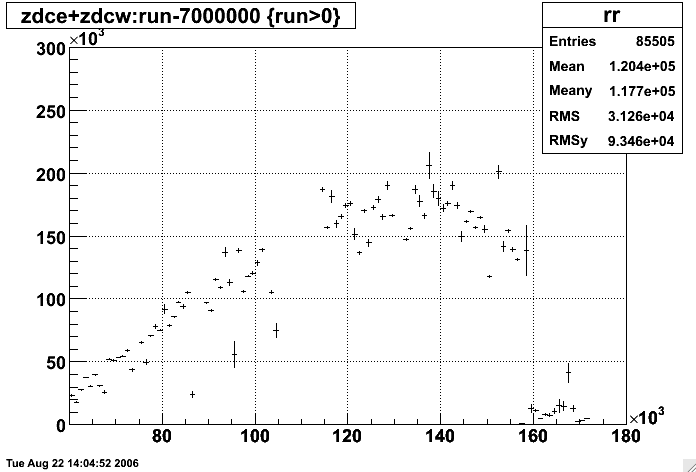
I will focus only on the 200 GeV running for now (periods I-III, up to day 157).
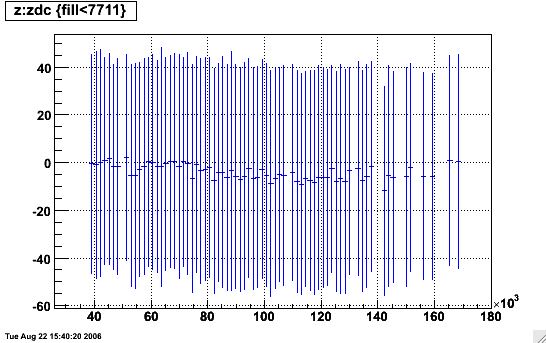
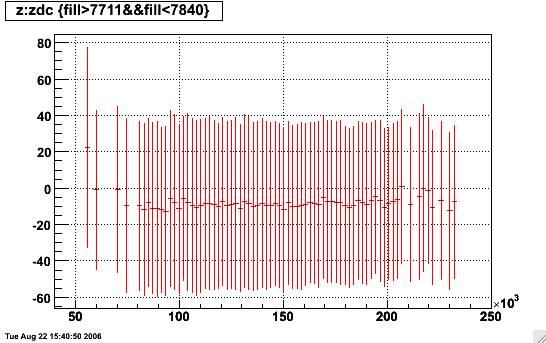
The first thing I looked at was my calibrated y-intercept of the beamline constraint vs. zdc and zdc vs. fill number (which is pretty similar to the above plot), where zdc is averaged by Sum{zdc[run] * N_verts[run]} / N_verts[all]. In these plots, the color represents the run period: blue=I, red=II, black=III:
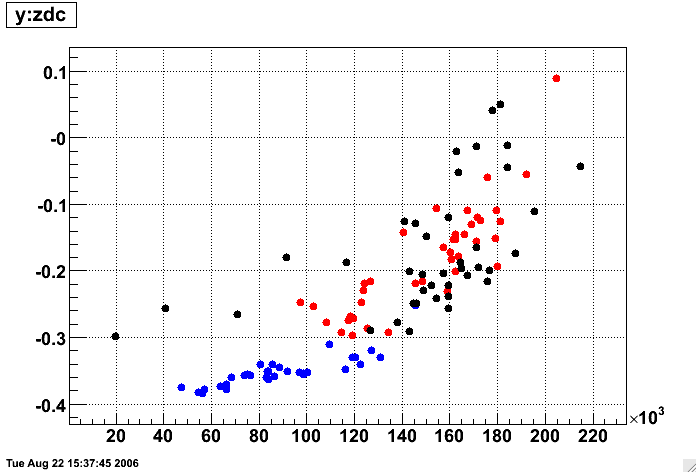
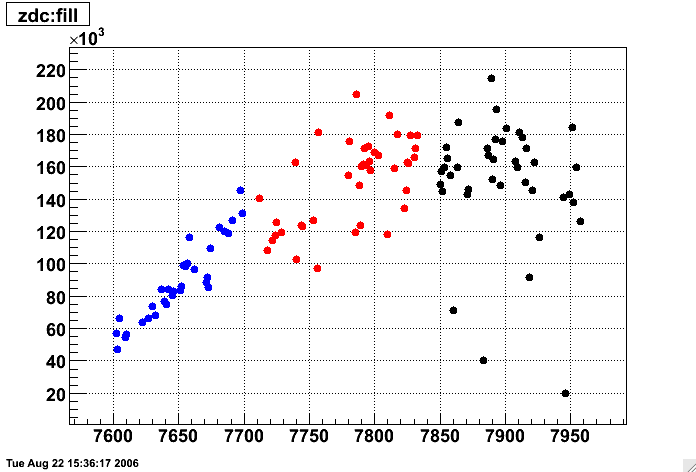
It is clear from these plots that there IS some correlation between y and zdc rate for all three periods. The first period also shows a strong correlation between zdc rate and fill (the RHIC luminosity was increasing as time progressed, and the luminosity plateaued for subsequent running). This information by itself is not enough to say whether there is a distortion in the TPC; it could simply mean that there is a correlation between how much luminosity the collider delivers and the vertical position of the beam, which is not all that unlikely.
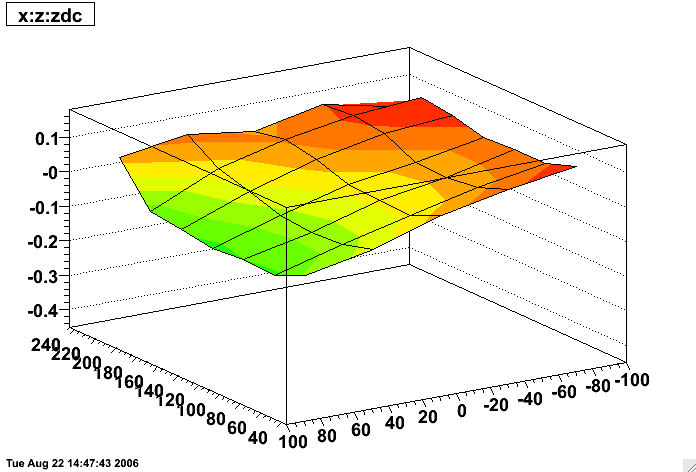
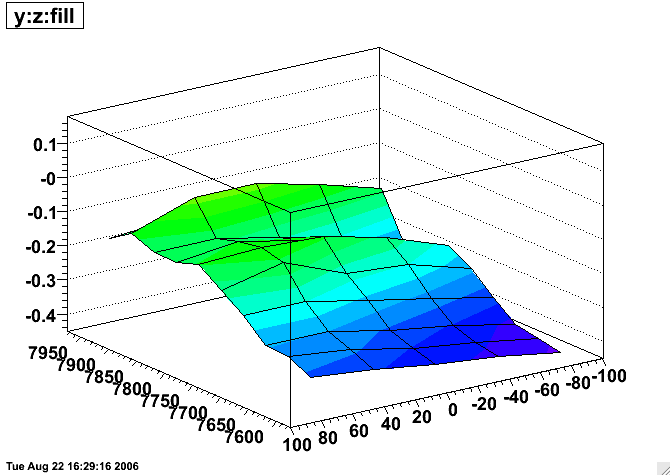
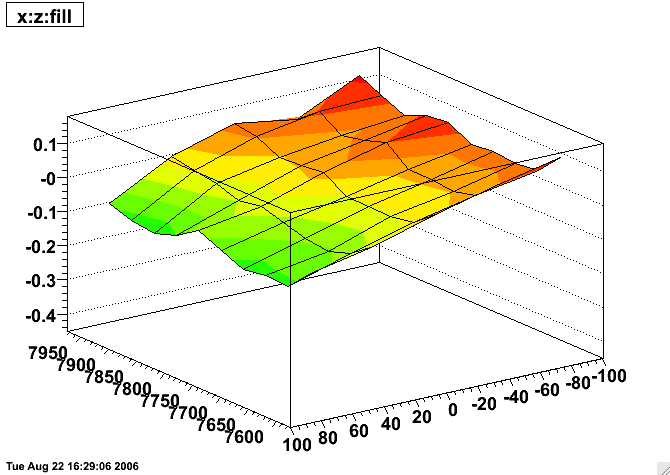
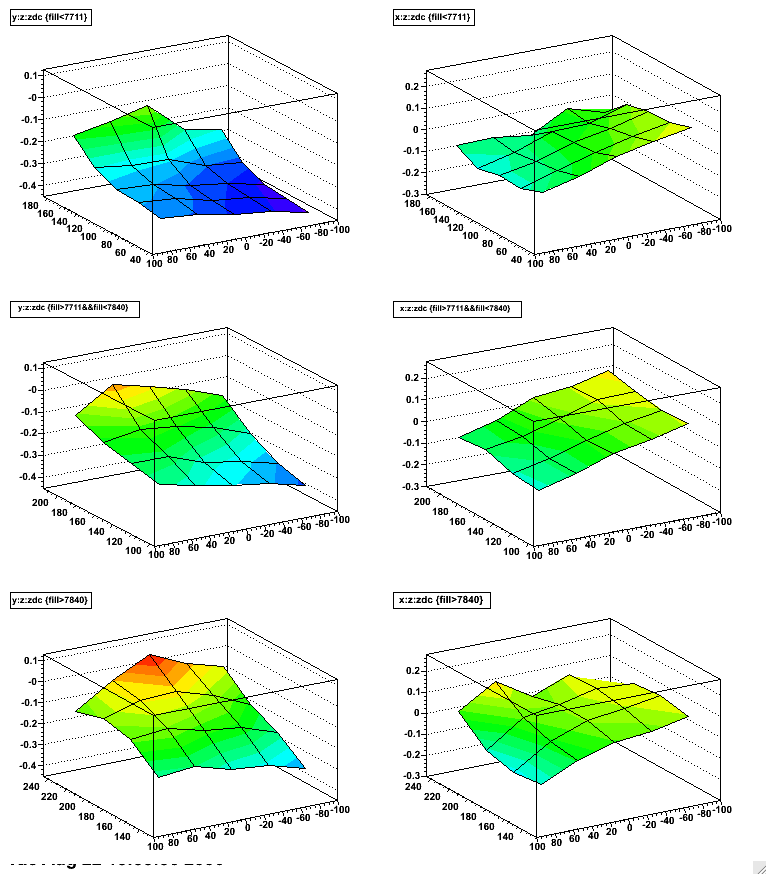
To investigate further, I created an ntuple with all the vertices used in the beamline calibrations and stored the fill number and zdc rate for each reconstructed vertex. Normally, the beamline is found by simply projecting the vertex positions onto plots of y vs. z, and x vs. z and fitting straight lines. But now I can plot differentially vs. zdc or fill, as I have done in the next 4 plots. In each plot, a single slice in zdc is a profile of y vs. z or x vs. z. The plots have z of the reconstructed vertices on the lower right horizontal axis, zdc rate divided by 1000 (or fill number ) on the lower left horizontal axis, and the profile of y for the vertical axis, and the scales are held identical for all four plots.
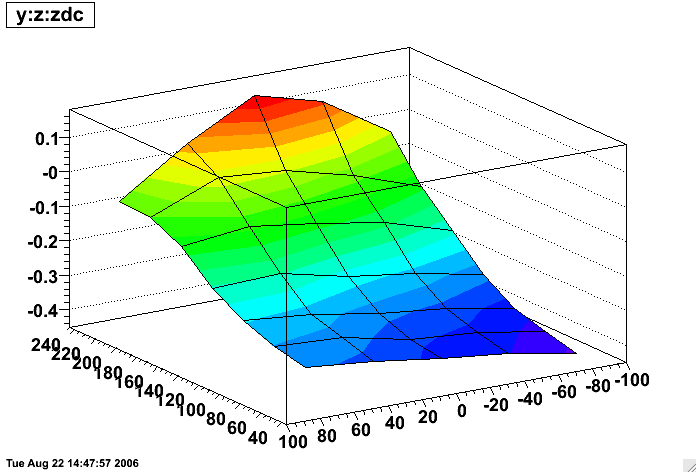
For some idea of the errors on these data, here is the error plot for the y:z:zdc plot (the x:z:zdc errors are nearly identical):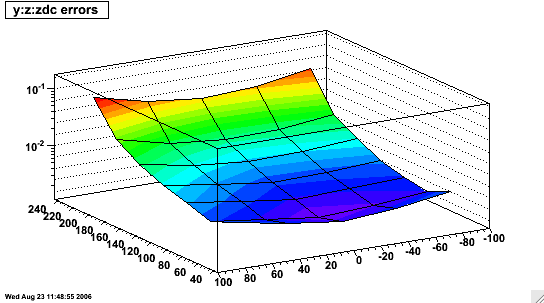
These plots possibly suffer to some degree from overlapping different run periods where different beam tunes were actually quite likely (the trade off is that they get improved statistics). So the next set of plots show y and x vs. zdc by period (arranged as periods I, II, III from top to bottom):
The above plots make it more clear that all three periods appear to have a z dependence to their y vs. z profiles at the highest luminosities recorded during those periods (NOTE: luminosities may actually extend both higher and lower than the plot axes, but have insufficient statistics to add appreciable information to the plots and have been cropped).
DISCUSSION:
The z dependence of the reconstructed vertices at high luminosity is a red flag that this is likely to be a distortion issue in the TPC (e.g. SpaceCharge whose distortion is largest for tracks near the central membrane). A hypothesis is that this is the old issue of particles going through just one side of the TPC from some kind of beam background. An interesting question is where the background must be to produce this effect. Azimuthally symmetric SpaceCharge (in full field data, not reveresed full field) causes tracks at positive x to want a vertex which is higher vertically, while tracks at negative x want a lower vertex; the effects should cancel. In order to raise the vertical position of the primary vertex, there would either need to be more of the standard SpaceCharge distribution at positive x (3 o'clock in the TPC), or a buildup of ionization only at either low radius (near the IFC) or large radius (near the OFC) at negative x (9 o'clock in the TPC). The former would mean simply an increased rotation of tracks at positive x due to the standard SpaceCharge distribution. The latter would actually be a decrease in the rotation of tracks at negative x, thereby failing to fully counter the effects of SpaceCharge at positive x. There could also be any combination of these three:
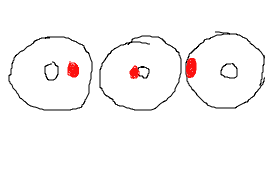
The third possibility may be the most intriguing as it may most closely match the backgrounds which have been documented in the past. It should also be stated clearly that reality could be a combination of a distortion and real shifts in the beam position as delivered by the collider. We want to correct for any of the former, and measure/calibrate any of the latter.
_________
As supplementary information, here are the z distributions ("profs" - spread profile) of vertices as a function of zdc in periods I, II, and III, showing that althought the mean position changes somewhat with run period, the distribution is rather stable as a function of zdc.
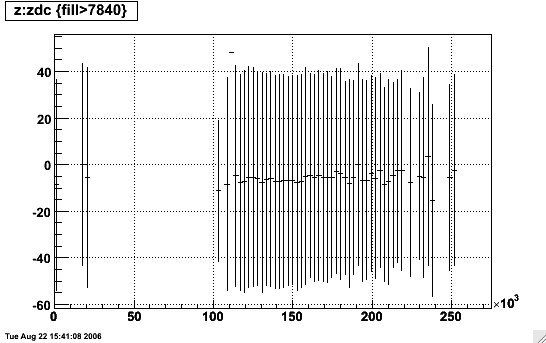
In order to get the zdc information, I averaged all zdc values of each run to use a a single value for each run. I plot here the average for each day just for demonstration.
I will focus only on the 200 GeV running for now (periods I-III, up to day 157).
The first thing I looked at was my calibrated y-intercept of the beamline constraint vs. zdc and zdc vs. fill number (which is pretty similar to the above plot), where zdc is averaged by Sum{zdc[run] * N_verts[run]} / N_verts[all]. In these plots, the color represents the run period: blue=I, red=II, black=III:
It is clear from these plots that there IS some correlation between y and zdc rate for all three periods. The first period also shows a strong correlation between zdc rate and fill (the RHIC luminosity was increasing as time progressed, and the luminosity plateaued for subsequent running). This information by itself is not enough to say whether there is a distortion in the TPC; it could simply mean that there is a correlation between how much luminosity the collider delivers and the vertical position of the beam, which is not all that unlikely.
To investigate further, I created an ntuple with all the vertices used in the beamline calibrations and stored the fill number and zdc rate for each reconstructed vertex. Normally, the beamline is found by simply projecting the vertex positions onto plots of y vs. z, and x vs. z and fitting straight lines. But now I can plot differentially vs. zdc or fill, as I have done in the next 4 plots. In each plot, a single slice in zdc is a profile of y vs. z or x vs. z. The plots have z of the reconstructed vertices on the lower right horizontal axis, zdc rate divided by 1000 (or fill number ) on the lower left horizontal axis, and the profile of y for the vertical axis, and the scales are held identical for all four plots.
For some idea of the errors on these data, here is the error plot for the y:z:zdc plot (the x:z:zdc errors are nearly identical):
Here is another plot of the the y vs. z data and its profile for low and high zdc rates where one can gain some perspective on the true spread of the data and the scale of the profile relative to it.
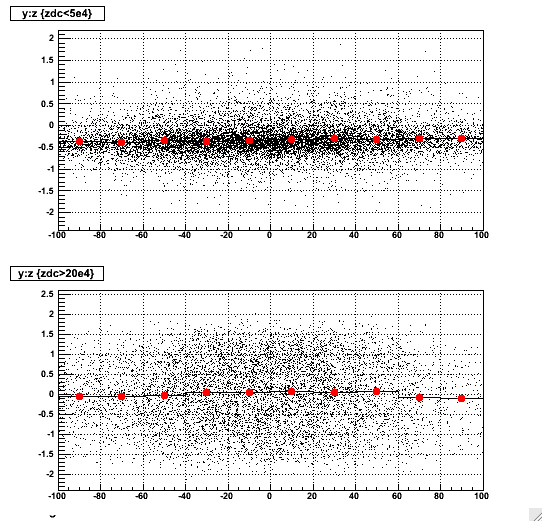
These plots show several points:
- x vs. z has essentially no dependence on fill, and has perhaps a small correlation with zdc
- y vs. z looks nicely linear at the lowest luminosities (which also correspond to the earliest fills)
- y vs. z shows a mild increase with early fill numbers, but not as clear a correlation with later fills
- y vs. z shows a dramatic increase with zdc rate
- y vs. z shows a modification from linearity with zdc rate, appearing to bulge at z values near the center of the TPC
These plots possibly suffer to some degree from overlapping different run periods where different beam tunes were actually quite likely (the trade off is that they get improved statistics). So the next set of plots show y and x vs. zdc by period (arranged as periods I, II, III from top to bottom):
The above plots make it more clear that all three periods appear to have a z dependence to their y vs. z profiles at the highest luminosities recorded during those periods (NOTE: luminosities may actually extend both higher and lower than the plot axes, but have insufficient statistics to add appreciable information to the plots and have been cropped).
DISCUSSION:
The z dependence of the reconstructed vertices at high luminosity is a red flag that this is likely to be a distortion issue in the TPC (e.g. SpaceCharge whose distortion is largest for tracks near the central membrane). A hypothesis is that this is the old issue of particles going through just one side of the TPC from some kind of beam background. An interesting question is where the background must be to produce this effect. Azimuthally symmetric SpaceCharge (in full field data, not reveresed full field) causes tracks at positive x to want a vertex which is higher vertically, while tracks at negative x want a lower vertex; the effects should cancel. In order to raise the vertical position of the primary vertex, there would either need to be more of the standard SpaceCharge distribution at positive x (3 o'clock in the TPC), or a buildup of ionization only at either low radius (near the IFC) or large radius (near the OFC) at negative x (9 o'clock in the TPC). The former would mean simply an increased rotation of tracks at positive x due to the standard SpaceCharge distribution. The latter would actually be a decrease in the rotation of tracks at negative x, thereby failing to fully counter the effects of SpaceCharge at positive x. There could also be any combination of these three:
The third possibility may be the most intriguing as it may most closely match the backgrounds which have been documented in the past. It should also be stated clearly that reality could be a combination of a distortion and real shifts in the beam position as delivered by the collider. We want to correct for any of the former, and measure/calibrate any of the latter.
_________
As supplementary information, here are the z distributions ("profs" - spread profile) of vertices as a function of zdc in periods I, II, and III, showing that althought the mean position changes somewhat with run period, the distribution is rather stable as a function of zdc.
»
- Printer-friendly version
- Login or register to post comments