EEMC
Archived Endcap web pages for years 1998 -2008 at MIT 'locker' |
New place for Endcap 'unprotected' analysis
2007 run, hardware changes
April 4, 5 pm, no beam:
We would like ETOW tcd phase set from 12->19 and EMSD from 55->65 , Jeff implemented it
Will's new table (to be implemented)
Towers
TCD box dec box hex
1. 19 18 0x12
2. 19 8 0x8
3. 19 86 0x56
4. 19 80 0x50
5. 19 43 0x2B
6. 19 31 0x1f
For EEMC MAPMT -- rather than change all 48 box configs we could
start out by just adding 10 ns to the phase: 55 -> 65.
new Tower config files in /home/online/mini/tcl/ you'll have to change symbolic links

       tower-1-current_beam_config.dat ->
                   03.01.07/tower-1-current_beam_config.dat
 Jim: after 8094053 should have the new tcd phase and box configuration
----
The night shift took a 300k calibration run with the ETOW and ESMD Run 8095061
----
There is a shift log entry as to the run numbers and conditions.
I shifted only the tcd phase and used the new FEE configs installed
yesterday.  This should show fall off by ~10-20% on each side in towers
and flat in MAPMTs.

run       ETOW tcd  ESMD tcd
8095096      19        65        30k   std config, for 1st daq file ETWO head=off
8095097       1        55        30k
8095098       7        60        30k
8095099      13        60        30k
8095100      25        70        30k
8095101      31        75        30k
8095102      19        65       100k   std config
8095103      19        65         0k   std config  died

8095104      19        65        28k   std config

------ April 12----
I've made these changes in 2007Production2,  2006ProductionMinBias &
2007EMC_background

a.  UPC ps --> 3
b.  bht1 thresh --> 16
c.  raised all triggers to production
d. changed all triggers based on zdc to different production ids

-Jeff
2008 run preparation
Timinng curves for ETOW & ESMD
Timing Scan 11/23/2007
Timing Scan 11/23/2007
EEMC timing scan was taken on11/23/2007.
To generate the curves, log into your favorite rcas node and
$ cvs co -D 11/27/2007 StRoot/StEEmcPool/StEEmcTimingMaker
and follow the instructions in the HOWTO
$ cat StRoot/StEEmcPool/StEEmcTimingMaker/HOWTO.l2ped
(tried to post code, but drupal wouldn't accept it...)
Will's notes on crate configuration:
FYI here are some (old) notes on how I set up config files
for EEMC tower timing scans that were taken a few days back (BTW,
these configs are still loaded).
1) Old running settings -- config files are on eemc-sc in directory
/home/online/mini/tcl with symbolic links:
tower-"n"-current_beam_config.dat ->
dir/tower-"n"-current_beam_config.dat
We had (I believe) been using directory 04.04.07 for the run with
ETOW TCD phase of 19; crate fifo (RHIC tic) 0x13. Those crate delay
settings are:
1 -> 0x12; 2 -> 0x8; 3 -> 0x56; 4 -> 0x50; 5 -> 0x2b; 6 -> 0x1f
2) new scan settings ... for time scans using only TCD phase
we usually create special config files with approprieate box delay and
TCD values.
nominal (ns) for (eff RHIC tic
run 7 scan ns)
1 -> 0x12 (18) 0x5a (-17) fifo 0x14 (e.g., 107-90)
2 -> 0x8 ( 8) 0x50 (-27) fifo 0x14 (e.g., 107-80)
3 -> 0x56 (86) 0x42 ( 66) fifo 0x13
4 -> 0x50 (80) 0x3c ( 60) fifo 0x13
5 -> 0x2b (43) 0x17 ( 23) fifo 0x13
6 -> 0x1f (31) 0xb ( 11) fifo 0x13
Here we have shifted crates "earlier" in time: 1&2 by 35 ns and
rest by 20 ns.Starting TCD scan at 5 then should start things
~ 34 (49) ns earlier than nominal with ~ 70 ns for scan to run
(suggested TCD: 5,10,15,25,35,45,55,65,75,70,60,50,40,30,20,10)
| 8327013 | 5 | 136k |
| 8327014 | 15 | 20k |
| 8327015 | 25 | 20k |
| 8327016 | 35 | 20k |
| 8327017 | 45 | 20k |
| 8327018 | 55 | 20k |
| 8327019 | 65 | 20k |
| 8327020 | 75 | 20k |
| 8327021 | 70 | 20k |
| 8327022 | 60 | 20k |
| 8327023 | 50 | 20k |
| 8327024 | 40 | 20k |
| 8327025 | 30 | 20k |
| 8327026 | 20 | 20k |
| 8327027 | 10 | 20k |
Figure 1 --Integral from ped+25 to ped+75, normalized to total number of events, versus TCD phase delay.

Channel-by-channel plots are attached below.
Timing Scan 11/27/2007 (MuDst)
Posted results are from MuDst data of 17 runs with 50K events in each run.
2, Run Summary
Run ETOW & ESMD phase (ns) # of Events (K)
8331091 5 200
1092 15 200
1094 25 200
1097 35 200
1098 45 200
1102 65 200
1103 75 200
1104 70 200
1105 60 200
1106 50 200
1107 40 200
1108 35 200
1109 30 200
1110 25 200
1111 20 200
2001 10 109
3, Crate Timing Curves
Fig. 1 Tower Crate. It agrees with results from L2 Data
Fig. 2 Crate 64-67
Fig. 3 Crate 68-71
Fig. 4 Crate 72_75
Fig. 5 Crate 76-79
Fig. 6 Crate 80_83
Fig. 7 Crate 84-87
Fig. 8 Crate 88-91
Fig. 9 Crate 92-95
Fig. 10 Crate 96-99
Fig. 11 Crate 100-103
Fig. 12 Crate 104-107
Fig. 13 Crate 108-111
4, PDF Files of MAPMT Channel Timing Curve
tower-crate-1.pdf tower-crate-2.pdf tower-crate-3.pdf tower-crate-4.pdf tower-crate-5.pdf tower-crate-6.pdf
mapmt-crate-64.pdf mapmt-crate-65.pdf mapmt-crate-66.pdf mapmt-crate-67.pdf mapmt-crate-68.pdf mapmt-crate-69.pdf
mapmt-crate-70.pdf mapmt-crate-71.pdf mapmt-crate-72.pdf mapmt-crate-73.pdf mapmt-crate-74.pdf mapmt-crate-75.pdf
mapmt-crate-76.pdf mapmt-crate-77.pdf mapmt-crate-78.pdf mapmt-crate-79.pdf mapmt-crate-80.pdf mapmt-crate-81.pdf
mapmt-crate-82.pdf mapmt-crate-83.pdf mapmt-crate-84.pdf mapmt-crate-85.pdf mapmt-crate-86.pdf mapmt-crate-87.pdf
mapmt-crate-88.pdf mapmt-crate-89.pdf mapmt-crate-90.pdf mapmt-crate-91.pdf mapmt-crate-92.pdf mapmt-crate-93.pdf
mapmt-crate-94.pdf mapmt-crate-95.pdf mapmt-crate-96.pdf mapmt-crate-97.pdf mapmt-crate-98.pdf mapmt-crate-99.pdf
mapmt-crate-100.pdf mapmt-crate-101.pdf mapmt-crate-102.pdf mapmt-crate-103.pdf mapmt-crate-104.pdf mapmt-crate-105.pdf
mapmt-crate-106.pdf mapmt-crate-107.pdf mapmt-crate-108.pdf mapmt-crate-109.pdf mapmt-crate-110.pdf mapmt-crate-111.pdf
Timing Scan 11/29/2007
Timing Scan 11/29/2007
posted 11/30/2007 Shiftlog entryrun btow etow
8333113 12 5
115 17 15
116 22 25
117 27 35
118 32 45
120 37 55
121 42 65
123 52 70
124 57 60
125 62 50
126 36 40
127 36 30
128 36 20
129 36 10
Figure 1 -- Tower crates

Email from Will setting tower timing for this year
     Below in the forwarded message you will see a link to the
analysis (thanks Jason) of the more recent (much better statistics)
EEMC tower timing scan. Based on these I set the timing for this year
as follows (from my shift log entry)

                          *************

> 11/30/07
> 19:49
>
> General
> new timing configuration files loaded for EEMC towers
> crate 1 delay 0x12 (no change from last year nominal)
> crate 2 delay 0x8 (no change)
> crate 3 delay 0x57 ( + 1 ns)
> crate 4 delay 0x52 (+ 2 ns)
> crate 5 delay 0x2b (no change)
> crate 6 delay 0x1f (no change)
> change ETOW phase to 21 (saved in all configs)
> above phase represents overall shift of + 2 ns
makeL2TimingFiles.pl
plotEEmcL2Timing.C
TFile  *file  = 0;

TChain *chain = 0;
#include <vector>
#include "/afs/rhic.bnl.gov/star/packages/DEV/StRoot/StEEmcUtil/EEfeeRaw/EEdims.h"
// summary TTree branches created by StEEmcTimingMaker
Int_t mRunNumber;
Float_t mTowerDelay;
Float_t mMapmtDelay;
Int_t mTotalYield;
Int_t mTowerCrateYield[MaxTwCrates];
Int_t mMapmtCrateYield[MaxMapmtCrates];
Int_t mTowerChanYield[MaxTwCrates][MaxTwCrateCh];
Int_t mMapmtChanYield[MaxMapmtCrates][MaxMapmtCrateCh];
Int_t mTowerMin;
Int_t mTowerMax;
Int_t mMapmtMin;
Int_t mMapmtMax;
// vectors to hold TGraphs for tower and mapmt crates
Int_t npoints = 0;
TGraphErrors *towerCrateCurves[MaxTwCrates];
TGraphErrors *mapmtCrateCurves[MaxMapmtCrates];
TGraphErrors *towerChanCurves[MaxTwCrates][MaxTwCrateCh];
TGraphErrors *mapmtChanCurves[MaxMapmtCrates][MaxMapmtCrateCh];
// enables printing of output files (gif) for documentation
// figures will appear in same subdirector as input files,
// specified below.
//Bool_t doprint = true;
Bool_t doprint = false;
void plotEEmcL2Timing( const Char_t *input_dir="timing_files/")
{
// chain files
chainFiles(input_dir);
// setup branches
setBranches(input_dir);
// get total number of points
Long64_t nruns = chain -> GetEntries();
npoints=(Int_t)nruns;
// setup the graphs for each crate and each channel
initGraphs();
// loop over all runs
for ( Long64_t i = 0; i < nruns; i++ )
{
chain->GetEntry(i);
fillCrates((int)i);
fillChannels((int)i);
}
// draw timing scan curves for tower crates
drawCrates();
// for ( Int_t ii=0;ii<MaxTwCrates;ii++ ) towerChannels(ii);
// for ( Int_t ii=0;ii<MaxMapmtCrates;ii++ ) mapmtChannels(ii);
std::cout << "--------------------------------------------------------" << std::endl;
std::cout << "to view timing curves for any crate" << std::endl;
std::cout << std::endl;
std::cout << "towerChannels(icrate) -- icrate = 0-5 for tower crates 1-6"<<std::endl;
// std::cout << "mapmtChannels(icrate) -- icrate = 0-47 for mapmt crates 1-48"<<std::endl;
std::cout << "print() -- make gif/pdf files for all crates and channels"<<std::endl;
}
// ----------------------------------------------------------------------------
void print()
{
doprint=true;
drawCrates();
for ( Int_t ii=0;ii<MaxTwCrates;ii++ ) towerChannels(ii);
//for ( Int_t ii=0;ii<MaxMapmtCrates;ii++ ) drawMapmt(ii);
}
// ----------------------------------------------------------------------------
void drawCrates()
{
// tower crates first
TCanvas *towers=new TCanvas("towers","towers",500,400);
const Char_t *opt[]={"ALP","LP","LP","LP","LP","LP"};
TLegend *legend=new TLegend(0.125,0.6,0.325,0.85);
Float_t ymax=0.;
for ( Int_t icr=0;icr<MaxTwCrates;icr++ )
{
towerCrateCurves[icr]->Sort();
towerCrateCurves[icr]->Draw(opt[icr]);
TString crname="tw crate ";crname+=icr+1;
legend->AddEntry( towerCrateCurves[icr], crname, "lp" );
if ( towerCrateCurves[icr]->GetYaxis()->GetXmax() > ymax )
ymax=towerCrateCurves[icr]->GetYaxis()->GetXmax();
}
towerCrateCurves[0]->SetTitle("EEMC Tower Crate Timing Curves");
towerCrateCurves[0]->GetXaxis()->SetTitle("TCD phase[ns]");
TString ytitle=Form("Integral [ped+%i,ped+%i] / N_{events}",mTowerMin,mTowerMax);
towerCrateCurves[0]->GetYaxis()->SetTitle(ytitle);
towerCrateCurves[0]->GetYaxis()->SetRangeUser(0.,ymax);
legend->Draw();
if(doprint)towers->Print("tower_crates.gif");
}
// ----------------------------------------------------------------------------
void mapmtChannels( Int_t crate )
{
static const Int_t stride=16;
Int_t crateid = MinMapmtCrateID+crate;
TString fname="mapmt-crate-";fname+=crate+MinMapmtCrateID;fname+=".ps";
TCanvas *canvas=new TCanvas("canvas","canvas",850/2,1100/2);
canvas->Divide(1,2);
Int_t icanvas=0;
for ( Int_t ich=0;ich<192;ich+=stride )
{
canvas->cd(1+icanvas%2);
icanvas++;
TString pname="crate";
pname+=crateid;
pname+="_ch";
pname+=ich;
pname+="-";
pname+=ich+stride-1;
const Char_t *opts[]={"ALP","LP","LP","LP","LP","LP","LP","LP","LP","LP","LP","LP","LP","LP","LP","LP","LP","LP","LP","LP","LP"};
// normalize
Float_t ymax=0.0;
Double_t sum[stride];for ( Int_t jj=0;jj<stride;jj++ )sum[jj]=0.;
Double_t max=0.;
for ( Int_t jch=0;jch<stride;jch++ ) // loop over channels in this one graph
{
Int_t index=ich+jch;
Double_t *Y=mapmtChanCurves[crate][index]->GetY();
for ( Int_t ipoint=0;ipoint<npoints;ipoint++ ) {
if ( Y[ipoint]>ymax ) ymax=Y[ipoint];
sum[jch]+=Y[ipoint];
}
if ( sum[jch]>max ) max=sum[jch];
}
if ( max <= 0. ) continue; // meh?
TLegend *legend=new TLegend(0.55,0.11,0.85,0.525);
for ( Int_t jch=0;jch<stride;jch++ )
{
Int_t index=ich+jch;
mapmtChanCurves[crate][index]->SetMarkerSize(0.75);
// offset X axis of each of these
Double_t *X=mapmtChanCurves[crate][index]->GetX();
Double_t *Y=mapmtChanCurves[crate][index]->GetY();
Double_t *EY=mapmtChanCurves[crate][index]->GetEY();
if ( sum[jch]<= 0. ) continue;
// std::cout<<"before"<<std::endl;
for ( Int_t ip=0;ip<npoints;ip++ ){
Float_t shift = 0.5+ ((float)jch) - ((float)stride)/2.0;
Double_t yy=Y[ip];
X[ip]-= 0.1*shift;
Y[ip]*=max/sum[jch];
EY[ip]*=max/sum[jch];
// std::cout << "ip="<<ip<<" y="<<yy<<" y'="<<Y[ip]<<std::endl;
}
mapmtChanCurves[crate][index]->Sort();
if ( !jch )
mapmtChanCurves[crate][index]->GetXaxis()->SetRangeUser(0.,ymax*1.05);
mapmtChanCurves[crate][index]->SetMarkerColor(38+jch);
mapmtChanCurves[crate][index]->SetLineColor(38+jch);
mapmtChanCurves[crate][index]->SetMinimum(0.);
mapmtChanCurves[crate][index]->Draw(opts[jch]);
TString label="crate ";label+=crate+1;label+=" chan ";label+=index;
legend->AddEntry(mapmtChanCurves[crate][index],label,"lp");
}
legend->Draw();
canvas->Update();
// if(doprint)c->Print(pname+".gif");
if ( !(icanvas%2) ){
canvas->Print(fname+"(");
canvas->Clear();
canvas->Divide(1,2);
}
// if(doprint)c->Print(pname+".gif");
}
canvas->Print(fname+")");
gSystem->Exec(TString("ps2pdf ")+fname);
}
// ----------------------------------------------------------------------------
void towerChannels( Int_t crate )
{
static const Int_t stride=12;
TString fname="tower-crate-";fname+=crate+1;fname+=".ps";
TCanvas *canvas=0;
canvas = new TCanvas("canvas","canvas",850/2,1100/2);
canvas->Divide(1,2);
Int_t icanvas=0;
for ( Int_t ich=0;ich<120;ich+=stride )
{
canvas->cd(1+icanvas%2);
icanvas++;
// TString aname="crate";aname+=crate;aname+=" channels ";aname+=ich;aname+=" to ";aname+=ich+stride-1;
// TCanvas *c = new TCanvas(aname,aname,400,300);
TString pname="crate";
pname+=crate+1;
pname+="_ch";
pname+=ich;
pname+="-";
pname+=ich+stride-1;
const Char_t *opts[]={"ALP","LP","LP","LP","LP","LP","LP","LP","LP","LP","LP","LP","LP","LP","LP","LP"};
// normalize
Double_t sum[stride];for ( Int_t jj=0;jj<stride;jj++ )sum[jj]=0.;
Double_t max=0.;
for ( Int_t jch=0;jch<stride;jch++ ) // loop over channels in this one graph
{
Int_t index=ich+jch;
Double_t *Y=towerChanCurves[crate][index]->GetY();
for ( Int_t ipoint=0;ipoint<npoints;ipoint++ ) sum[jch]+=Y[ipoint];
if ( sum[jch]>max ) max=sum[jch];
}
if ( max <= 0. ) continue; // meh?
TLegend *legend=new TLegend(0.125,0.15,0.325,0.45);
for ( Int_t jch=0;jch<stride;jch++ )
{
Int_t index=ich+jch;
towerChanCurves[crate][index]->SetMarkerSize(0.75);
// offset X axis of each of these
Double_t *X=towerChanCurves[crate][index]->GetX();
Double_t *Y=towerChanCurves[crate][index]->GetY();
Double_t *EY=towerChanCurves[crate][index]->GetEY();
if ( sum[jch]<= 0. ) continue;
// std::cout<<"before"<<std::endl;
for ( Int_t ip=0;ip<npoints;ip++ ){
Float_t shift = 0.5+ ((float)jch) - ((float)stride)/2.0;
Double_t yy=Y[ip];
X[ip]-= 0.1*shift;
Y[ip]*=max/sum[jch];
EY[ip]*=max/sum[jch];
// std::cout << "ip="<<ip<<" y="<<yy<<" y'="<<Y[ip]<<std::endl;
}
towerChanCurves[crate][index]->Sort();
towerChanCurves[crate][index]->SetMinimum(0.);
towerChanCurves[crate][index]->SetMarkerColor(38+jch);
towerChanCurves[crate][index]->SetLineColor(38+jch);
towerChanCurves[crate][index]->Draw(opts[jch]);
TString label="crate ";label+=crate+1;label+=" chan ";label+=index;
legend->AddEntry(towerChanCurves[crate][index],label,"lp");
}
legend->Draw();
canvas->Update();
// if(doprint)c->Print(pname+".gif");
if ( !(icanvas%2) ){
if ( doprint ) canvas->Print(fname+"(");
canvas->Clear();
canvas->Divide(1,2);
}
}
if ( doprint ) {
canvas->Print(fname+")");
gSystem->Exec(TString("ps2pdf ")+fname);
}
}
// ----------------------------------------------------------------------------
void fillCrates(Int_t ipoint)
{
#if 1
// loop over tower crates
for ( Int_t icr=0;icr<MaxTwCrates;icr++ )
{
Float_t yield = (Float_t)mTowerCrateYield[icr];
Float_t total = (Float_t)mTotalYield;
if ( total > 10.0 ) {
Float_t eyield = TMath::Sqrt(yield);
Float_t etotal = TMath::Sqrt(total);
Float_t r = yield / total;
Float_t e1 = (yield>0)? eyield/yield : 0.0;
Float_t e2 = etotal/total;
Float_t er = r * TMath::Sqrt( e1*e1 + e2*e2 );
towerCrateCurves[icr]->SetPoint(ipoint, mTowerDelay, r );
towerCrateCurves[icr]->SetPointError( ipoint, 0., er );
}
else {
towerCrateCurves[icr]->SetPoint(ipoint, mTowerDelay, -1.0 );
towerCrateCurves[icr]->SetPointError( ipoint, 0., 0. );
}
}
// loop over mapmt crates
for ( Int_t icr=0;icr<MaxMapmtCrates;icr++ )
{
Float_t yield = (Float_t)mMapmtCrateYield[icr];
Float_t total = (Float_t)mTotalYield;
if ( total > 10.0 ) {
Float_t eyield = TMath::Sqrt(yield);
Float_t etotal = TMath::Sqrt(total);
Float_t r = yield / total;
Float_t e1 = (yield>0)? eyield/yield : 0.0;
Float_t e2 = etotal/total;
Float_t er = r * TMath::Sqrt( e1*e1 + e2*e2 );
mapmtCrateCurves[icr]->SetPoint(ipoint, mMapmtDelay, r );
mapmtCrateCurves[icr]->SetPointError( ipoint, 0., er );
}
else {
mapmtCrateCurves[icr]->SetPoint(ipoint, mMapmtDelay, -1. );
mapmtCrateCurves[icr]->SetPointError( ipoint, 0., 0. );
}
}
#endif
}
// ----------------------------------------------------------------------------
void fillChannels(Int_t ipoint)
{
#if 1
// loop over tower crates
for ( Int_t icr=0;icr<MaxTwCrates;icr++ )
{
for ( Int_t ich=0;ich<MaxTwCrateCh;ich++ )
{
Float_t yield = (Float_t)mTowerChanYield[icr][ich];
Float_t total = (Float_t)mTotalYield;
if ( total > 10.0 ) {
Float_t eyield = TMath::Sqrt(yield);
Float_t etotal = TMath::Sqrt(total);
Float_t r = yield / total;
Float_t e1 = (yield>0)? eyield/yield : 0.0;
Float_t e2 = etotal/total;
Float_t er = r * TMath::Sqrt( e1*e1 + e2*e2 );
towerChanCurves[icr][ich]->SetPoint(ipoint, mTowerDelay, r );
towerChanCurves[icr][ich]->SetPointError( ipoint, 0., er );
}
else {
towerChanCurves[icr][ich]->SetPoint(ipoint, mTowerDelay, -1.0 );
towerChanCurves[icr][ich]->SetPointError( ipoint, 0., 0. );
}
}
}
#endif
#if 1
// loop over mapmt crates
for ( Int_t icr=0;icr<MaxMapmtCrates;icr++ )
{
for ( Int_t ich=0;ich<MaxMapmtCrateCh;ich++ )
{
Float_t yield = (Float_t)mMapmtChanYield[icr][ich];
Float_t total = (Float_t)mTotalYield;
if ( total > 10.0 ) {
Float_t eyield = TMath::Sqrt(yield);
Float_t etotal = TMath::Sqrt(total);
Float_t r = yield / total;
Float_t e1 = (yield>0)? eyield/yield : 0.0;
Float_t e2 = etotal/total;
Float_t er = r * TMath::Sqrt( e1*e1 + e2*e2 );
mapmtChanCurves[icr][ich]->SetPoint(ipoint, mMapmtDelay, r );
mapmtChanCurves[icr][ich]->SetPointError( ipoint, 0., er );
}
else {
mapmtChanCurves[icr][ich]->SetPoint(ipoint, mMapmtDelay, -1.0 );
mapmtChanCurves[icr][ich]->SetPointError( ipoint, 0., 0. );
}
}
}
#endif
}
// ----------------------------------------------------------------------------
void initGraphs()
{
for ( Int_t i=0;i<MaxTwCrates;i++ ){
towerCrateCurves[i] = new TGraphErrors(npoints);
towerCrateCurves[i]->SetMarkerStyle(20+i);
towerCrateCurves[i]->SetMarkerColor(i+1);
towerCrateCurves[i]->SetLineColor(i+1);
for ( Int_t j=0;j<MaxTwCrateCh;j++ )
towerChanCurves[i][j]=(TGraphErrors*)towerCrateCurves[i]->Clone();
}
for ( Int_t i=0;i<MaxMapmtCrates;i++ ){
mapmtCrateCurves[i]= new TGraphErrors(npoints);
mapmtCrateCurves[i]->SetMarkerStyle(20+i%4);
mapmtCrateCurves[i]->SetMarkerColor(1+i%4);
mapmtCrateCurves[i]->SetLineColor(1+i%4);
for ( Int_t j=0;j<MaxMapmtCrateCh;j++ )
mapmtChanCurves[i][j]=(TGraphErrors*)mapmtCrateCurves[i]->Clone();
}
}
// ----------------------------------------------------------------------------
void chainFiles(const Char_t *path)
{
chain=new TChain("timing","Timing summary");
TFile *tfile = 0;
std::cout << "chaining files in " << path << std::endl;
TSystemDirectory *dir = new TSystemDirectory("dir",path);
TIter next( dir->GetListOfFiles() );
TObject *file = 0;
while ( file = (TObject*)next() )
{
TString name=file->GetName();
// sum the event counter histogram
if ( name.Contains(".root") ) {
// open the TFile and
std::cout << " + " << name << std::endl;
// tfile = TFile::Open(name);
chain->Add(name);
}
}
}
// ----------------------------------------------------------------------------
void setBranches(const Char_t *dir)
{
chain->SetBranchAddress("mRunNumber", &mRunNumber );
chain->SetBranchAddress("mTowerDelay", &mTowerDelay );
chain->SetBranchAddress("mMapmtDelay", &mMapmtDelay );
chain->SetBranchAddress("mTotalYield", &mTotalYield );
chain->SetBranchAddress("mTowerCrateYield", &mTowerCrateYield );
chain->SetBranchAddress("mMapmtCrateYield", &mMapmtCrateYield );
chain->SetBranchAddress("mTowerChanYield", &mTowerChanYield );
chain->SetBranchAddress("mMapmtChanYield", &mMapmtChanYield );
chain->SetBranchAddress("mTowerMin",&mTowerMin);
chain->SetBranchAddress("mTowerMax",&mTowerMax);
chain->SetBranchAddress("mMapmtMin",&mMapmtMin);
chain->SetBranchAddress("mMapmtMax",&mMapmtMax);
}
runEEmcL2Timing.C
Calibrations
New EEMC Calibrations Page
2007 EEMC Tower Gains
Run 7 EEMC Tower Gains - Using Slopes
Goals: Use "inclusive slopes" from fast-detector only, min-bias runs to determine relative (eta-dependent) gains for all EEMC towers for the 2007 run. More specifically, analyze ~30k events from run 8095104 (thanks to Jan [production] and Jason [fitting] !), fit slopes to all ungated tower spectra, in order to:
- check if new / replaced PMT's (only 2 for this year) need significant HV adjustment
- make sure tubes with new / replaced bases are working properly
- search for towers with unusual spectra, anomalous count rates, or slopes that are far from the norm for that eta bin
- compare individual slopes to 2006 absolute gains (from mips) for each eta bin, to test robustness and stability of gain determinations
- for tower gains far from ideal (as determined with slopes and/or mips) consider adjusting HV
- look for anything else that seems out of whack!
Definitions:
For the gain calibration of towers, we will use
- x = channel number = ADC - ped
- E = full e.m. energy (GeV) = (deposited energy / sampling fraction) for e.m. particles
- G = absolute gain (channels / GeV) including sampling fraction
So: E = x / G
For slopes, raw spectra (y vs. x) are fit to: y = A e-bx
Thus, one expects that for a given eta bin: G ~ 1 / b
Results:
1. Two new tubes are fine! Slopes of recently replaced PMT's 04TB12 and 12TE06 are very close to those of neighboring towers at same eta, or those of same subsector in the neighboring sector:
| towerID | integral | slope | error |
| 03TB12 | 2003 | -0.04144 | 0.00181 |
| 04TA12 | 2081 | -0.04527 | 0.00177 |
| 04TB12 | 2022 | -0.04400 | 0.00173 |
| 04TC12 | 2195 | -0.03825 | 0.00170 |
| 05TB12 | 2056 | -0.04465 | 0.00177 |
| towerID | integral | slope | error |
| 11TE06 | 2595 | -0.04157 | 0.00162 |
| 12TD06 | 1965 | -0.05977 | 0.00185 |
| 12TE06 | 2535 | -0.04516 | 0.00165 |
| 01TA06 | 2124 | -0.05230 | 0.00179 |
| 01TE06 | 2070 | -0.05342 | 0.00190 |
More global comparisons to all the tower slopes in the same eta bin are given below. For both tubes, the gain is 5-10% lower than average, but well within useful range.
2. Change of base (same PMT) has little effect on tower gains. This has been confirmed for the six bases that were changed (03TA09, 06TB04, 10TE01, 12TA01, 12TC11, 12TE06), using the same comparisons to neighboring towers used in step 1 above.
3. For all 720 towers, comparison of 2007 slopes to 2006 mip-based absolute gains indicates about 6 problem towers (most "well known")
- 06TA03 - no useful mip results, fitted slope was positive! Spectra never make much sense.
- 08TC05 - didn't work last year, still not working! Spectra shows only a pedestal.
- 07TC05 - no gain determined in 2005 or 2006. Has largest slope of all towers, probably useless.
- 06TD11 - each year, everything gets replaced; each year it continues to be 'flakey,' sometimes working, sometimes not.
- 12TD01 - seemed okay last year, now has a very small slope. Maybe PMT is dying fast?
- 10TA11 - worked fine last year, recently died. HV off, only a pedestal.
In addition, 09TE01 seems to be working now, though it failed the mip gain analysis last year, and hasn't been 'fixed.'
All of these cases are easily seen in the following correlation plot:

4. See clear correlations, within each eta bin, between new (2007) slope analysis, last year's mip analysis -> gains are stable, methods are robust! On vertical scale, solid magenta line = ideal gain for that bin, dashed = +/- 15%
eta bin | correlation plot | comments |
| 1 | .gif | one high gain tube (10TA01), reasonable correlation, no obvious problems |
| 2 | .gif | looks okay, all within +/- 20% of ideal gains |
| 3 | .gif | pretty ratty - several towers ~15% off 'correlation' curve |
| 4 | .gif | one very low gain tube (01TA04), one with very small slope (02TD04), otherwise all okay |
| 5 | .gif | a couple of high-gain towers, correlation is very good |
| 6 | .gif | one low gain, a few high-gain, but good correlation. New PMT 12TE06 looks reasonable |
| 7 | .gif | overall gains a bit high compare to ideal, no real problems |
| 8 | .gif | no problems |
| 9 | .gif | no problems |
| 10 | .gif | strong correlations, tight clustering in both gain sets |
| 11 | .gif | odd shape, but okay. Only problem (lower left corner) is 06TD11 |
| 12 | .gif | everything a bit noisier, gains ~7% high overall. New PMT 04TB12 fits right in! |
5. Number of 'gain outliers' is quite small, deviation of average from ideal always < 10%. Because the endcap towers are not used for trigger decisions, no obvious advantage in making HV adjustments to large number of towers.
Conclusion: Endcap towers are in good shape! A very small number (~6 / 720) are not working well, but for these few, HV adjustment would not solve the problem. No strong argument for changing HV on any particular tube at this point.
N.B. For each eta bin, one can calculate the ratio R = G / (1/b) as a 'conversion' of slope data to absolute gains. Using the 2006 mip calibration and the 2007 slopes, one gets a fairly smooth curve, though something seems to be happening around eta bin 8.

Calculating EEMC pedestal and status tables
The instructions below are based entirely on code which exists in CVS and not any private directories.
% cvs co StRoot/StEEmcPool/StEEmcDAQ2Ped

% cvs co StRoot/StEEmcPool/StEEmcPedFit

% cvs co StRoot/StEEmcPool/StEEmcStatus
% cons
% cp StRoot/StEEmcPool/StEEmcDAQ2Ped/macros/plDAQ2Ped.C ./

% cp StRoot/StEEmcPool/StEEmcPedFit/macros/fitAdc4Ped.C ./

% cp StRoot/StEEmcPool/StEEmcPedFit/macros/procDAQ2Ped.sh ./

% cp StRoot/StEEmcPool/StEEmcStatus/macros/pedStat.C ./

% cp StRoot/StEEmcPool/StEEmcStatus/macros/procPedStat.sh ./
% ./procDAQ2Ped.sh
% ./procPedStat.sh
% cd StatFiles/

% ./procErrs.sh
Calculating EEMC tower ideal gains and expected MIP response
This is a quick summary of how one goes from a measured MIP peak to a final tower gain.
In the attached spreadsheet, I use the EEMC tower boundaries in eta (lower table) to determine the average eta per bin and the ideal gain in each bin, assuming our goal ("ideal") is to have an e.m. shower of transverse energy ET = 60 GeV saturate the 12-bit ADC, that is, land in channel 4096. This calculation is independent of assumed sampling fraction. The result appears in column H in the lower table, and is highlighted in yellow.
For a calibration based on MIP's, we also need to know the actual energy deposited by the MIP as it traverses all of the scintillator layers, so we need to know the total thickness of scintillator (for normal incidence) and the dE/dx of a MIP. These values appear in cells L5 and M5, respectively. All calculations are keyed to these cells, so changing these cells will propagate to all other columns.
Finally, to connect ideal gains with MIP energy depositions (so we can arrive at the quantity of direct interest for a MIP-based calculation: in which ADC channel (above pedestal) should the MIP peak appear?), we also need to know the calorimeter sampling fraction. I have used 5%, which is in cell G5. Again, changing this one cell value will fill the rest of the tables accordingly.
With these assumed values (60 GeV, 4096 channels, 99 mm, 0.20 MeV/mm, 5% - all in row 5) one can now determine the ADC channel (above pedestal) in which the MIP peak will appear, if the gain is "ideal". These are given in column N of the upper table and highlighted. For each tower, the ratio of the actual (measured / fit) MIP peak channel to this ideal channel is the factor by which the ideal gain needs to be multiplied to arrive at the "true gain" per tower, which is what is loaded into the database.
N.B. I just cut and pasted these two tables together, so there is some overlap between them. Several columns relate to estimating number of photo-electrons (pe) and high voltage (HV) and can be ignored.
EEMC Calibration Docs
This page is meant for centralizing all EEMC calibration documents.
Calibrations through 2007(MIT locker): web.mit.edu/rhic-spin/public/eemc-bnl/calibration/
Alice B.'s calibration code blog: https://drupal.star.bnl.gov/STAR/blog/aliceb/2010/oct/08/updated-eemc-calibration-code
Ting Lin's updated MIP calibration instructions: eemc_code_instruction_by_Ting_2.pdf
EEMC Tower Swaps
During the EEMC MIP calibration, we find that some of the EEMC cables are swaped.
Swaps in database:(This has been implemented during the production, you do not need to worried about these.)
1. mapping=S1 rot, P1 as in sect=5, swap TA4-5, QA11-B2, JB;
2. mapping=swap V209:216, V216-280, V265:272, Bob
3. mapping=swap 10TD04 with 10TD06, Ting and Mike(Not valid before 2015-08-13)
Swap towers found From MIP calibration:
2009 pp200:
10TD06 <=> 10TD04
11TE10 <=> 11TE12
2012 & 2013:
10TD04 <=> 10TD06
11TC05 <=> 11TC07
11TB04 <=> 11TB06
04TB01 <=> 04TB12
04TB02 <=> 04TB11
04TB03 <=> 04TB10
04TB04 <=> 04TB09
04TB05 <=> 04TB08
04TB06 <=> 04TB07
Suggestion:
You can remap the towers in your own analysis.
For example, in Jet analysis, add a small piece of code before you record the tower Id in StRoot/StJetMaker/mudst/StjEEMCMuDst.cxx at line 84.
/////////////////////////////////////////// Sample Code ////////////////////////////////////////////////////////
Overview for generating EEMC pedestals and status tables
This is an informal overview of the 'philosophy' used to generate pedestals and status tables for the STAR endcap EMC, and in particular the ESMD.
For the EEMC offline database, the default protocol is to store one set of pedestals and status tables per fill for the ppruns. In general, this information is updated less frequently for heavy-ion running, depending on user demand. For the endcap, other database information, such as detector mapping and gains, will apply for much longer timescales (like years, or at least a whole run), and so there may be a single database entry for an entire running period.
Focusing on the smd strips, our guiding assumptions are prettysimplistic: First, strips that have constant problems (i.e., thosethatstay bad after their crate is reconfigured or power-cycled, forexample)are easy to catch, and will be flagged as bad no matter what data areused for QA. These aren't the concern. The messier case is whenchannels suddenly go bad, but can be recovered later (by power-cycling,etc.). We assume that these sorts of problems, which tend to affectanentire FEE card and not individual channels, can occur at any timewhilerunning, but especially at the very start of a fill during tuning andcollimation of the beams. These problems don't often fix themselves,and so will remain until action is taken - which usually occurs onlybetween fills.
For the smd strip pedestals and status tables, we analyze one min-biasrun per fill, preferably one taken near the end of the fill. Guidedbythe above ideas, we assume that by this time we have 'accumulated' allthe problems that will arise during the fill, and we will mark them asbad for the entire fill. This means that any strip that died ordeveloped some problem _during_ the fill is marked as bad even for theruns early in the fill when it was still working. So it is aconservative approach: If a strip was malfunctioning near the end ofthe fill, we assume it was bad for the entire fill. It is clear that if suchproblems are only cured in-between fills, this all makes sense. If aproblem is truly intermittent, however, and comes and goes from run to run, then in this approach we might catch it, or we could easily miss it.
Updating the status information in the database on shorter timescales, or basingeach entry onmore than one run per fill (e.g., take an OR of problems found at thestart and at the end of each fill), is certainly possible - it justrequires more time and effort. At this point, we don't plan to change our protocol unless new and unexpected time dependences are observed for problems that don't fit into our model of channels breaking and being 'fixed.' I don't think our current assumptionsaretotally screwy. Just from watching the P-plots, one can see that theendcap smd spectra start to get 'ratty' after a few fills, as more and moregroups of four strips (which are consecutive in DAQ and P-plots, but not in the physicaldetector) start to drift around in their pedestal, or go south in someothermanner. After a thorough re-cycling, most of these problems can befixed, so things look pretty good again at the start of the next fill.
Nevertheless, at the end of the day, the most relevant question for the endcap status tables is "are we doing well enough?" and the best feedback comes from doing real analysis. So the more that people stare at spectra and find new problems,especially those with unexpected time dependences, the better we candesign our QA algorithms and protocol to identify and keep track ofthem. No matter what sorts of problems we have found in the past ormight have anticipated, nature always finds new ones, and werely on users to point these out.
Producing ADC distributions for the EMCs from raw DAQ files
For calibrations of the EMCs (eg. pedestals, status, relative gains) it is often useful to look at raw ADC distributions from a sample of minimum bias events. This can be done simply by analyzing the MuDsts once production has occured, but if one wants to proceed with calibrations before production occurs it often faster to use the raw DAQ files to produce these simple ADC distributions summed over many events. The instructions below describe an adaptation of the general daq reader (provided by Tonko et. al.) used specifically to produce these distributions.
int trigID[2]={A,B};
1 2 4 8 16 32 64 128 256 512 1024 2048...
1 2 4 8 10 20 40 80  100 200 400  800...
So for example, for the emc-check runs in Run 13,

the line should be trigID[2]={1024,0};
1) Check out the macro from cvs:
% cvs co StRoot/StEEmcPool/macros/DaqReader
2) Copy the relevant macros and scripts to your working directory:
% cp StRoot/StEEmcPool/macros/DaqReader/compile.sh ./

% cp StRoot/StEEmcPool/macros/DaqReader/emchist.C  ./

% cp StRoot/StEEmcPool/macros/DaqReader/submitAll.sh  ./

% cp StRoot/StEEmcPool/macros/DaqReader/addFiles.sh  ./
3) Compile the macro by using the compile.sh script:
% ./compile.sh emchist.C
./emchist /star/data03/daq/2012/100/13100049w_js/st_W_13100049_raw_1340001.daq
Run 10 EEMC Calibrations
Run 11 EEMC Calibrations
This is the main page for all EEMC calibration information for Run 11
EEMC HV adjustments for "outliers"
EEMC HV adjustments for "outliers"
Using the sums method (similar to Run 9 analysis) Scott Identified some outliers who's gains were either too high or too low compared to other towers in the same eta ring. The list of towers is below in two different groups 1) known bad channels and 2) channels to adjust HV.
1) Known bad channels:
06TA03, 02TC06, 07TC05 -> all reported to still be bad and masked at L0
04TB05 -> spectra shows this channel is dead at startup
2) Channels to adjust HV
gain too high: 11TB08, 03TA06, 08TC03, 07TC07, 02TE02, 01TA04
gain too low: 12TD01, 10TA09
Procedure:
Minbias runs (12030069-73) were used to determine the slope of each channel using "Scott's method". Below is a summary of the channels slope and the median slope for towers in that eta bin as well as the current HV (HVset_ix) for each tower, all of which is used to calculate the new HV (HVset_xi) to be used to match the other towers in that eta bin.
Table 1:
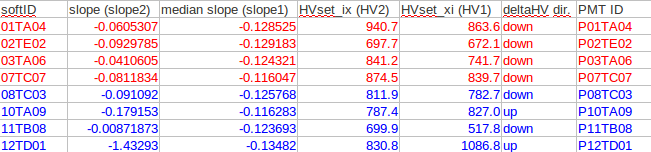
The equation used to determine the new HV values is HV_1 = HV_2 * (slope_2 / slope_1) ^ (1/kappa), where the value of kappa is taken to be 8.8 from previous HV adjustments. This is equation is different than the similar equation used by the barrel becuase in the endcap gain ~ 1/slope and in the barrel gain ~ slope.
Notes:
1) 11TB08 appears to be unstable (HV status is 5 or 7 instead of 4="good") running at 517 V, so it was decided to set this tower to its original value of 699.9 V where it runs stably. Thus, this tower will continue to be masked out of L0 and L2 trigger and will need to be calibrated carefully to be used in offline analysis.
2) 12TD01 is a bit of a special case as it was "hot" in Run 8 and had its voltage lowered (946.2 -> 830.8) before Run 9, but then the gain was way too low. So it was decided to put its voltage at 880.0 to try and increase the gain without getting hot.
Runs taken to test new HV
Once new HV values were determined 2 emc-check runs were taken to check the new files. 12037043 was taken with HVset_ix and 12037046 was taken with HVset_xi. Below is a summary of the slopes for the 2 runs for the channels of interest. Unfortunately. some channels didn't get a new HV loaded because of communications problems with HVsys branch "C" (these are shown in blue).
Table 2:
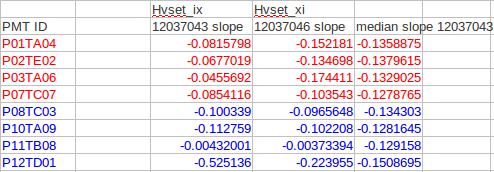
For the towers where the new HV was loaded correctly (red) the slopes now match much better to the median slope in it's etabin, so the new HV values look reasonable and will be used for the remainder of Run 11. HVset_xi is used for all runs after R12038072.
Note: 10TA09 appeared to be hot after its HV was raised to 827.0 so it was set back to its HVset_ix voltage value. There was probably beam background when the original slopes were measured causing this to incorrectly be labeled an outlier.
5P1 adjustments
During the same test runs (12037043 and 12037046) a test was done increasing tube #2 of 5P1 from 750 -> 840 V, as the spectra for channels 176-191 was way down in some early runs (eg. 12034091). This increased the gain by ~2.6, but comparisons of the slopes for channels from tube #2 to other preshower channels in 5P1 showed that the gain should be increased by another factor of ~2 (see txt file with slopes for tubes of interest and median slope of other channels in run 12037046).
So the final HV used for 5P1 will be 913 V, which was determined with a similar formula as for the towers, but with kappa_mapmpt=8.3.
Run 12 EEMC Calibrations
pp500 EEMC Gain Calibration with MIPs
Note four sets of tower gains were uploaded to the database to account for gain decrease over the course of the run.
See attachments for calibration summary and masks lists.
Plots can be found here:
http://www.star.bnl.gov/protected/spin/jhkwas/calibrations/run12plots/
Run 13 EEMC Calibrations
EEMC Gain Calibration with MIPs
Note four sets of tower gains were uploaded to the database to account for gain decrease over the course of the run.
See attachments for calibration summary and masks lists.
Plots can be found here:
http://www.star.bnl.gov/protected/spin/jhkwas/calibrations/run13plots/
EEMC Status and Pedestal Tables
General Procedure:
1) Produce ADC distributions from raw daq files as outlined here.
2) Make ADC distributions for each EEMC channel and fit the histograms to get pedestal and rms values as shown here.
3) Use StEEmcStatus to get status table information. See the last two steps here.
Typical ADC Distribution of one EEMC channel:

Status codes appearing in Run 13:
ONLPED 0x0001 // only pedestal visible
STKBT 0x0002 // sticky lower bits
HIGPED 0x0010 // high chan, seems to work
WIDPED 0x0080 // wide ped sigma
"failed" status: fit fails, all entries in 1 channel, too many ADC = 0 bins, dead channel, stuck in another mode, HV was off, signal fiber broken, etc.
Lower bit(s) failed ("sticky bits"):
Entire run 13:
- a04TB07, a06TA07, a08TB07
Most of run 13:
- a05TA12
One to several runs:
- a01TD12, a04TD05, a05TA10, a06TB11, a06TE10, a08TE08, a09TA09, a11TA07
High pedestal: a05TB01 for 6 runs
Wide ADC distribution:

- a03TB09
- a12TC09, a03TB01, a03TB02, a03TB10, a06TD04, a09TD09, a11TA12, a12TD09, a02TD04, a02TD05, a03TB11, a03TD09
Status tables inserted where large time-gaps occur between emc-check runs:
Fill 17237 --> use table from fill 17250
Fill 17263 --> use table from fill 17268
Fill 17311 --> use table from fill 17312
Fill 17328 --> use table from fill 17329
Fill 17399 --> use table from fill 17402
Fill 17426 --> use table from fill 17427
Status tables inserted mid-fill due to major problems and fixes:
Fill 17333, Run 14096099 --> use table from fill 17335
Fill 17484, Run 14130003 --> use table from fill 17486
Fill 17573, Run 14152029 --> use table from fill 17579
Fill 17586, Run 14152029 --> use table from fill 17587
See this for MAPMT status info.
See this for MAPMT "diagnostic" details.
Run 15 EEMC Calibrations
Status and Pedestal Tables
We used one good emc-check run with 100k events each for each fill. Some fills did not have a good emc-check run. Below are the runs we used.
Run List
Produced ADC distributions from raw DAQ files following the instrucitons here.
Determined the status and pedestals for each tower and mapmt channel with the instructions here.
Summary of tower issues:
On average, about 2.5% of all towers are masked-out per fill.
Tower Status by Fill
02TA01: dead entire run
02TC04: bad entire run
02TC06: fail for part of the run
04TB07: stuck bit entire run
04TC01: fail for part of the run
05TA12: stuck bit entire run
06TA03: failed entire run
06TA07: stuck bit entire run
06TC08: dead for one run
06TD04: failed for one run
07TC05: failed entire run
08TB07: stuck bit entire run
10TA09: dead for two runs
10TC02: failed entire run
10TC03: failed entire run
10TC09: failed entire run
10TC11: good for only two runs
11TA08: dead entire run
11TA12: mark as stuck bit entire run
11TB08: failed entire run
11TC04: dead for part of the run
12TB02: dead part of the run
12TC05: bad entire run
12TD01: bad for part of the run
**See attached file for MAPMT pedestal widths**
Run 17 EEMC Calibrations
Status and Pedestal Tables
RunList Selection:Use one good emc-check run with at least 50k events for each fill from pp510. Some fills did not have good emc-check run.
For pp510, total emc_check run list has 227 runs, some problematic (?) runs:
18065063, only has 1 event;
18066002, second emc_check run in same fill, Shift Leader comment: 18065001 rate too high?
18113047, emc_check run pp energy < 500GeV
18115051, emc_check run pp energy, Blue 253.798GeV, Yellow 253.797GeV, smaller than normal value 254.867GeV.
Summary of tower:
tower status by fill
a01TA05: masked out on April 26th by Will
a01TC05: failed for part of the run
a02TA01: dead entire run
a02TC04: bad entire run
a02TC06: failed for part of the run
a11TB07: failed for part of the run
a12TC05: bad entire run
Summary of MAPMT:
MAPMT status by fill
MAPMT Pedestal Width
Run 8 EEMC calibrations
This is the main page for all EEMC calibration information for Run 8
Comparison of old (Run 7) to new (Run 8) EEMC tower HV's
At the end of run 7, we compared slopes for all EEMC towers with two sets of HV values in a series of consecutive runs. The goal was to see if the new HV set would change the slopes in the 'expected' way, to bring the tower hardware gains into closer agreement with their ideal values.
Here is a summary of what we planned to do:
www.star.bnl.gov/HyperNews-star/get/starops/2520/1.html
What was actually done was send in a private email to a few people. The email is attached below, along with two plots. "2006TowerGains" shows the absolute gain determined for each tower, compared to its ideal value. "2006Gains_x_SlopeRatio" is the same data, but each point has simply been scaled by the ratio of the slopes determined for the two data sets (old HV vs new HV). Note that the correction is not just a calculation, but based only the slope measured for each tower before and after the new HV set was loaded.
EEMC Pedestals and Status Tables for Run 8
Generating Pedestal and Status Table Information
Requesting Emc Check Runs
In order to produce pedestal and status table information for the EEMC, Min Bias runs must be analyzed to determine the pedestal and status for each channel (tower, preshower, or SMD strip). Thus during the running, usually once per fill an EmcCheck run is produced with approximately 200,000 of these Min Bias events. This run must include EEMC and ESMD, and it is preferable for this run to be the first run in the fill, but not absolutely necessary. A list of these runs we wish to have produced via Fast-Offline is sent to Lidia Didenko through the starprod hypernews list. These runs are usually produced to /star/data09/reco/EmcCheck/ReversedFullField/dev/ or sometimes data10. For each run there might be 20 MuDst files, that will be deleted in a week or so, so they must be processed to hist.root files quickly. A list of the runs that were requested and produced for 2008 is given here: www.star.bnl.gov/protected/spin/stevens4/ped2008/runList.html
Creating hist.root files and fit.hist.root files
In order to analyze these runs, the raw MuDst needs to be transfered hist.root fromat. This is done with the macro rdMu2Ped.C which is executed by procPeds (all of the following code can be found in my directory at /star/u/stevens4/ped08 at rcf). procPeds requires an input file Rnum.lis which has a list of the locations of all the files for a given run, this can be created via the executible filefind (Rnum is a string of Rydddnnn where y is the year, xxx is the day of the run, and nnn is the number of the run on that day). Once rdMu2Ped.C has written the .hist.root file for the given run, procPeds then executes fitAdc4Ped.C which fits each channels histogram using the code in pedFitCode/. The macro fitAdc4Ped.C also creates ped.sectorXX files which contain the pedestal information for each sector which will be loaded to the database, as well as other log files. Finally procPeds moves all these files to a directory for that particular run.
Status Tables
The code used to create these status and fail words for each channel are in the directory /star/u/stevens4/ped08/pedStatus. The source code for the program is in oflPedStat.cxx, and it is executed using oflPed. It requires and input file, runList, which contains the list of runs to be analyzed, and it requires the hist.root and fit.hist.root files to be stored in /star/u/stevens4/ped08/dayxxx/outPedRyxxxnnn. This code outputs two files, Ryxxxnnn.errs, which contains the status and fail words in hex format for each problematic channel, and Ryxxxnnn.log, which gives explanation (ie which test it failed) for why each channel was problematic. Both of these output files are written in /star/u/stevens4/ped08/pedStatus/StatFiles/. Once these files are written the script procErrs can be executed in the same directory. procErrs reads in the .errs files and writes (with DistrStat2Sectors.C) the stat-XX files containing the status and fail words that will be uploaded to the database, as well as copy each stat-XX and ped.sectorXX to the run number directory in /StatFiles/.
The current set of status bits for EEMC (usage: #define EEMCSTAT_* )
ONLPED 0x0001 // only pedestal visible
STKBT 0x0002 // sticky lower bits
HOTHT 0x0004 // masked for HT trigger
HOTJP 0x0008 // masked for JP trigger
HIGPED 0x0010 // high chan, seems to work
HOTSTR 0x0020 // hot esmd strip
JUMPED 0x0040 // jumpy ped over few chan
WIDPED 0x0080 // wide ped sigma
More information about the database usage is given by Jan at: http://drupal.star.bnl.gov/STAR/subsys/eemc/endcap-calorimeter/db-usage
Uploading Tables to Database
General information for uploading tables to the database is given by Jan at: drupal.star.bnl.gov/STAR/subsys/eemc/endcap-calorimeter/offline-db-upload-write
More specific information on uploading pedestals and status tables to the database refer to /star/u/stevens4/database/uploadinfo.txt
Run 9 EEMC calibrations
This is the main page for all EEMC calibration information for Run 9
EEMC Gain Calibration Using MIP Run9
Dead channels:
SMD strips:
03V112, 03V258, 05U212, 05U234, 05V057, 06U069, 06U091, 08U124, 09V029, 09V047, 09V113.
03U, 04V, 09U, 10V strips numbered 284-287. All the strips labeled 288.
Pre&Post:
02PA11
Tower:
02TC04, 02TC06, 06TA03, 06TE04, 07TC05, 11TD05
Bad channels:
Pre&Post:
05PA01, 05PA02, 05PA03, 05PB10, 05PB11, 05PB12, 05PC10, 05PC11, 05PC12, 05PD10, 05PD11, 05PD12, 05PE01,
05PE02, 05PE03
11PE10, 11PE12, 11QE10, 11QE12, 11RE10, 11RE12
Tower:
11TE12, 11TE10, 10TD04, 10TD06
Note: Fifteen 05Pre1 channels have PMT problem; Swaps 11TE10<->11TE12; 10TD04<->10TD06
The procedures and results can be found here:
https://drupal.star.bnl.gov/STAR/system/files/EEMC-cal-run6%2526run9forpresentation11172014_1.pdf
All the plots are in this directory:
http://www.star.bnl.gov/protected/spin/tinglin/summber2014/run9final/
Conclusion:
Pre1, Pre2 and tower's gain decreased by 10% compared to run6;
Post shower's gain remain stable.
EEMC Gains - corrected for mis-set TCD phase
EEMC TCD Phase and Effective Gains
During Run 9 the TCD phase was set incorrectly for ETOW (run < 10114054) and ESMD (run < 10140030). A study (shown here) found the slope ratio for the 2 TCD phases which was used to calculate new gain tables for ETOW and ESMD. These "mis-set" TCD phase timing settings are not optimal for the vast majority of channels, thus the data taken during these periods are more suspect to issues such as timing jitter, vertex position dependencies, etc. To account for these issues, we have set gain=-1 for these time periods for the standard "ofl" flavor of the DB. The new gains (calculated with the slope ratios) have been uploaded to the DB for the same timestamps but with a flavor of "missetTCD", so that this data is permanently flagged as having issues that data taken with optimal timing (hopefully) do not.
As a reminder, here are a few lines of code for how to read these "missetTCD" flavor tables from the DB instead of the default "ofl" tables:
stDb = new St_db_Maker("StarDb", "MySQL:StarDb");
stDb->SetFlavor("missetTCD","eemcPMTcal"); //sets flavor for ETOW gains
stDb->SetFlavor("missetTCD","eemcPIXcal"); //sets flavor for ESMD (mampt) gains
Note: the "missetTCD" flavor is valid only for Run 9 during the time periods given above, so it will return gain<0 for any other times.
EEMC Pedestals and Status Tables for Run 9
Run 9 EEMC Pedestals and Status Tables
Abstract: To produce pedestals and status tables for ETOW, ESMD, and EPRS based on zdc_polarimeter (EmcCheck) runs taken at the beginning of each fill with calorimeters only. This year the raw adc spectra were retrieved from the .daq files on HPSS using the DAQ_READER instead of waiting for these runs to be produced.
Runlist: 200 GeV
Procedure:
1) Retrieve .daq files from HPSS and use Matt Walker's version of the DAQ_READER to make 2D spectra of all EEMC components (code located at /star/u/stevens4/daqReader/ ). Output is hist.root file with 6 ETOW histograms and 48 ESMD/EPRS histograms, one for each crate.
2) Using mapping from DB create 1D histograms for each EEMC channel softID from the 2D histograms generated by the DAQ_READER (macro: /star/u/stevens4/ped09/fromDAQ/plDAQ2Ped.C). Ouput is hist.root file with 720 ETOW and 9072 ESMD/EPRS histograms.
3) Fit 1D histograms produced by plDAQ2Ped.C to get pedestal value for each channel (macro: /star/u/stevens4/ped09/offline/fitAdc4Ped.C) . Output is fit.hist.root file with fitted 1D histograms for every channel and a ped.sectorXX with pedestal values for each channel in that sector which can be uploaded to the DB.
4) Compute status for each channel and generate status table for each sector (macro: /star/u/stevens4/ped09/offline/pedStat.C).
The current set of status bits for EEMC (usage: #define EEMCSTAT_* )
ONLPED 0x0001 // only pedestal visible
STKBT 0x0002 // sticky lower bits
HOTHT 0x0004 // masked for HT trigger
HOTJP 0x0008 // masked for JP trigger
HIGPED 0x0010 // high chan, seems to work
HOTSTR 0x0020 // hot esmd strip
JUMPED 0x0040 // jumpy ped over few chan
WIDPED 0x0080 // wide ped sigma
Known problems put in status tables "by hand":
| Problem | Fills effected (based on zdc run at beginning of fill) |
| Crate 6 problem configuring | 10157048-10169028 (not all of crate 6 for all fills) |
| SMD Sectors 12 and 1 bad spectra | 10139100, 10142078-10146010 |
Note: We also had problems with counts below pedestal in the ESMD/EPRS due to "extra accepts" in the triggering. These problems are not included in the status tables because it is thought that these problems won't show up in the produced data, but we will have to wait and see.
ESMD (MAPMT FEE) Timing for Run 9
The timing scans for ESMD/MAPMT FEE for Run 9 were taken by
raising the box delay settings as far as feasible, staying
within the present RHIC tic "c" delay setting and then varying
the TCD phase delay in order to see as much as possible of the
right-hand-side timing cutoff in the scans (Note: due to present
nature of the various delays there is a timing "hole" which
cannot be accessed ... we will try to fix in future years e.g.,
by extending the delay range of the new TCD).
The new MAPMT configuration files for the scans were put on the
EEMC slow controls machine (eemc-sc) in directory:
/home/online/mapmtConfig/03-01-09_scan. The initial conditions
are outlined in cols 1-7 of the spreadsheet "MAPMT_DELAYS_v7"
(among the last attachments below). The nominal TDC phase setting
from previous years is = 65. Within allowable additions to
the box delay, we chose to divide things into 4 classes:
a) add 22 ns box delay as per cols 8-12 of spreadsheet:
(should clearly see edge as in previous years):
12S1-12P1, 2S3, 4S1-4S3, 7S1-7P1, 8S2-10P1
b) add 17 ns box delay as per cols 15-19 of spreadsheet:
(will see less but better than previous):
1S1, 1S3, 2S1, 4P1, 8S1, 11S1, 11S3
c) add 7 ns box delay as per cols 22-26 of spreadsheet:
(will see even less, etc.):
1P1, 2S2, 2P1-3S3, 5S1, 5S3, 6S1, 8S2, 6P1, 11S2, 11P1
d) delay w/ truncation @ 400 HEX as per cols 22-26 of
spreadsheet
(mistake: see notes below ... max is really 3FF)
1S2 (439), 3P1 (44E), 5P1 (40C), 6s3 (423)
Data for the scans was taken on Friday 6 March 2009:
Run ETOW TCD ESMD TCD
Phase Phase
10065031 80 80
10065032 10 10
10065033 20 20
10065034 30 30
10065035 40 40
10065036 50 50
10065037 60 60
10065038 70 70
10065039 75 75
10065040 65 65
10065041 55 55
10065042 45 45
10065043 35 35
10065044 25 25
10065045 15 15
10065046 5 5
10065047 0 0
(in last entry at "0" peds seem to indicate this didn't work
for ETOW ... too many counts in spectra)
These data were analyzed by Alice Bridgeman at link:
http://drupal.star.bnl.gov/STAR/blog-entry/aliceb/2009/mar/11/preliminary-eemc-timing-curves-crate
Attached below are the same plots from her analysis, but
annotated to show the run 8 effective timing setting (long
vertical line at 43, 48, 58 depending on box ("crate"), for
added delays of 22, 17 and 7, respectively) as well as
indication of the location of the "right edge" of the timing
scan and length of flat top region. (The files for the good
timing scans are appended first and in order below for crates
64 [e.g., mapmt-crate-64_set.pdf], 66-68, 70-78, 80-84, 86,
88-89, 91-94, and 96-111.) The associated values from this
somewhat subjective procedure (regions selected by eye and
computer drawing "straight edge"), are given in cols 29-33
(again on spreadsheet "MAPMT_DELAYS_v7) for the distance to the
edge, range of distances, flattop range and time difference to
near edge, respectively.
In the past we have tried to set the delays so that that we
sit (operating point) about 12 ns into the plateau region from
the right side timing edge ... this allows for several ns of
"time jitter" as well as possible error in determining the edge
while still maintaining a safe (estimate > 5 ns) distance of
the effective operation point from the fall off edge. The
projected adjustments are given in col 36 of "MAPMT_DELAYS_v7"
and converted to final box delay in HEX in col 39.
These scans are more definitive that those of previous years
(due to mixture of issues) and hence the new values bounce
around a bit, but in general the shifts are only ~ few ns with
a few outliers.
There are several special cases!
For boxes 65 (12S2), 69 (1S2), 79 (3P1), 85 (5S2), 87 (5P1),
90 (6S3), the box delay was set to "400" instead of the max
allowed of "3FF" (a mistake as noted above) which effectively
zeroed out the box delay causing just the left hand timing edge
to be visible in the scans (for box 95 7P1 plots there is something
else is wrong and very little is plotted).
For these special cases one can estimate the timing by looking at the
LHS edge and applying the 50-55ns flat top to guess where the leading
edge is (e.g., see the plots). But in general for these case the timing
was set by looking at neighboring boxes in the clock chain and deducing
a value to use (see spread sheet).
The final Hex delay values are indicated in one of the last columns of
the spreadsheet (MAPMT_DELAYS_v7)
Endcap Tower Timing Settings Run 9
For now see link to blog page:
http://drupal.star.bnl.gov/STAR/blog-entry/wwjacobs/2009/mar/06/run-9-calibr-qa
and go to Section IV
Uploading EEMC Pedestal, Status and Gain Calibrations to the DB
This page is intended to document the process of uploading EEMC calibrations to the DB using the "eemcDb" utility script originally written by Jan Balewski. Some old notes from Jan are here. Before we begin, a quick reminder that this is not a task many people should need to do but should be limited to one or two "experts", who will be given special DB writing priviledges by Dmitry Arkhipkin (arkhipkin@bnl.gov). The code is all in CVS though for documentation purposes.
Building the eemcDb utility:
All the uploads to the EEMC DB are handled by the eemcDb utility which Jan called the "swiss army knife" of DB uploads. The source code to build the eemcDb executible can be found in CVS. To compile the script follow these quick instructions
mkdir yourDirectory
cd yourDirectory

cvs co StRoot/StDbLib/
cd StRoot/StDbLib/
make

cd ../../
cvs co StRoot/StEEmcUtil/database/macros/upload/src/
cd StRoot/StEEmcUtil/database/macros/upload/src/
make
Then the eemcDb executible is ready to use. It can be tested with a simple read command:
eemcDb -r -p Ver2004d/ -T
Uploading tables to the DB:
Thre are several scripts for uploading pedestal, status and gain tables to the DB located in CVS at StRoot/StEEmcUtil/database/macros/upload/. The names are fairly obvious, but just in case, here is the breakdown:
writeIdealGains.C : writes ideal gain tables in ascii files to be uploaded
writeIdealPed.C : write ideal ped tables (pedestal = 0) in ascii files to be uploaded
writeIdealStatus.C : write ideal status tables (status = 0) in ascii files to be uploaded
In the following scripts you need to specify the location of the eemcDb executible (compile instructions above) as its currently listed as "yourDirectory." Also there are various exit lines in the scripts which you'll need to comment out once you're ready to upload (they kept me from accidental uploads in the past so I kept them in place).
writeMapmtGains.sh :
- script which executes eemcDb to write MAPMT gain files to the DB
- requires user input of timestamp, table "flavor", gain file location, and comment to go in DB
- script which executes eemcDb to write tower gain files to the DB
- requires user input of timestamp, table "flavor", gain file location, and comment to go in DB
- script which executes writePed+Status.sh (below) for many runs from the input file which specifies the fillNumber, runNumber, and unix timestamp
- requires user input of list of runs and comments to go in the DB
- script which executes eemcDb to write pedestal and status files (for both towers and MAPMT) to the DB
- loadPed+Status.tcl should provide user input of timestamp, table "flavor", gain file location, and comment to go in DB
One last note that in order to upload to the DB you need write priviledges from Dmitry and to execute the following command which allows you to write to the DB. Once you're done with the upload remove this to prevent "accidental" uploads.
setenv DB_ACCESS_MODE write EEMC Maintenance/Operations Documents
ESMD (Shower Max and Pre- & Post-Shower Detectors)
ETOW (Towers)
Endcap Geometry
Geometry definition
- Detailed description of the geometry (ver 5.1) as implemented by
Oleg Rogachevski are listed in the depth.txt file - Distribution of material as fuction of eta and phi
- Mapping of SMD strips to towers (11/20/03 jwebb)
Geant pictures of calorimeter are generated with plot_geom.kumac
-
View of EndCap caloremeter (variant C) in STAR detector

-
cross section of calorimeter towers variant C
-
cross section of lower half of calorimeter plane ZY at X=0
-
cross section of calorimeter (var.C) plane ZY at X=30cm
-
cross section at eta=2.0front part with SMD
line eta = 2.0 intersects megatile (blue) at its center
and radiators (black) at forward edge.
Hub is seen at upper edge. Each megatile extends from eta=2 to hub
as nonactive plastic and radiator extends as stainless steel. -
cross section at eta=1.086 front part with SMD
line eta = 1.086 intersects megatile at its center
and radiators at the back edge of radiator
Projective (20x25 mm) bar is seen at the lower edge of calorimeter
XXX page 9 - megatile cell structure in local coordinates, particles go along Y axis on this plot. -
regular SMD sector, V plane, blue line depicts +-15 deg. between sectors
-
edge SMD sector with cutted strips, V plane
-
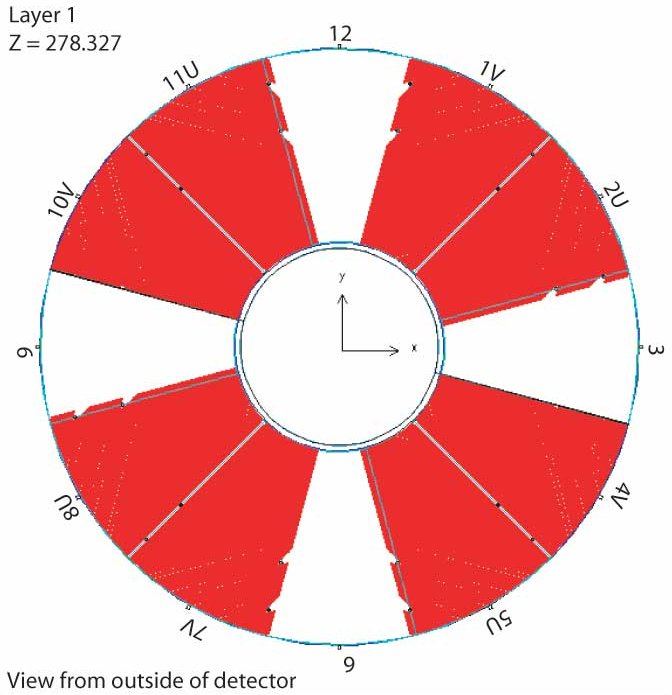
cross section of 1st SMD plane
-
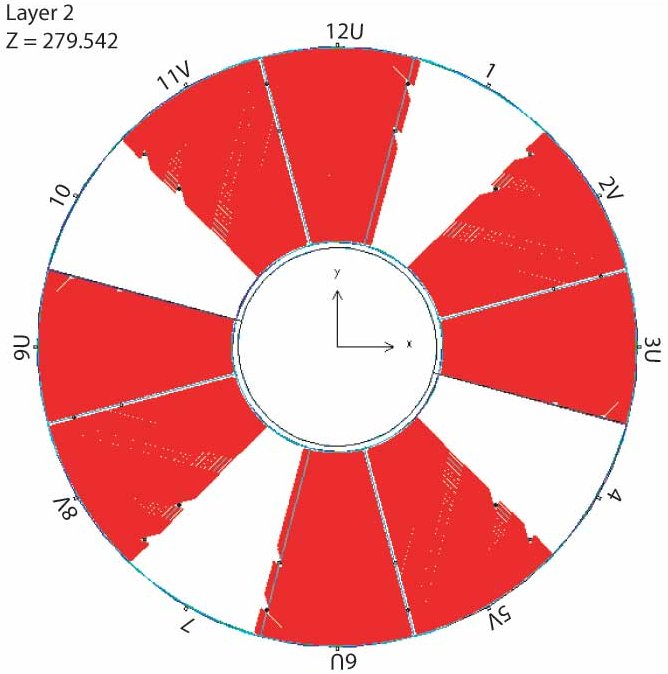
cross section of 2st SMD plane
-
cross section of 3st SMD plane

-
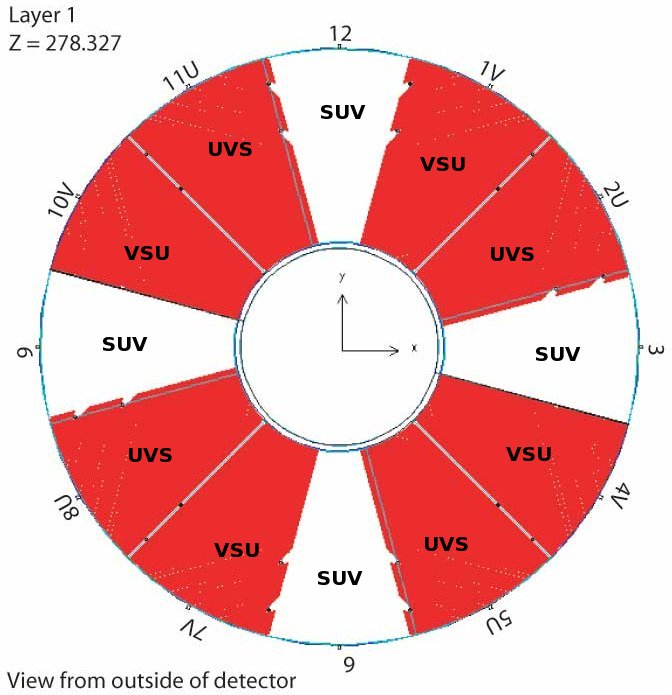
cross section of 1st SMD plane labeled with "SUV" ordering
-
cross section of the gap between SMD sectors
-
cross section of the gap between tower at the sector boundary
-
cross section of the backplate
Three variants of EEMC geometry are available:
A --- lower half with only 5-8 sectors filled with scintillators
B --- fully filled lower half
C --- both halves filled with scintillators
Endcap Geometry update (2009)
EEMC geometry v6.0
Proposed name for the geometry file: pams/geometry/ecalgeo/ecalgeo1.g
List of changes
- CAir bug fixed
- Increased size of mother volume containing SMD strips
- Added material to front and back of SMD planes (material wrapping SMD planes)
- Added SMD spacer layers
- Introduced sector overlaps closer to the "as build" geometry
- Birk's law constants for SMD strips corrected
- Some dimention paramaters tuned to that in real geometry
- Code reorganized and commented
Note:
Lead alloy mixtures are not implemented
due to the problem with mixture in GSTAR/Geant (see below)
Resulting improvements in the simulated EEMC response
- Geometry configuration is closer to the "as build" geometry
- Correct simulation of the transverse shower shape profile
- Realistic (close to 5%) sampling fraction
- More realistic simulation of the tower energy profile (with LOW_EM option)
Supporting materials
EEMC sampling fraction nonlinearities and CAir bug
EEMC geometry reshape
- Jason's plenary talk at LBNL collaboration meeting
- Jason's SPIN-PWG talk at LBNL Collaboration meeting (EEMC geometry revision)
Issue with mixture in GSTAR/Geant
- Lead issue (Ilya's post)
- Lead issue (Alice's post)
- Lead issue report to STARsoft-hn list
Jason's tests and studies
- Validation of EEMC MC Geometry
- SMD Problems at the sector boundary
- EEmc MC Geometry version 5.21
- Rough cut of EEMC SMD spacer geometry
- Check of material in corrected EEMC geometry
- Linearity Check in fixed ecalgeo.g, take II
- Linearity Check in fixed ecalgeo.g
- List of small, almost trivial, problems with the Monte Carlo
- EEMC simulation study: mockup of CDF testbeam experiment
- Verify that the fast simulator sees all of the energy deposited in geant
- Energy dependence of the sampling fraction in the EEMC
- EEMC simulation studies (spin-pwg-simulations-report-07-30-2009.pdf)
Ilya's tests and studies
- new EEMC geometry: Pure lead and new SMD layers
- Jason EEMC geometry: Effect of ELED block change
- Jason EEMC geometry: results with and without LOW_EM options
- Jason EEMC geometry: Jason with ELED block from CVS file
- Jason EEMC geometry: comparison without LOW_EM option
- Jason EEMC geometry: effect of removing new SMD layers
- Jason vs. CVS EEMC: removed SMD layers
- Sampling fraction problem: full STAR vs. EEMC stand alone geometry
- Jason geometry file: Full STAR simulations (sampling fraction, shower shapes)
- Jason geometry tests: SMD energy, number of strip vs. thrown photon position
- Effect of added layers in Jason geometry file
- Volume id fix in Jason geometry file
- Jason vs. CVS EEMC geometry: sampling fraction and shower shapes
- Test of corrected EEMC geometry: LOW_EM cuts
- EEMC geometry tests: on-off SVT detector and EEMC slow-simulator
- Single particle MC with corrected geometry vs. eta-meson from data
- Corrected EEMC geometry: shower shapes
- Corrected EEMC geometry (bug 1618)
Alice's tests and studies
Log of tower base and fee issues
Attached is a text file of tower base and other issues. I went back through the electronic shift log and recorded all the bases that had been replaced and recording of other fixes and problems. The status as of the begin of the run 10 is also stated.
Jim
eemc as-built info and proto tests
Here starts 8/09 a collection of misc. information re: as-built eemc from construction documentation and prototype testing of various sorts.
... to be detailed
emc2-hn minutes (by Jan)
- xx xx, 200x
- next,
- xx xx, 200x
- next,
- xx xx, 200x
- next, I forgot to edit this
- Feb 12, 2007
- Will, run7 plans,
- Will, Jan, Endcap startup plan
- L2 algos plan: Upsilon+displVartex (by Pibero), modified L2gamma (by Saski & Jason), L2pedMon (by Jan) . some links , not much time to implement
- Jason, pi0 from Endcap from 2006 data, efficiency is low
- Will, BPRS-East gross mapping problem found, plan to replay data w/ all known corrections.
- Scott, Endcap calibration, MIP peak seen in towers, pre,post
- Feb 5 2007
- Rory, progress in BPRS mapping
- Adam, in-software mapping correction code
- Will, all, 2007 trigger discussion and Steve
- Jan, electrons in the Endcap in 2006 data
- Pibero, eta dependence of reco pi0 invM for simu for Endcap
- Jan 29, 2007
- Oleg, Barrel electronics
- Jason, new display of Endcap points,clusters , code & writeup will be in CVS soon, needs special TTree as input
- Jan, embedding of TPC+EMC is working, but ... needs 600MB for execution, code in CVS, awaits perr reviue
- Murrad, off-line jet phi anizotrophy for B & E-emc JP triggers
- Will, BPRS, suggested correlation between towers & pre-shower swaps, Rory got code from Adam for tracking toward BTOW
- Scott, ESMD calibration ready for DB upload, only slopes are used, flavor='slopes'
- Jan 22, 2007
- Murrad, offline jet phi,eta spetra
- Will, EMC fast to L2
- many: cray for Endcap off-line calibration
- Dec 18, 2006
- Jan, TPC+Endcap embedding
is operational for pp2006 chain, missing writup, peer review, few
tricks are needed to run it, ready for teasting of algo not for physics - Adam, run dependence of MIP peak for BTOW shows jump on day 114+5, 5% trend for days 120-170
- Scott, Endcap 2006 calibration will be done, status: collecting muDst on the disk
- Will, explained most of the BPRS mapping problems as hadrware swaps, photos of hadrware illustrate the causes
- Naresh, summary of e/h discrimination in the Endcap (ppt) using TPC, dEdx,E/P, and postE, current contamination 14/1, run out of time
- Dec 11,2006
- Wei Ming, evaluation of Endcap pi0 efficiency w/ embedding,
- Jason, M-C e- tracking has eff=~80% for eta<1.6
- Jason, Beam background in Endcap
not seen in 2006, for both: clusters alone & clusters matched
to Pibero's stright through tracks (flag=901) - Adam, ofl-onl BTOW gains, 136 more towers lost mainly due to the isloation cut
- Rory, BPRS mapping, identified miss-match patterns: +20 towers, backward mapping Y=-X
- Dec 4, 2006
- Jason, new Endcap point/cluster/pi0 -maker in CVS , no performance plots shown
- Weihong, Endcap pi0 algo allows to split SMD peak, avr eff of 30% for di-pi0 events
- Adam 1, 2nd iteration of BTOW ofl gains from MIP, no ele used, sizabe spread in phi seen
- Adam 2, time dependence of BTOW slopes, to be investigated, 10% change in average & width reported
- Rory, BPRS mapping , evidence of broken channels & miss-mapped small sections, should not take long to figure all out
- Will, eemc proto SLAC report from 2001
- Will, Endcap HV & FEE work prior to 2007 run
how-to by Jan
Instructions
offline DB upload (write)
Loose notes helping Justin in uploading of the offline DB tables for Endcap
1) Monitoring current content of DB,
use web interface: http://orion.star.bnl.gov/Browser/EEMC/
The following query selects pedestal tables for sector 1 (element ID) for year 2007+

results with just 2 tables:
- the official (just one) table for 2007 run (flavor 'ofl') valid since April 5, 4:40 pm GMT (note it is not EST)
- test table ( flavor=online ) for 2008 run, valid since February 22
If you click on 'Control' you will see the content of this table, but I rarely do that

2) Upload new tables to DB
- need special DB write privileges, only Jan Y Justin have such.
- setenv DB_ACCESS_MODE write
- execute _working_ version of eemcDb with proper params
- you do NOT need any more the dbServer.xml file pointing to robinson.db, so do NOT have it in your main directory
Note, the last successfully compiled and working eemcDb is located at:
/star/u/balewski/dbaseIO-2008-sc.starp/eemcDb - use it as long as it works.
The source code is at sc.starp , user=sysuser, directory: junk2/
Good luck,
Jan
offline DB usage (read)
DB usage : ped, gains, fail/stat flags for EEMC towers/pre/post/SMD
Wed Oct 27 13:09:10 EDT 2004
Key features:
Content of 'ideal' simulation tables:
* channel map as of October 2004
* tower gains : 4096 ADC=60 GeV transverse electromagnetic energy in the tower
* pre/post/smd gains : 23,000 ADC = 1 GeV of energy deposit by a MIP in scint
* all pedestals set at 0 ADC, but sigPed of 1.0 ADC for Towers and of 0.7 ADC for MAPMT
* masks: fail=stat=0 , meaning all elements are good
The above content of sim-tables is consistent with the actual fast EEMC simulator code and hits stored in StEvent & muDst.
Note, in the M-C a sampling fraction of 5% is assumed while converting GEANT energy deposit in tower scint layers to tower ADC. In order to get ~right pi0 or gamma energy a fudge factor of ~4/5 is still needed.
For 2004 data the following 'stat' bits are in use:
#define EEMCSTAT_ONLPED   0x0001 // only pedestal visible
#define EEMCSTAT_STKBT    0x0002 // sticky lower bits
#define EEMCSTAT_HOTHT    0x0004 // masked for HT trigger
#define EEMCSTAT_HOTJP    0x0008 // masked for JP trigger
#define EEMCSTAT_HIGPED   0x0010 // ped is very high but channel seems to work
#define EEMCSTAT_HOTSTR   0x0020 // hot esmd strip
#define EEMCSTAT_JUMPED   0x0040 // jumpy  ped over several chan over days
#define EEMCSTAT_WIDPED   0x0080 // wide ped over:2.5 ch  towers, 1.5 ch MAPMT's
It is up to a user what 'stat' condition is fatal for his/her analysis.
Potentaily good elements may have set the 'STKBT', meaning the lowest bit(s) did not worked and only the energy reolution is worse.
'JUMPED' bit means ped jumped by 20-40 ADC counts during one run. It is fatal for calibration with MIP's but ~OK for reco of 20 GeV gammas.
For the record the following 'fatal' bits are set and all users should reject all elements marked that way.
#define EEMCFAIL_GARBG  0x0001  // exclude from any analysis
#define EEMCFAIL_HVOFF  0x0002  // HV was off
#define EEMCFAIL_NOFIB  0x0004  // signal fiber is broken
#define EEMCFAIL_CPYCT  0x0008  // stuck in copyCat mode
~/ezGames/dbase/src/eemcDb -p Ver2004d/sector05/eemcPMTstat -H -t 2001To see content of stat/fail table for a given time stamp type:
~/ezGames/dbase/src/eemcDb -p Ver2004d/sector05/eemcPMTstat -g -t 1080832032
Use constants defined in
$STAR/StRoot/StEEmcUtil/EEfeeRaw/EEdims.h
Access to EEMC DB-maker within the chain
In .h add
......
class  StEEmcDbMaker;
class StYourAnalysistMaker : public StMaker {
 private:
  StEEmcDbMaker *eeDb;
  ....
}
In .cxx add
#include "StEEmcDbMaker/StEEmcDbMaker.h"
#include "StEEmcDbMaker/EEmcDbItem.h"
#include "StEEmcDbMaker/cstructs/eemcConstDB.hh"
#include "StEEmcUtil/EEfeeRaw/EEname2Index.h"
.....
StYourAnalysistMaker::Init() {
 // connect to eemcDB
  eeDb = (StEEmcDbMaker*)GetMaker("eemcDb"); // or "eeDb" in BFC
  assert(eeDb); // eemcDB must be in the chain, fix it
}
Details of DB usage for muDst events , loop over hist for one event:
.....
 // choose which 'stat' bits are fatal for you, e.g.
 uint killStat=EEMCSTAT_ONLPED  | ......... ;
.....
   StMuEmcCollection* emc = mMuDstMaker- >muDst()- >muEmcCollection();
.....
  //.........................  T O W E R S .....................
  for (i=0; i < emc->getNEndcapTowerADC(); i++) {
    int sec,eta,sub,rawAdc; //muDst  ranges:sec:1-12, sub:1-5, eta:1-12
    emc->getEndcapTowerADC(i,rawAdc,sec,sub,eta);
    assert(sec>0 && sec< =MaxSectors);// total corruption of muDst
    //Db ranges: sec=1-12,sub=A-E,eta=1-12,type=T,P-R ; slow method
    const EEmcDbItem *x=eeDb->getTile(sec,'A'+sub-1,eta,'T');
    ...... this is the same also for pre/post/smd (except ene fudge factor!)................
    assert(x); // it should never happened for muDst
    if(x->fail ) continue;  // drop broken channels
    if(x->stat &  killStat) continue; // drop not working channels
    if(x->gain < =0) continue; // drop it, unless you work with ADC spectra
    if(rawAdc < x-> thr) continue; // drop raw ADC < ped+N*sigPed
    float adc=rawAdc-x->ped; // ped subtracted ADC
    float ene=adc/x->gain;   // energy in GeV
    if(MCflag) ene/=0.8; //fudge factor for TOWER sampling fraction,  to get pi0, gamma energy right
    .... do your stuff ..........
    ........................
 } // end of towers

 //.........................  P R E - P O S T .....................
  int pNh= emc->getNEndcapPrsHits();
  for (i=0; i < pNh; i++) {
    int pre, sec,eta,sub;
    //muDst  ranges: sec:1-12, sub:1-5, eta:1-12 ,pre:1-3==>pre1/pre2/post
    StMuEmcHit *hit=emc->getEndcapPrsHit(i,sec,sub,eta,pre);
    float rawAdc=hit->getAdc();
    //Db ranges: sec=1-12,sub=A-E,eta=1-12,type=T,P-R ; slow method
    const EEmcDbItem *x=eeDb-> getTile(sec,sub-1+'A', eta, pre-1+'P');
    if(x==0) continue;
    ..... etc, as for towers ....
    ..............
   }

   //.......................  S M D ................................
  char uv='U';
  for(uv='U'; uv < ='V'; uv++) {
    int sec,strip;
    int nh= emc->getNEndcapSmdHits(uv);
     for (i=0; i < nh; i++) {
      StMuEmcHit *hit=emc->getEndcapSmdHit(uv,i,sec,strip);
      float rawAdc=hit->getAdc();
      const EEmcDbItem *x=eeDb->getByStrip(sec,uv,strip);
      assert(x); // it should never happened for muDst
      ... etc, as for towers ....
      ..............
  }
}
Details of DB usage for StEvent , loop over hist for one event - posted for the record.
Remember, NEVER EVER access EEMC data from StEvent. It is so slow and clumsy. It is asking for a trouble. All EEMC analysis SHOULD work on muDst ONLY - Jan
 T O W E R S
.....
 // choose which 'stat' bits are fatal for you, e.g.
 uint killStat=EEMCSTAT_ONLPED  | .......;
.....
 StEvent*  mEvent = (StEvent*) StMaker::GetChain()->GetInputDS("StEvent");  assert(mEvent);
 StEmcCollection* emcC =(StEmcCollection*)mEvent->emcCollection(); assert(emcC);
 StEmcDetector* etow = emcC->detector(kEndcapEmcTowerId);  assert(etow);

 for(uint mod=1;mod < =det->numberOfModules();mod++) {
    StEmcModule*     module=det->module(mod);
    StSPtrVecEmcRawHit&     hit=  module->hits();
    int  sec=mod ; // range 1-12
    for(uint ih=0;ih < hit.size();ih++){
      StEmcRawHit *h=hit[ih];
      char sub='A'+h- >sub()-1; // range 'A' - 'E'
      int  eta=h->eta(); // range 1-12
      int  rawAdc=h->adc(); // raw ADC
      //Db ranges: sec=1-12,sub=A-E,eta=1-12,type=T,P-R; slow method
      const EEmcDbItem *x=eeDb->getTile(sec,sub,eta,'T');
      if(x==0) continue;
      ....  now follow muDst example for towers ....
    } // end of sector
  }

 PRE1,PRE2, and POST  -all mixed together  preL='P','Q','R' for pres1,pres2,post, respectively    StEmcDetector* det=emcC- > detector(kEndcapEmcPreShowerId)//==(14)   for(int imod=1;imod < =det- > numberOfModules();imod++) {    StEmcModule*     module=det- > module(imod);    printf("EPRE sect=%d nHit=%d\n",imod, module- > numberOfHits());    StSPtrVecEmcRawHit&     hit=  module- > hits();    int ih;    for(ih=0;ih < hit.size();ih++){      StEmcRawHit *x=hit[ih];      int sec=x- > module();      int ss=x- > sub()-1;      char sub='A'+ss%5;      char preL='P'+ss/5;      int eta=x- > eta();      int adc=x- > adc();      printf("ih=%d %02d%c%c%02d ss=%d -->adc=%d ener=%f ss=%d\n",ih,sec,preL,sub,eta,ss,adc, x- > energy(),ss); } SMD U & V are stored in SEPARATE collections  StEmcDetector* det=emcC- > detector(kEndcapSmdUStripId)//  U=15, V=16   for(int imod=1;imod < =det->numberOfModules();imod++) {    StEmcModule*     module=det- > module(imod);    printf("ESMD sector=%d nHit=%d\n",imod, module- > numberOfHits());    StSPtrVecEmcRawHit&     hit=  module- > hits();    int ih;    for(ih=0;ih < hit.size();ih++){      StEmcRawHit *x=hit[ih];      int sec=x- > module();      int strip=x- > eta();      int adc=x- > adc();      printf("ih=%d %02dU%03d -->adc=%d ener=%f\n",ih,sec,strip,adc, x- > energy());  }
Details of the DB- Maker(s) setup in the muSort.C script:
myDb=new StEEmcDbMaker("eemcDb");
....
myDb->setThreshold(2.5);
....
chain->Init();
....
  St_db_Maker *dbMk=new St_db_Maker("db", "MySQL:StarDb", "$STAR/StarDb");
     dbMk->SetFlavor("sim","eemcPMTcal");
     dbMk->SetFlavor("sim","eemcPIXcal");
     dbMk->SetFlavor("sim","eemcPMTped");
     dbMk->SetFlavor("sim","eemcPMTstat");
     dbMk->SetFlavor("sim","eemcADCconf");
     dbMk->SetFlavor("sim","eemcPMTname");
    ? dbMk->SetDateTime(20031120,0);  (you may need to specify the DB time stamp)
To verify the ideal DB tables were loaded you should find in the log-file the following message for every sector: ..... EEDB conf ADC map for sector=6 StInfo: EEDB chanMap=Ideal EEMC mapping, (October 2004), RF StInfo: EEDB calTw=Ideal EEMC tower gains, E_T 60GeV=4096ch, RF StInfo: EEDB tubeTw=Ideal EEMC P-names, (October 2004), RF StInfo: EEDB calMAPMT=Ideal EEMC P,Q,R,U,V gains, 23000ch/GeV, RF StInfo: EEDB ped=Ideal EEMC peds/ADC at 0.0, sig: Tow=1.0, Mapmt=0.7; RF StInfo: EEDB stat=Ideal EEMC stat=fail=0 (all good), RF ....To use Barrel ideal DB do
  starDb->SetFlavor("sim", "bemcPed");
  starDb->SetFlavor("sim", "bemcStatus");
  starDb->SetFlavor("sim", "bemcCalib");
  starDb->SetFlavor("sim", "bemcGain");
slow controls archive viewer
There is a viewer for slow controls quantities documented at
http://drupal.star.bnl.gov/STAR/subsys/ctl/archive-viewer
There is an interface through a web browser or a java script. Both must run from the starp internal network. I used the java script run from sc. Two plots of voltage tracking are attached. These were made via screen capture of the display.
trash
Trash pages for testingchain tricks
do I remember it correct the current implementation of StMaker() does
not prevent execution of subsequent makers in the chain even if the
earlier one returns:
return kStErr;
It depends. If maker is "privileged" then loop is ended.
Normal user makers are not priviliged, to avoid skipping of other users
makers.
The priviliged ones are all I/O makers and StGeantMaker (which is also I/O
maker)
User could define his maker as a priviliged:
instead of:
bfc(999,...)
user should:
bfc(0,...);
chain->SetAttr(".Privilege",1,"UserMakerName" );
chain->EventLoop(1,999);
Victor
software
Endcap Sofware 2006++
test entry
test child page control
timing_WMZ
Fig. 1 Tower Crate
Fig. 2 Crate 64-67
Fig. 3 Crate 68-71
Fig. 4 Crate 72_75
Fig. 5 Crate 76-79
Fig. 6 Crate 80_83
Fig. 7 Crate 84-87
Fig. 8 Crate 88-91
Fig. 9 Crate 92-95
Fig. 10 Crate 96-99
Fig. 11 Crate 100-103
Fig. 12 Crate 104-107
Fig. 13 Crate 108-111
Plots of channels
mapmt-crate-64.pdf