- Hard Probes
- Heavy Flavor
- Jet-like correlations
- Other Groups
- Peripheral Collisions
- Spin
- Spin PWG
- Spin/Cold-QCD Older Physics Analysis
- 2006 EEMC Neutral Pion Cross Section and A_LL
- 2006 Gamma + Jet
- 2009 Lambda D_LL @ 200 GeV
- 2009 dijet x-sect/A_LL @ 200 GeV
- 2011 FMS Jet-like correlations @ 500 GeV
- 2011 FMS inclusive pions @ 500 GeV
- 2012 EEMC Neutral Pion A_LL
- 2012 Jet A_LL @ 500 GeV
- 2012 Lambda D_TT @200GeV
- 2012 Pi0 - Jet A_LL @ 500
- 2012 Pions in Jets A_UT @ 200 GeV
- 2012 dijet A_LL @ 500
- 2012/13 FMS A_LL @ 500 GeV
- 2013 Di-jet A_LL @ 500 GeV
- A New Users Guide to PDSF Success
- Analyses from the early years
- (A) List of Physics Analysis Projects (obsolete)
- Common Analysis Trees
- EEMC Direct Photon Studies (Pibero Djawotho, 2006-2008)
- 2006.07.31 First Look at SMD gamma/pi0 Discrimination
- 2006.08.04 Second Look at SMD gamma/pi0 Discrimination
- 2006.08.06 Comparison between EEMC fast and slow simulator
- 2006.09.15 Fit Parameters
- 2007.02.05 Reconstructed/Monte Carlo Photon Energy
- 2007.02.08 E_reco / E_mc vs. eta
- 2007.02.11 Reconstructed/Monte Carlo Muon Energy
- 2007.02.15 160 GeV photons
- 2007.02.15 20 GeV photons
- 2007.02.15 80 GeV photons
- 2007.02.15 Reconstructed/Monte Carlo Electron Energy
- 2007.02.19 10 GeV photons
- 2007.02.19 40 GeV photons
- 2007.02.19 5 GeV photons
- 2007.02.19 Summary of Reconstructed/Monte Carlo Photon Energy
- 2007.05.24 gamma/pi0 separation in EEMC using linear cut
- 2007.05.24 gamma/pi0 separation in EEMC using quadratic cut
- 2007.05.24 gamma/pi0 separation in EEMC using quadratic cut
- 2007.05.30 Efficiency of reconstructing photons in EEMC
- 2007.06.12 gamma/pi0 separation in EEMC at pT 5-10 GeV
- 2007.06.28 Photons in Pythia
- 2007.07.09 How to run the gamma fitter
- 2007.07.25 Revised gamma/pi0 algorithm in 2006 p+p collisions at sqrt(s)=200 GeV
- 2007.09.12 Endcap Electrons
- 2008.01.23 Endcap etas
- 2008.02.27 ESMD shape library
- 2008.02.28 ESMD QA for run 7136033
- 2008.03.04 A second look at eta mesons in the STAR Endcap Calorimeter
- 2008.03.08 Adding the SMD energy to E_reco/E_MC for Photons
- 2008.03.21 Chi square method
- 2008.04.08 Data-Driven Shower Shapes
- 2008.04.12 Data-Driven Residuals
- 2008.04.12 Pythia Gamma-Jets
- 2008.04.16 Jet Finder QA
- 2008.04.20 BUR 2009
- 2008.04.22 Run 6 Photon Yield Per Trigger
- 2008.05.07 Number of Jets
- 2008.05.09 Gamma-jets pT distributions
- 2008.05.19 Binning the shower shape library
- 2008.06.03 Jet A_LL Systematics
- 2008.06.18 Photon-jet reconstruction with the EEMC - Part 2 (STAR Collaboration Meeting - UC Davis)
- 2008.07.16 Extracting A_LL and DeltaG
- 2008.07.20 How to install Pythia 6 and 8 on your laptop?
- 2008.07.23 Hot Strips Identified by Hal Spinka
- 2008.07.24 Strips from Weihong's 2006 ppLong 20 runs
- G/h Discrimination Algorithm (Willie)
- Neutral Pions 2005: Frank Simon
- Neutral strange particle transverse asymmetries (tpb)
- Photon-jet with the Endcap (Ilya Selyuzhenkov)
- Relative Luminosity Analysis
- Run 6 Dijet Cross Section (Tai Sakuma)
- Run 6 Dijet Double Longitudinal Spin Asymmetry (Tai Sakuma)
- Run 6 Inclusive Jet Cross Section (Tai Sakuma)
- Run 6 Neutral Pions
- Run 6 Relative Luminosity (Tai Sakuma)
- Run 8 trigger planning (Jim Sowinski)
- Run 9
- Beam Polarizations
- Charged Pions
- Fully Reconstructed Ws
- Jet Trees
- W 2009 analysis , pp 500 GeV
- W 2011 AL
- Useful Links
- Working Group Members
2007.02.08 E_reco / E_mc vs. eta
Updated on Fri, 2010-07-16 11:08. Originally created by seluzhen on 2010-07-16 10:21.
Under:
Pibero Djawotho Last updated Thu Feb 8 13:59:29 EST 2007
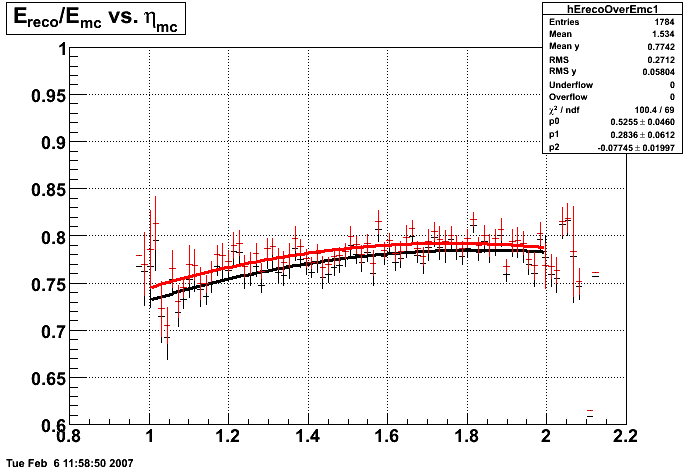
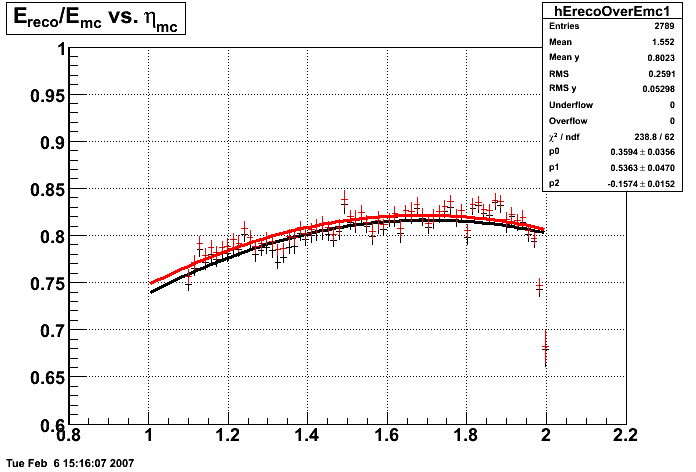
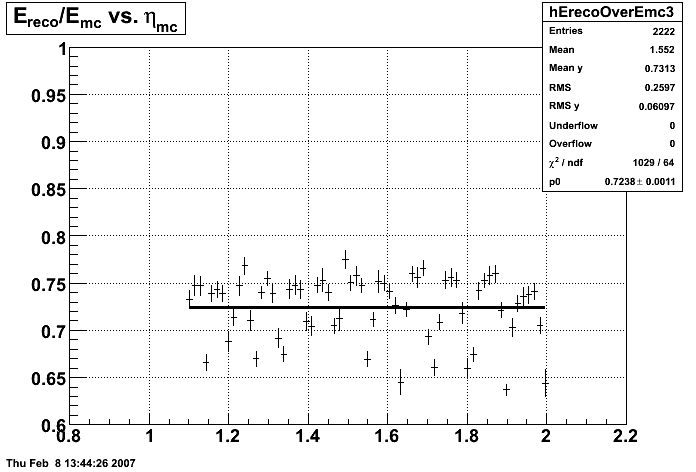
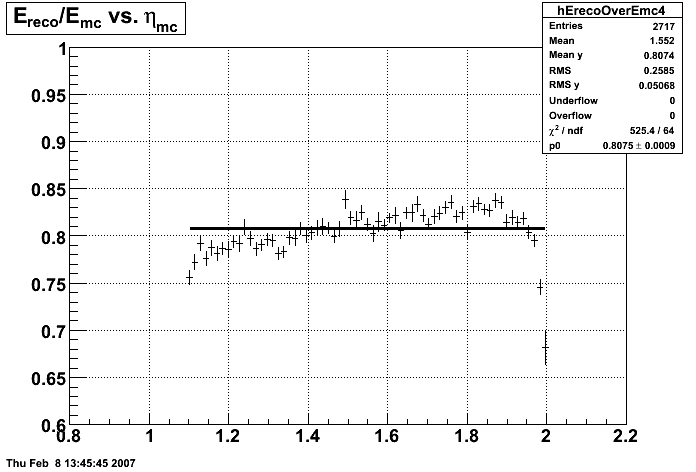
E_reco / E_mc vs. eta
Legend
- black curve: before EEMC slow simulator
- red curve: after EEMC slow simulator
Jason's Monte Carlo
- 4.4k single gamma's
- No SVT
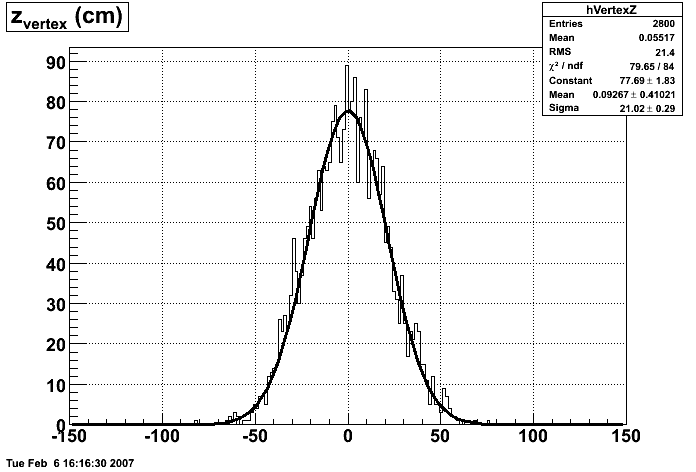
- Nominal vertex
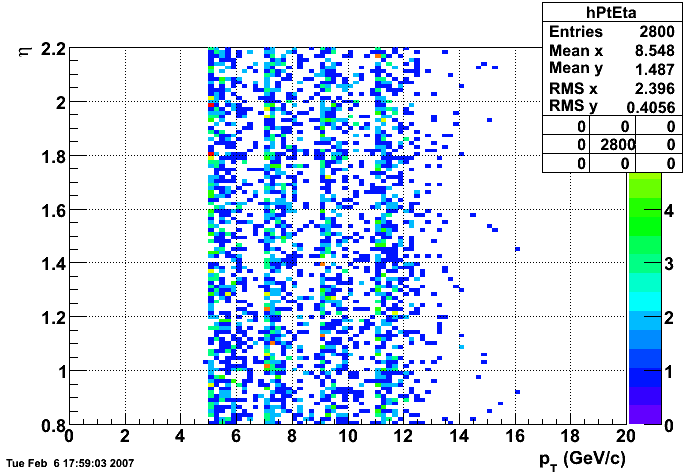
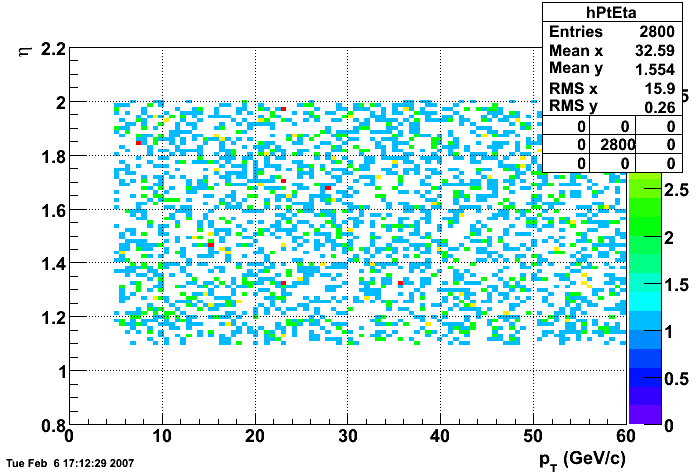
- Flat in pt 4-12 GeV
Will's Monte Carlo
- 10k single gamma's
- SVT/SSD out
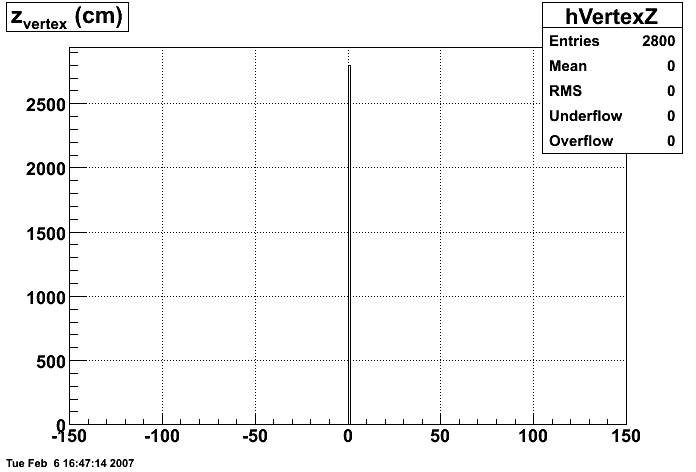
- Vertex at 0
- Flat in pt 5-60 GeV
In the plot below, I use the energy of the single tower (tower with max energy) presumably the tower the photon hit. The nonlinearity seems to disappear.
In the plot below, I use the energy of the 3x3 cluster of tower centered around the tower with the max energy. The nonlinearity is restored.
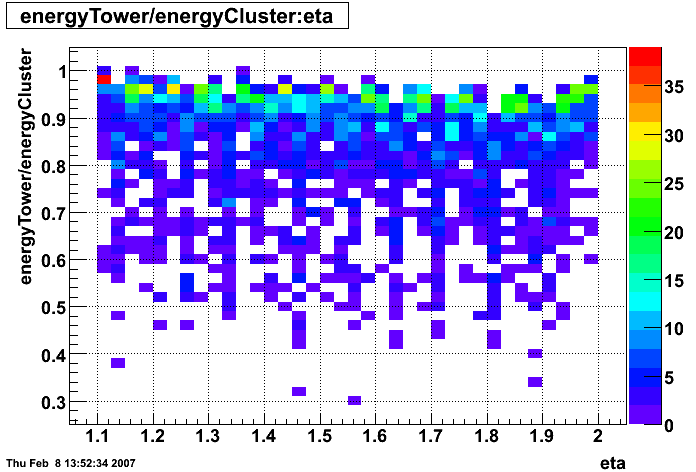
The plot below shows Etower/Ecluster vs. eta where the cluster consists of 3x3 towers centered around the max energy tower.
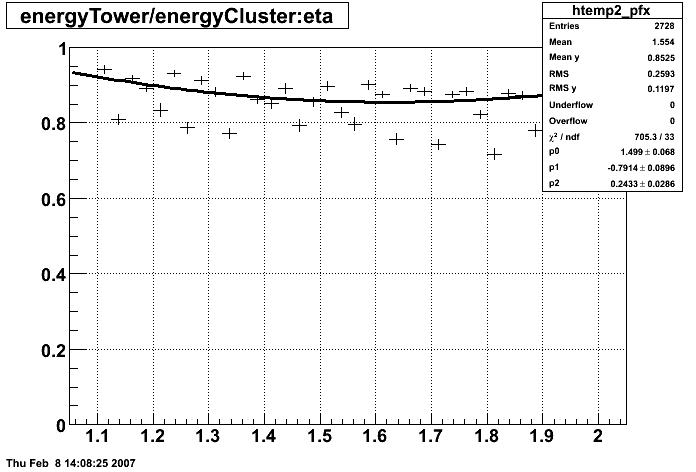
Below is the profile of E_tower/E_cluster vs. eta.
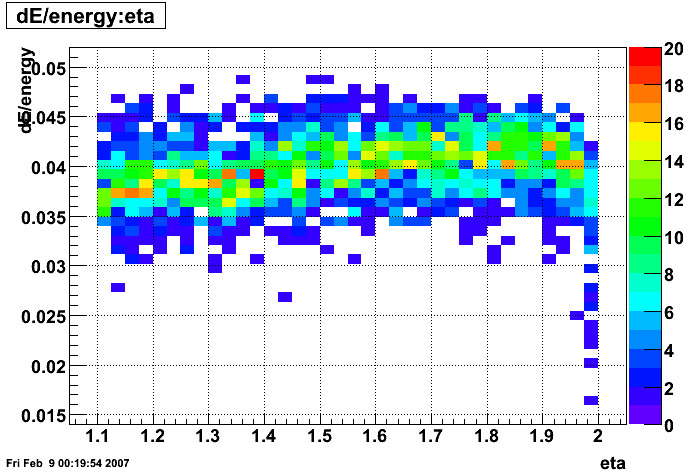
The plot below shows the energy sampled by the entire calorimeter as a function of eta, i.e. sampling fraction as a function of eta.
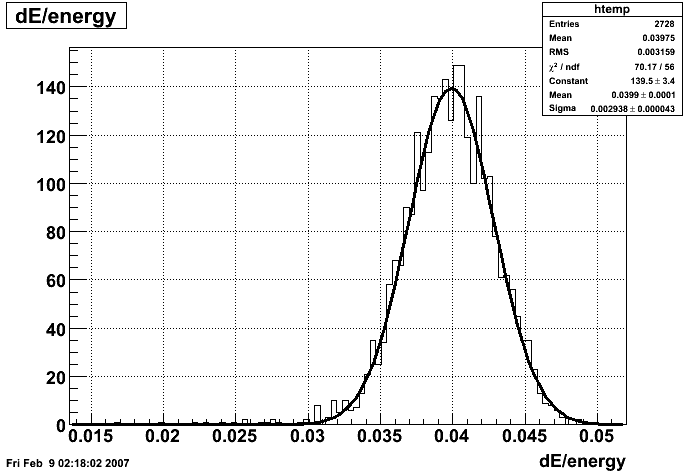
Sampling fraction integrated over all eta's.
Pibero Djawotho Last updated Thu Feb 8 13:59:29 EST 2007
»
- Printer-friendly version
- Login or register to post comments