- Hard Probes
- Heavy Flavor
- Jet-like correlations
- Other Groups
- Peripheral Collisions
- Spin
- Spin PWG
- Spin/Cold-QCD Older Physics Analysis
- 2006 EEMC Neutral Pion Cross Section and A_LL
- 2006 Gamma + Jet
- 2009 Lambda D_LL @ 200 GeV
- 2009 dijet x-sect/A_LL @ 200 GeV
- 2011 FMS Jet-like correlations @ 500 GeV
- 2011 FMS inclusive pions @ 500 GeV
- 2012 EEMC Neutral Pion A_LL
- 2012 Jet A_LL @ 500 GeV
- 2012 Lambda D_TT @200GeV
- 2012 Pi0 - Jet A_LL @ 500
- 2012 Pions in Jets A_UT @ 200 GeV
- 2012 dijet A_LL @ 500
- 2012/13 FMS A_LL @ 500 GeV
- 2013 Di-jet A_LL @ 500 GeV
- A New Users Guide to PDSF Success
- Analyses from the early years
- (A) List of Physics Analysis Projects (obsolete)
- Common Analysis Trees
- EEMC Direct Photon Studies (Pibero Djawotho, 2006-2008)
- 2006.07.31 First Look at SMD gamma/pi0 Discrimination
- 2006.08.04 Second Look at SMD gamma/pi0 Discrimination
- 2006.08.06 Comparison between EEMC fast and slow simulator
- 2006.09.15 Fit Parameters
- 2007.02.05 Reconstructed/Monte Carlo Photon Energy
- 2007.02.08 E_reco / E_mc vs. eta
- 2007.02.11 Reconstructed/Monte Carlo Muon Energy
- 2007.02.15 160 GeV photons
- 2007.02.15 20 GeV photons
- 2007.02.15 80 GeV photons
- 2007.02.15 Reconstructed/Monte Carlo Electron Energy
- 2007.02.19 10 GeV photons
- 2007.02.19 40 GeV photons
- 2007.02.19 5 GeV photons
- 2007.02.19 Summary of Reconstructed/Monte Carlo Photon Energy
- 2007.05.24 gamma/pi0 separation in EEMC using linear cut
- 2007.05.24 gamma/pi0 separation in EEMC using quadratic cut
- 2007.05.24 gamma/pi0 separation in EEMC using quadratic cut
- 2007.05.30 Efficiency of reconstructing photons in EEMC
- 2007.06.12 gamma/pi0 separation in EEMC at pT 5-10 GeV
- 2007.06.28 Photons in Pythia
- 2007.07.09 How to run the gamma fitter
- 2007.07.25 Revised gamma/pi0 algorithm in 2006 p+p collisions at sqrt(s)=200 GeV
- 2007.09.12 Endcap Electrons
- 2008.01.23 Endcap etas
- 2008.02.27 ESMD shape library
- 2008.02.28 ESMD QA for run 7136033
- 2008.03.04 A second look at eta mesons in the STAR Endcap Calorimeter
- 2008.03.08 Adding the SMD energy to E_reco/E_MC for Photons
- 2008.03.21 Chi square method
- 2008.04.08 Data-Driven Shower Shapes
- 2008.04.12 Data-Driven Residuals
- 2008.04.12 Pythia Gamma-Jets
- 2008.04.16 Jet Finder QA
- 2008.04.20 BUR 2009
- 2008.04.22 Run 6 Photon Yield Per Trigger
- 2008.05.07 Number of Jets
- 2008.05.09 Gamma-jets pT distributions
- 2008.05.19 Binning the shower shape library
- 2008.06.03 Jet A_LL Systematics
- 2008.06.18 Photon-jet reconstruction with the EEMC - Part 2 (STAR Collaboration Meeting - UC Davis)
- 2008.07.16 Extracting A_LL and DeltaG
- 2008.07.20 How to install Pythia 6 and 8 on your laptop?
- 2008.07.23 Hot Strips Identified by Hal Spinka
- 2008.07.24 Strips from Weihong's 2006 ppLong 20 runs
- G/h Discrimination Algorithm (Willie)
- Neutral Pions 2005: Frank Simon
- Neutral strange particle transverse asymmetries (tpb)
- Photon-jet with the Endcap (Ilya Selyuzhenkov)
- Relative Luminosity Analysis
- Run 6 Dijet Cross Section (Tai Sakuma)
- Run 6 Dijet Double Longitudinal Spin Asymmetry (Tai Sakuma)
- Run 6 Inclusive Jet Cross Section (Tai Sakuma)
- Run 6 Neutral Pions
- Run 6 Relative Luminosity (Tai Sakuma)
- Run 8 trigger planning (Jim Sowinski)
- Run 9
- Beam Polarizations
- Charged Pions
- Fully Reconstructed Ws
- Jet Trees
- W 2009 analysis , pp 500 GeV
- W 2011 AL
- Useful Links
- Working Group Members
2008.07.16 Extracting A_LL and DeltaG
Updated on Fri, 2010-07-16 11:10. Originally created by seluzhen on 2010-07-16 10:44.
Under:


Pibero Djawotho Last updated Wed Jul 16 10:29:22 EDT 2008
Extracting A_LL and DeltaG
Determining state of beam polarization for Monte Carlo events
While Pythia does a pretty good job of simulating prompt photon production in p+p collisions, it does not include polarization for the colliding protons nor partons. A statistical method for assigning polarization states for each event based on ALL [1] is demonstrated in this section. For an average number of interactions for each unpolarized bunch crossing, Neff, the occurence of an event with a particular polarization state obeys a Poisson distribution with average yield of events per bunch crossing:
For simplicity, the polarizations of the blue and yellow beams are assumed to be P
B
=P
Y
=0.7 and N
eff
=0.01. The "+" spin state defines the case where both beams have the same helicities and the "-" spin state for the case of opposite helicities. The asymmetry A
LL
is calculated from the initial states polarized and unpolarized parton distribution functions and parton-level asymmetry:
The algorithm then consists in alternatively drawing a random value N
int
from the Poisson distributions with mean μ
+
and μ
-
until N
int
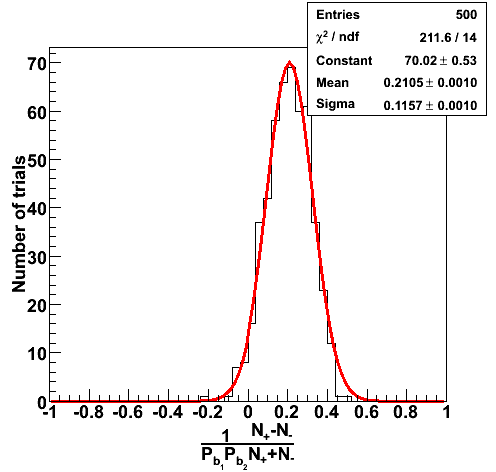
>0 at which point an interaction has occured and the event is assigned the current spin state. The functioning of the algorithm is illustrated in Figure 1a where an input A
LL
=0.2 was fixed and N
trials
=500 different asymmetries were calculated. Each trial integrated N
total
=300 events. It is then expected that the mean A
LL
~0.2 and the statistical precision~0.1:
Indeed, both the A
LL
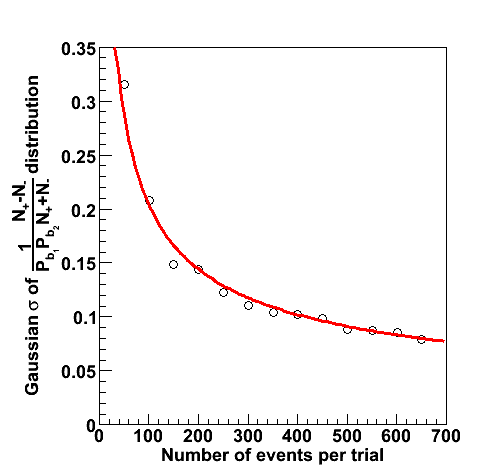
and its error are reproduced. In addition, variations on the number of events per trial were investigated (N
total
) in Figure 1b. The extracted width of the Gaussian distribution for A
LL
is consistent with the prediction for the error (red curve).
| Figure 1a | Figure 1b |
 |
 |
Event reconstruction
For this study, the gamma-jets Monte Carlo sample for all partonic pT were used. As an example, the prompt photon processes for the partonic pT bin 9-11 GeV and their total cross sections are listed in the table below. Each partonic pT bin was divided into 15 files each of 2000 events.
 ==============================================================================
 I                                  I                            I            I
 I            Subprocess            I      Number of points      I    Sigma   I
 I                                  I                            I            I
 I----------------------------------I----------------------------I    (mb)    I
 I                                  I                            I            I
 I N:o Type                         I    Generated         Tried I            I
 I                                  I                            I            I
 ==============================================================================
 I                                  I                            I            I
 I   0 All included subprocesses    I         2000          9365 I  3.074E-06 I
 I  14 f + fbar -> g + gamma        I          331          1337 I  4.930E-07 I
 I  18 f + fbar -> gamma + gamma    I            2             8 I  1.941E-09 I
 I  29 f + g -> f + gamma           I         1667          8019 I  2.579E-06 I
 I 114 g + g -> gamma + gamma       I            0             1 I  1.191E-10 I
 I 115 g + g -> g + gamma           I            0             0 I  0.000E+00 I
 I                                  I                            I            I
 ==============================================================================
The cross sections for the different partonic pT bins has been tabulated by Michael Betancourt and is reproduced here for convenience.
| Partonic pT [GeV] | Cross Section [mb] |
| 3-4 | 0.0002962 |
| 4-5 | 0.0000891 |
| 5-7 | 0.0000494 |
| 7-9 | 0.0000110 |
| 9-11 | 0.00000314 |
| 11-15 | 0.00000149 |
| 15-25 | 0.000000317 |
| 25-35 | 0.00000000990 |
| 35-45 | 0.000000000449 |
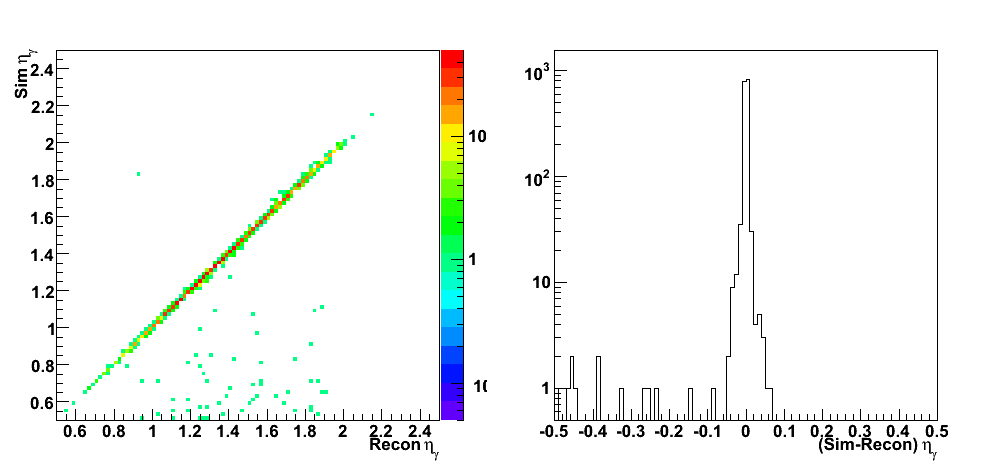
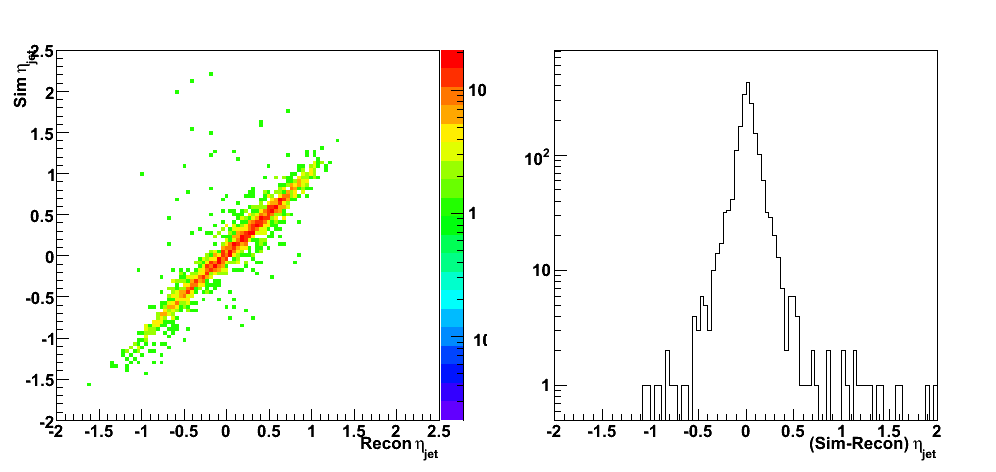
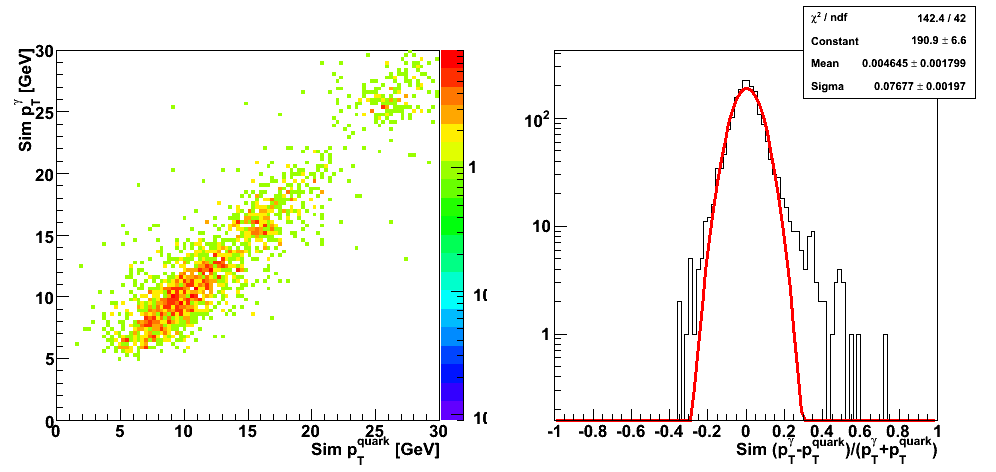
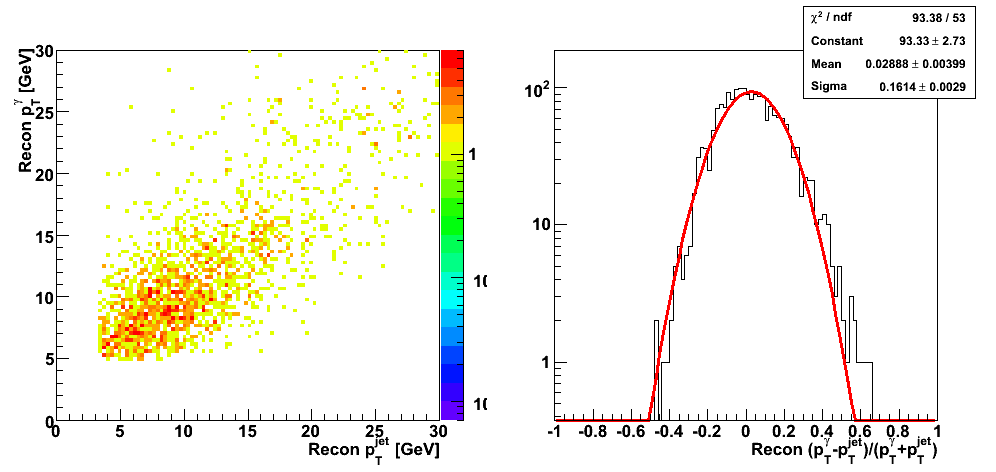
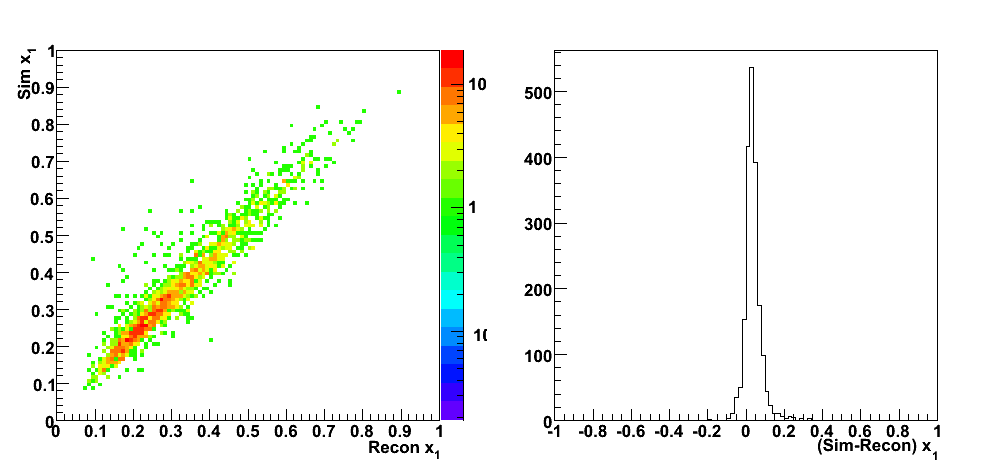
These events were processed through the 2006 pp200 analysis chain, albeit without any cuts on the SMD. The simulated quantities were taken from the Pythia record and the reconstructed ones from the analysis.
| Figure 2 |
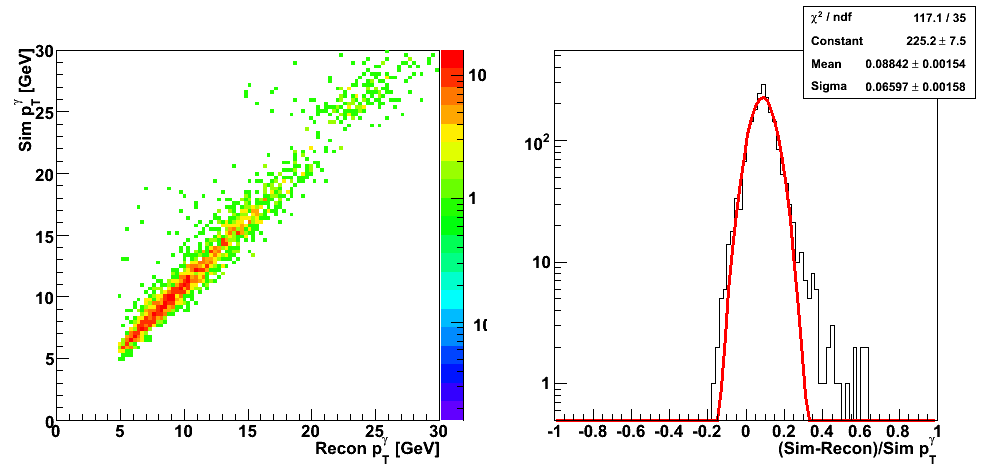 |
| Figure 3 |
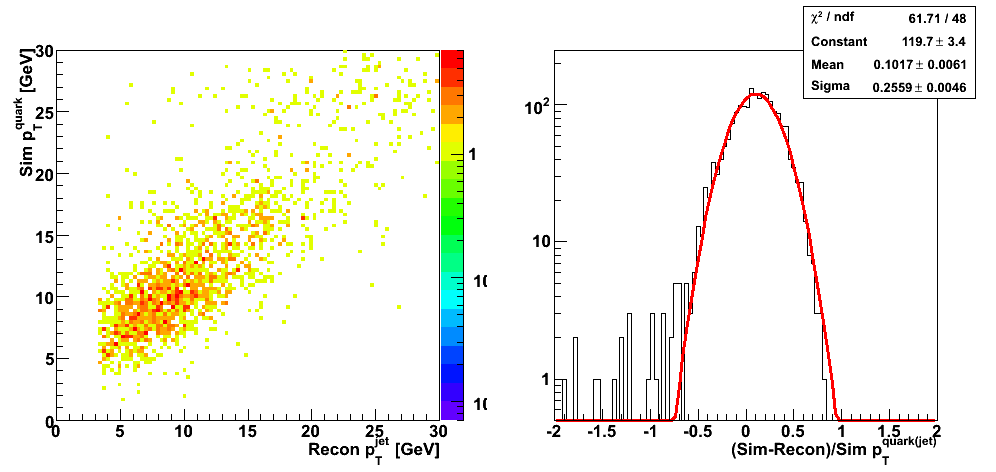 |
| Figure 4 |
 |
| Figure 5 |
 |
| Figure 6 |
 |
| Figure 7 |
 |
| Figure 8 |
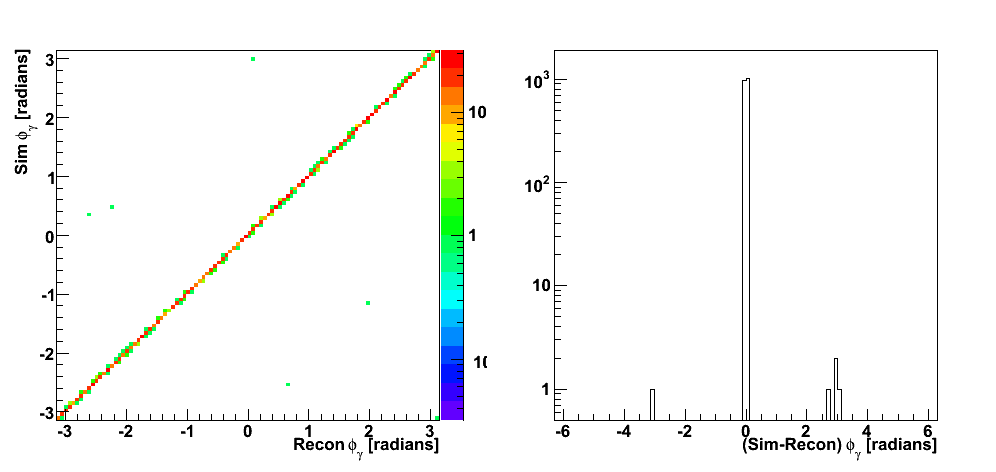 |
| Figure 9 |
 |
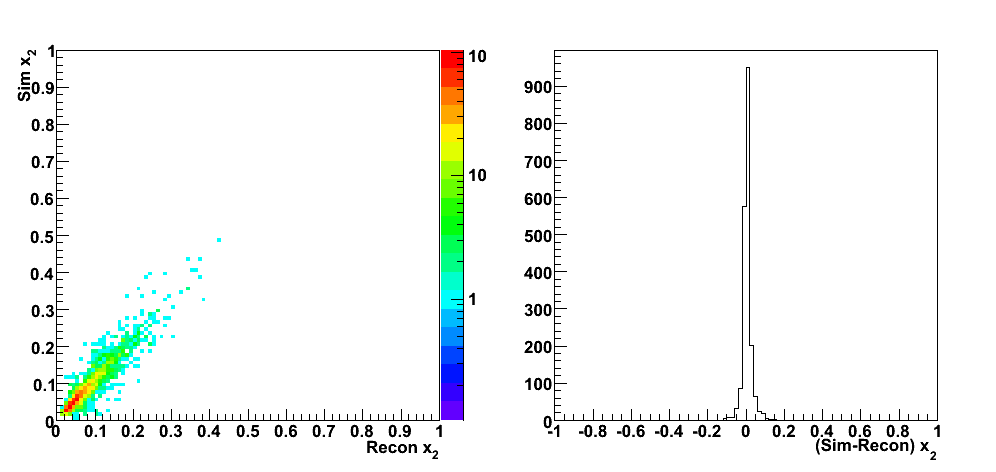
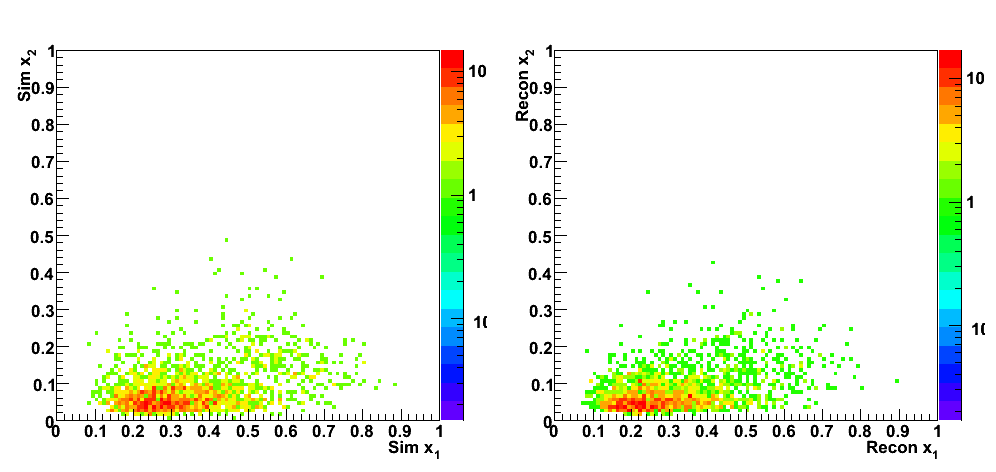
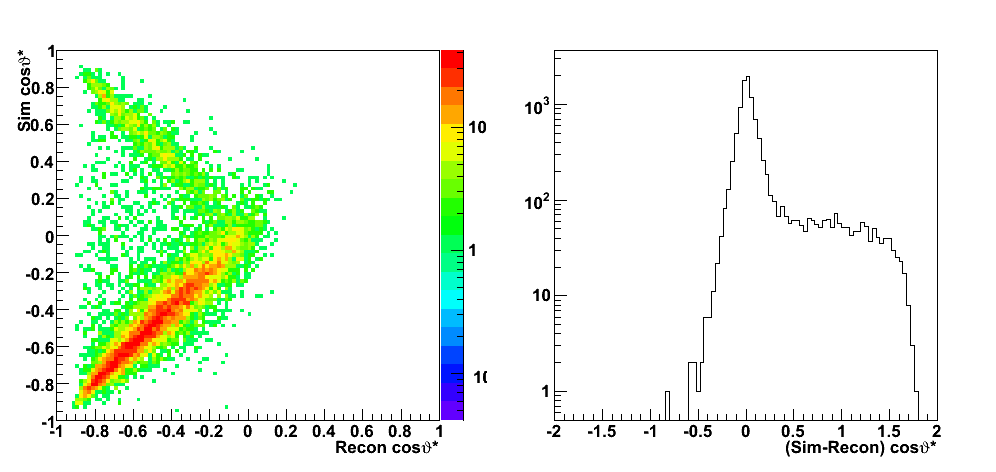
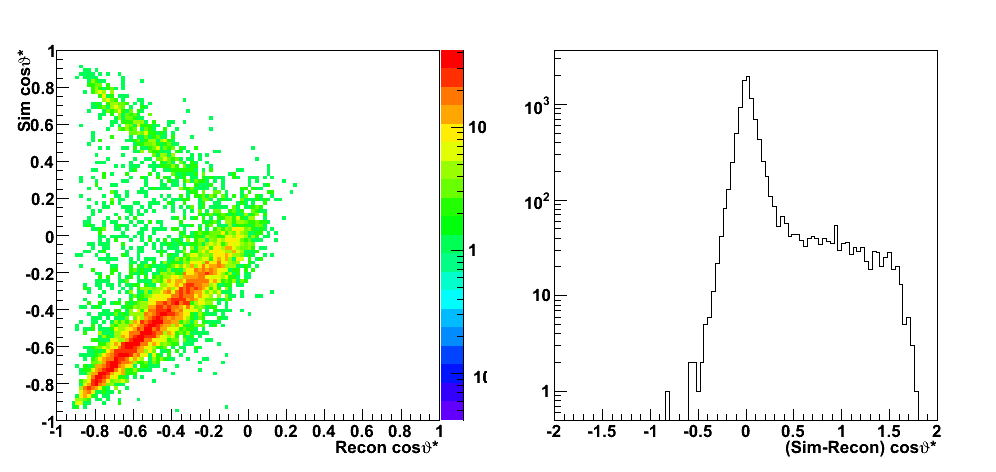
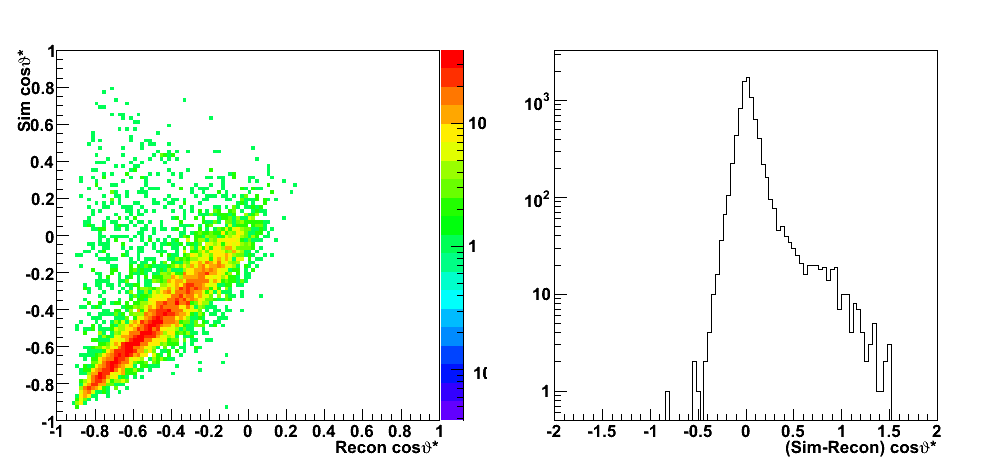
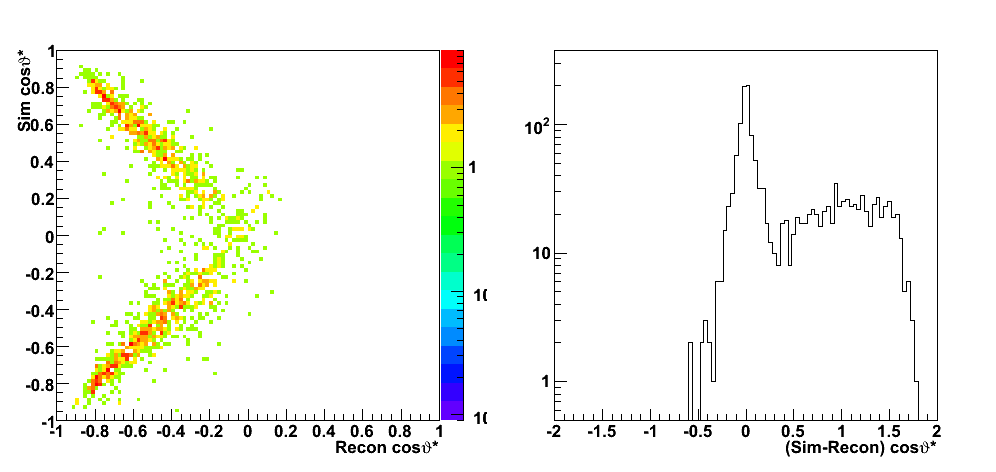
Partonic kinematics reconstruction
 |
| PartonicKinematics.C |
| Figure 10 |
 |
| Figure 11 |
 |
| Figure 12 |
 |
| Figure 13 |
 |
| Figure 14 |
 |
| Figure 15 (a) |
 |
| Figure 15 (b): quark from proton 1 (blue beam, +z direction) |
 |
| Figure 15 (c): quark from proton 1 (blue beam, +z direction) and q + g -> q + gamma subprocess (29) |
 |
| Figure 15 (d): quark from proton 1 (blue beam, +z direction) and q + qbar -> gamma + g subprocess (14) |
 |
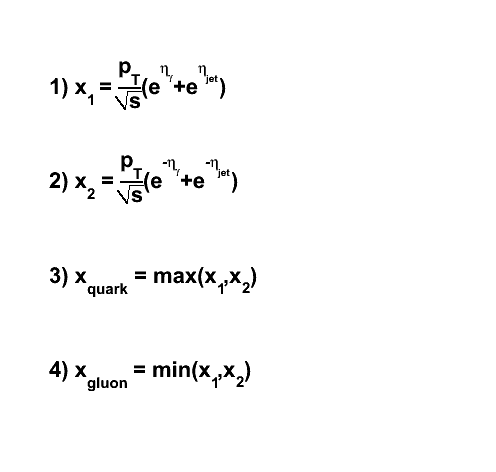
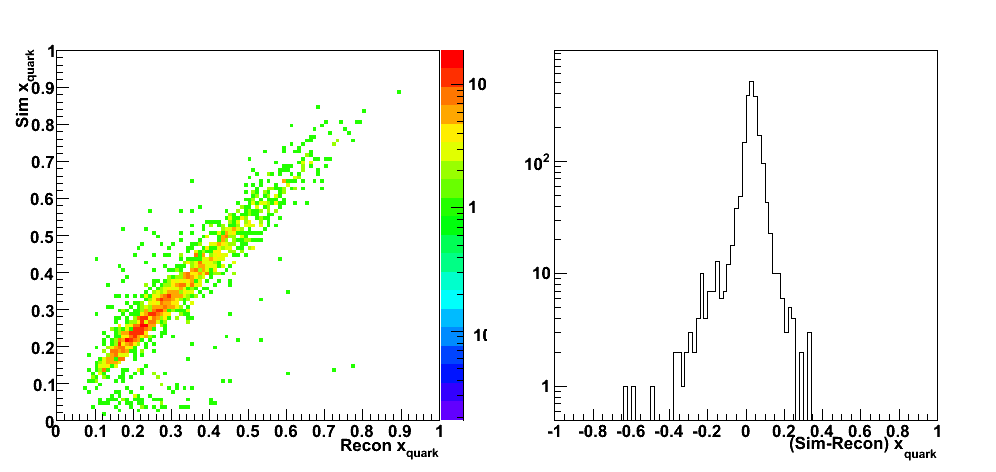
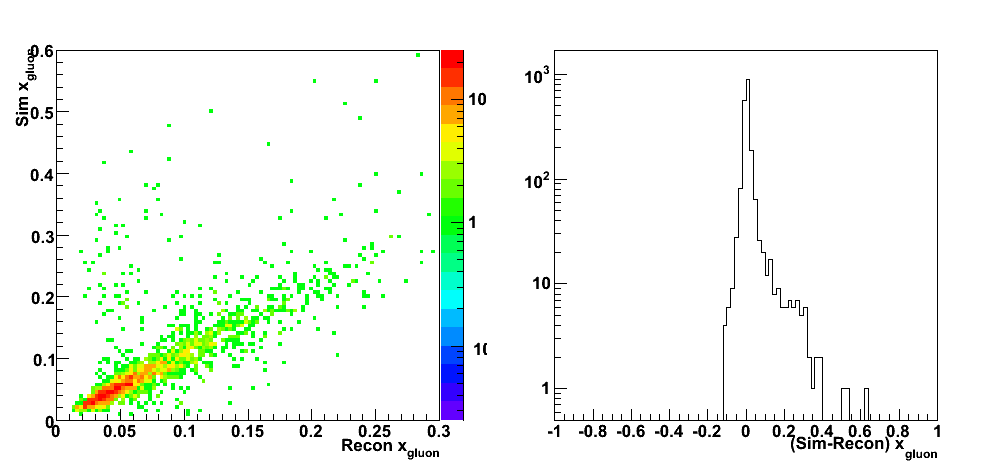
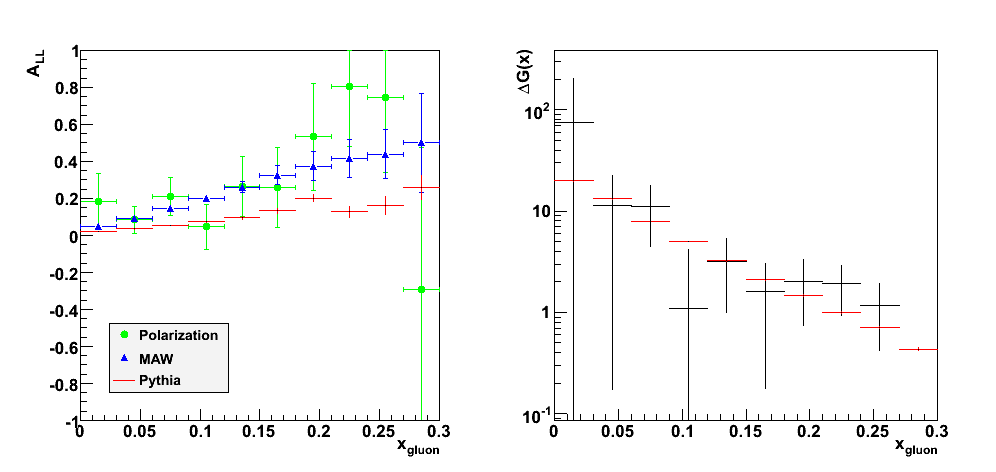
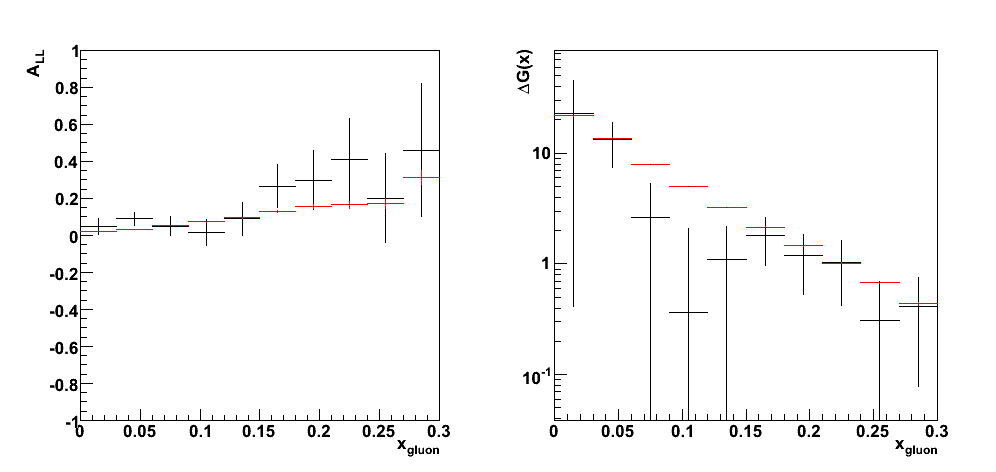
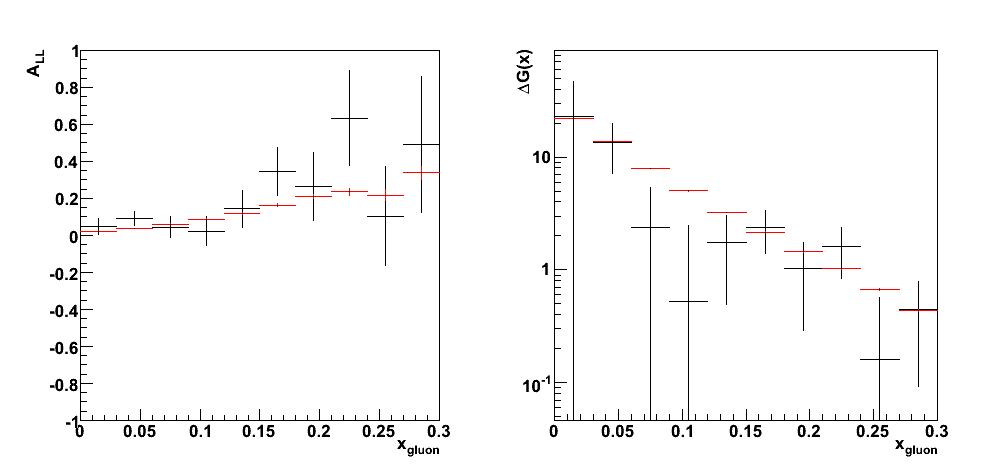
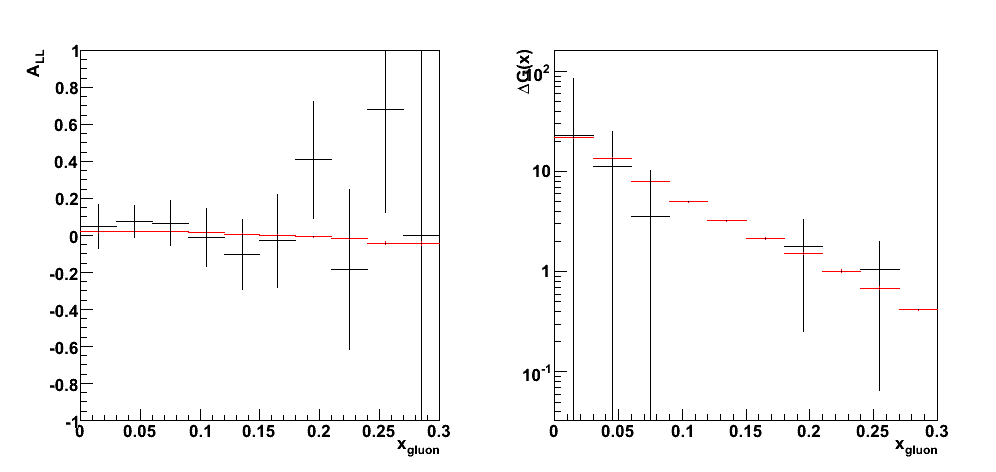
Predictions for A_LL and direct determination of DeltaG(x)
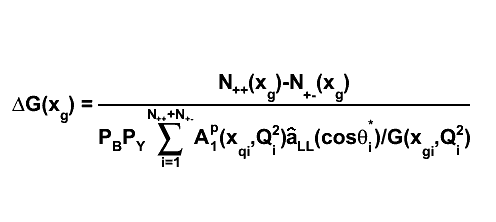 |
| DeltaG.C |
| Figure 16 (a) |
 |
| Figure 16 (b): quark from proton 1 (blue beam, +z direction) |
 |
| Figure 16 (c): quark from proton 1 (blue beam, +z direction) and q + g -> q + gamma subprocess (29) |
 |
| Figure 16 (d): quark from proton 1 (blue beam, +z direction) and q + qbar -> gamma + g subprocess (14) |
 |
References
- Appendix Simulation Studies of Direct Photon Production at STAR
- DeltaG(x,mu^2) from jet and prompt photon production at RHIC arXiv:hep-ph/0005320
Pibero Djawotho Last updated Wed Jul 16 10:29:22 EDT 2008
»
- Printer-friendly version
- Login or register to post comments