Photon-jet with the Endcap (Ilya Selyuzhenkov)
Gamma-jets
W-analysis
2008
Year 2008 posts
01 Jan
January 2008 posts
2008.01.30 Selecting gamma-jet candidates out of the jet trees
Ilya Selyuzhenkov January 30, 2008
Data set
jet trees by Murad Sarsour for pp2006 run, runId=7136022 (~60K events, no triggerId cuts yet)
Jets gross features
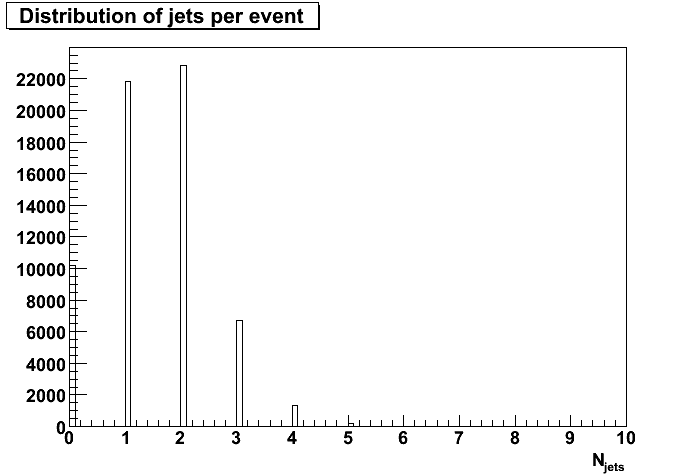
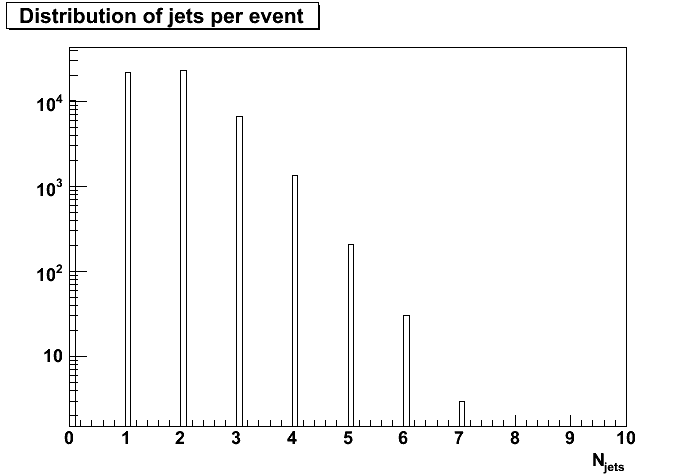
- Figure 1: Distribution of number of jets per event. Same data on a log scale is here.
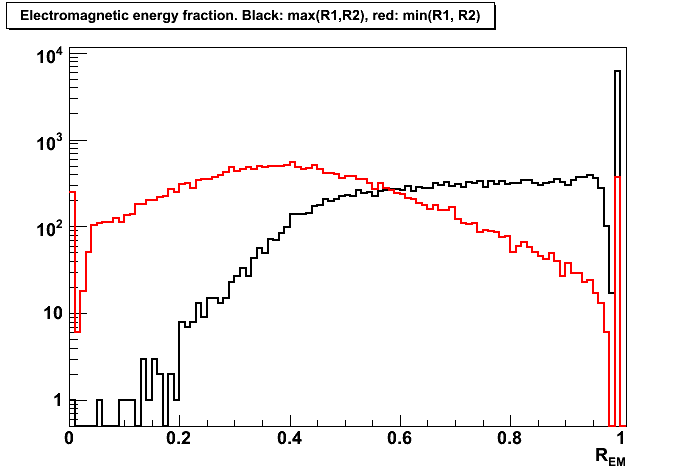
- Figure 2: Distribution of electromagnetic energy (EM) fraction, R_EM, for di-jet events (number of jets/event = 2).
R_EM = [E_t(endcap)+E_t(barrel)]/E_t(total).
Black histogram is for R_EM1 = max(Ra, Rb), red is for R_EM2 = min(Ra, Rb).
Ra and Rb are EM fraction for jets in the di-jet event.
Same data on a log scale is here.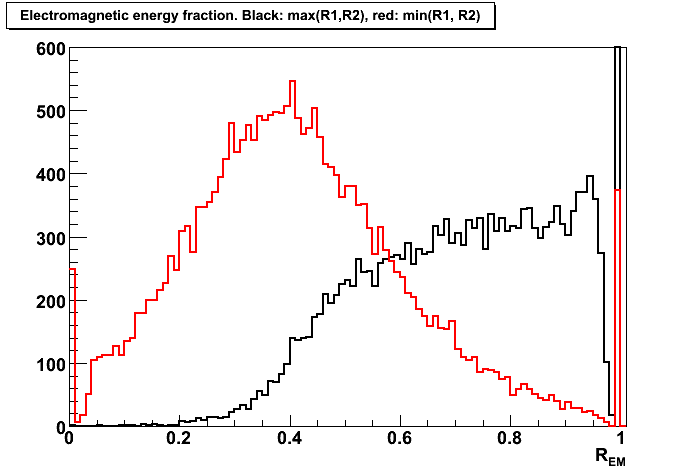
Gamma-jet isolation cuts list:
- selecting di-jet events with one of the jet dominated by EM energy,
and another one with more hadronic energy:R_EM1 >0.9 and R_EM2 < 0.9
- selecting di-jet events with jets pointing opposite in azimuth:
cos(phi1 - phi2) < -0.9
- requiring the number of associated charged tracks with a first jet (with maximum EM fraction) to be less than 2:
nChargeTracks1 < 2
- requiring the number of fired EEMC towers associated with a first jet (with maximum EM fraction) to be 1 or 2:
0 < nEEMCtowers1 < 3
Applying gamma-jet isolation cuts
- Figure 3: Distribution of eta vs number of EEMC towers for the first jet (with maximum EM fraction).
Cuts:1-3 applied (no 0 < nEEMCtowers1 < 3 cut).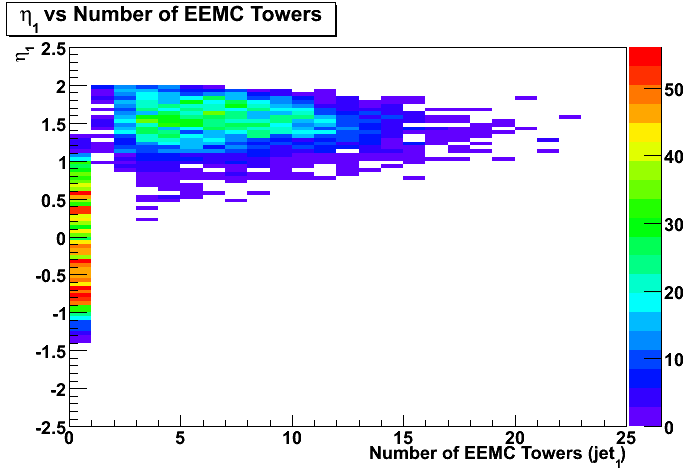
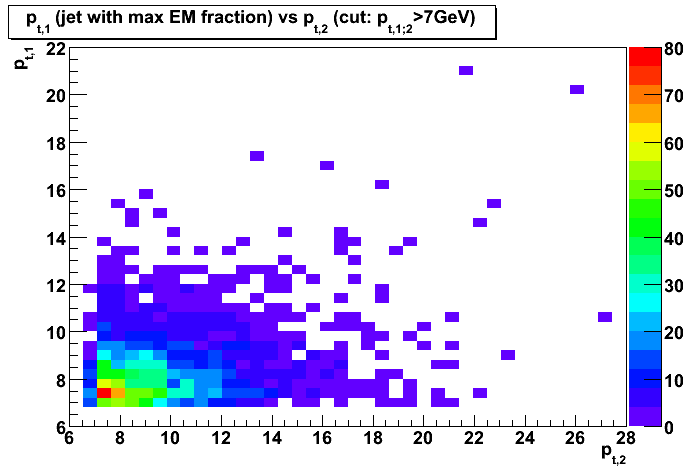
- Figure 4: Distribution of transverse momentum, pt1, of the first jet (with maximum EM fraction)
vs transverse momentum, pt2, of the second jet.
Cuts:1-4 applied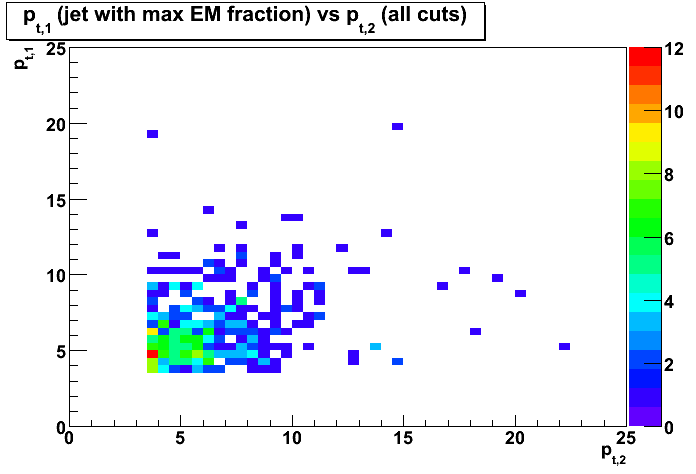
- Figure 5: Distribution of mean transverse momentum, < pt1 >, of the first jet (with maximum EM fraction)
vs transverse momentum, pt2, of the second jet.
Cuts:1-4 applied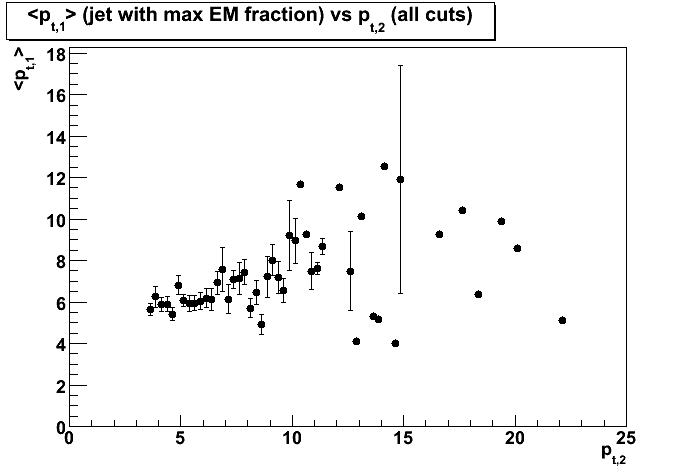
- Figure 6: Distribution of pseudorapidity, eta1, of the first jet (with maximum EM fraction)
vs pseudorapidity, eta2, of the second jet.
Cuts:1-4 applied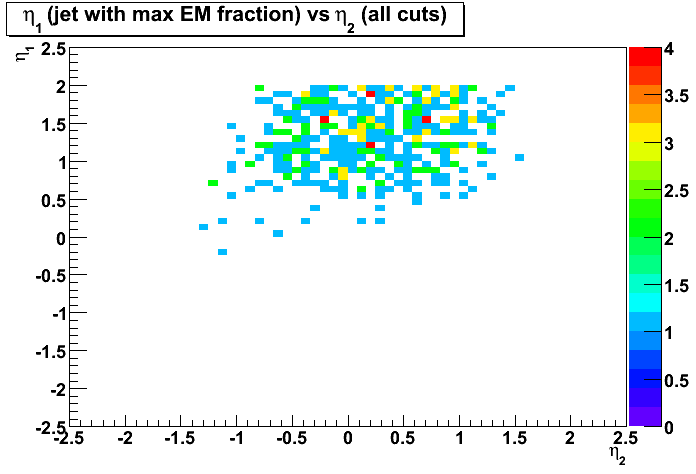
- Figure 7: Distribution of azimuthal angle, phi1, of the first jet (with maximum EM fraction)
vs azimuthal angle, phi2, of the second jet.
Cuts:1-4 applied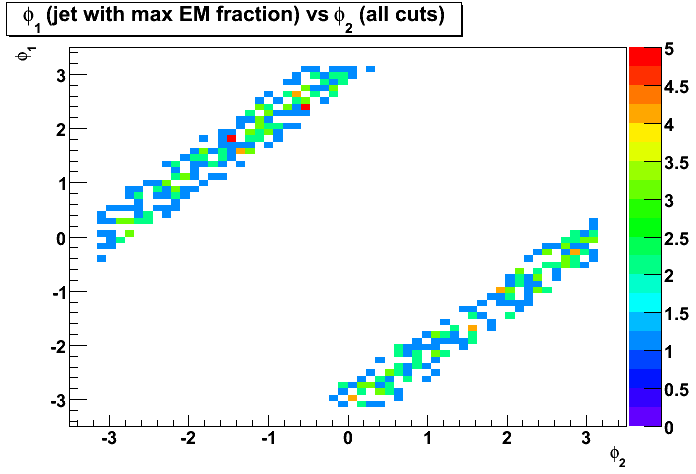
- Figure 8: Distribution of transverse momentum, pt1, of the first jet (with maximum EM fraction)
vs transverse energy sum for the EEMC towers associated with this jet.
Cuts:1-4 applied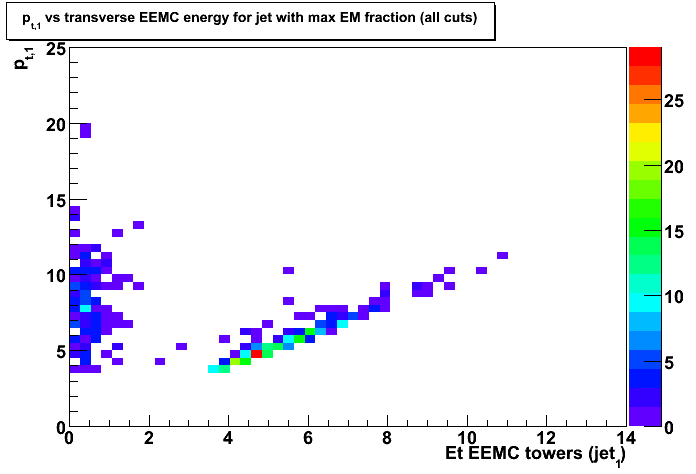
- Figure 9: Distribution of transverse momentum, pt1, of the first jet (with maximum EM fraction)
vs transverse momentum, pt2, of the second jet.
Cuts:1-4 + Et(EEMC) > 3.0 GeV
02 Feb
February 2008 posts
2008.02.13 Gamma-jet candidates: EEMC response
Ilya Selyuzhenkov February 13, 2008
Data sample
Gamma-jet selection cuts are discussed here. There are 278 candidates found for runId=7136022.
Transverse momentum distribution for the gamma-jet candidates can be found here.
Vertex z distribution for di-jet and gamma-jet events
-
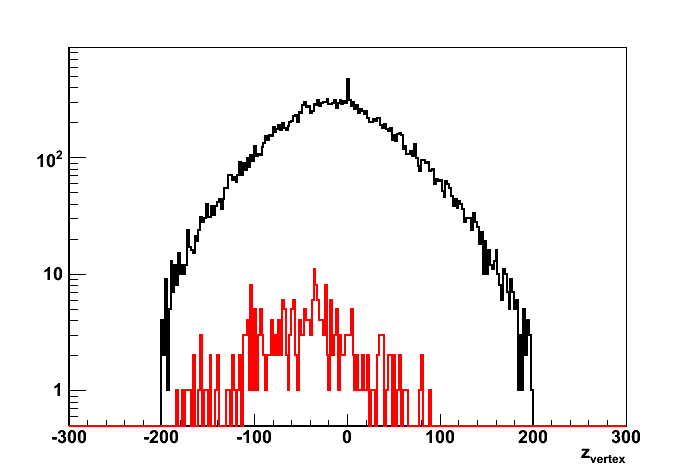
Figure 1: Vertex z distribution.
Red line presents gamma-jet candidates (scaled by x50). Black is for all di-jet events.
Same data on a log scale is here.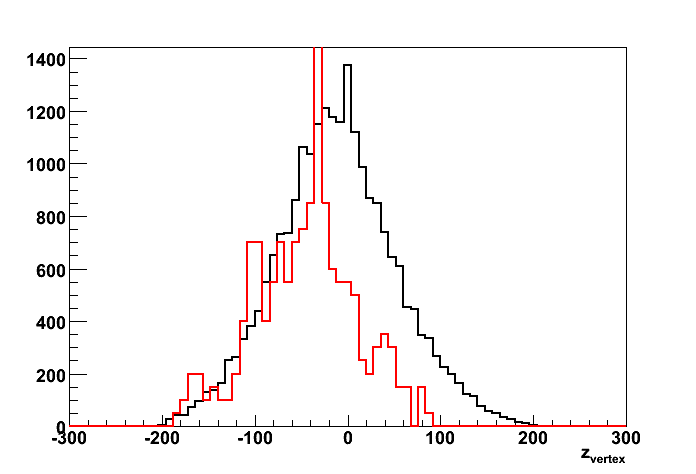
- Figure 2: Average vertex z as a function of transverse momentum of the fist jet (with a largest EM energy fraction).
Red is for gamma-jet candidates. Black is for all di-jet events.
Strong deviation from zero for gamma-jet candidates at pt < 5GeV?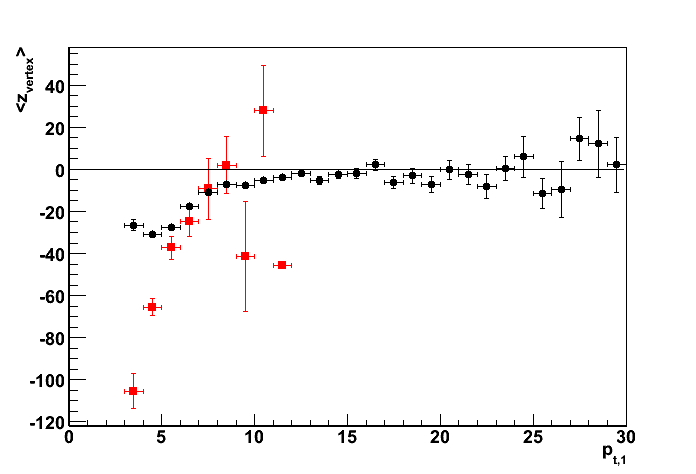
EEMC response for the gamma-jet candidate
EEMC response event by event for all 278 gamma-jet candidate can be found in this pdf file.
Each page shows SMD/Tower energy distribution for a given event:
-
First row on each page shows SMD response
for the sector which has a maximum energy deposited in the EEMC Tower
(u-plane is on the left, v-plane is on the right). -
In the left plot (u-plane energy distribution) numerical values for
pt of the first jet (with maximum EM fraction) and the second jet are given. -
In addition, fit results assuming gamma (single Gaussian, red line) or
neutral pion (double Gaussian, blue line ~ red+green) hypotheses are given. - m_{gamma gamma} value (it is shown in the right plot for v-plane).
If m_{gamma gamma} value is negative, then the reconstruction procedure has failed
(for example, no uv-strips intersection found, or tower energy and uv-strips intersection point mismatch, etc).
EEMC response for these "bad" events can be found in this pdf file.If reconstruction procedure succeded, then
m_{gamma gamma} gives reconstructed invariant mass assuming that two gammas hit the calorimeter.Figure 3: invariant mass distribution (assuming pi0 hypothesis).
Note, that I'm still working on my fitting algorithm (which is not explained here),
and fit results and the invariant mass distribution will be updated.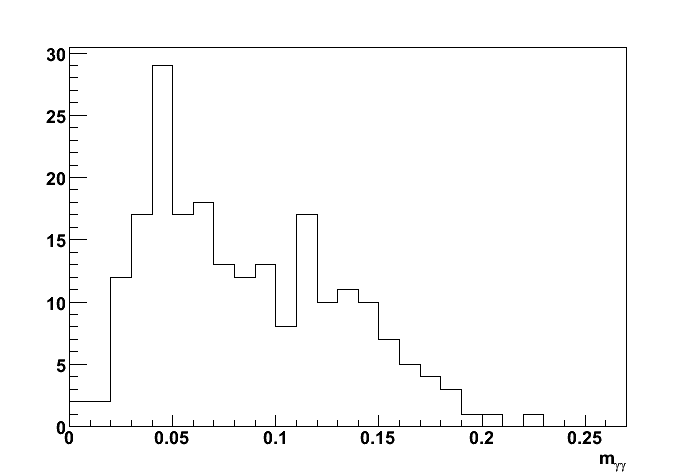
-
It is also shown the ratio for each u/v plane
of the integrated single Gaussian fit (red line) to the total energy in the plane
(look for "gamma U/V " values on the right v-plane plot). -
Second and third rows on each page show the energy deposition in the
tower, pre-shower1, pre-shower2, and post-shower as a function of eta:phi (etaBin:phiBin). - Last row shows the hit distribution in the SMD for all sectors
(u-plane on the left, v-plane of the right).
Playing with a different cuts
Trying to isolate the real gammas which hits the calorimeter,
I have sorted events into different subsets based on the following set of cuts:
- EEMC gamma-jet cuts (energetic photon hits EEMC with pt similar or greater to that of the opposite jet)
if (invMass < 0) reject
if (jet2_pt > jet1_pt) reject
if (jet1_pt < 7) reject
if (minFraction < 0.75) reject
(minFraction = gamma U/V - is a fraction of the integrated single Gaussian peak to the total energy in the uv-plane)Figure 4: Sample gamma-jet candidate EEMC response
(all gamma-jet candidates selected according to these conditions can be found in this pdf file):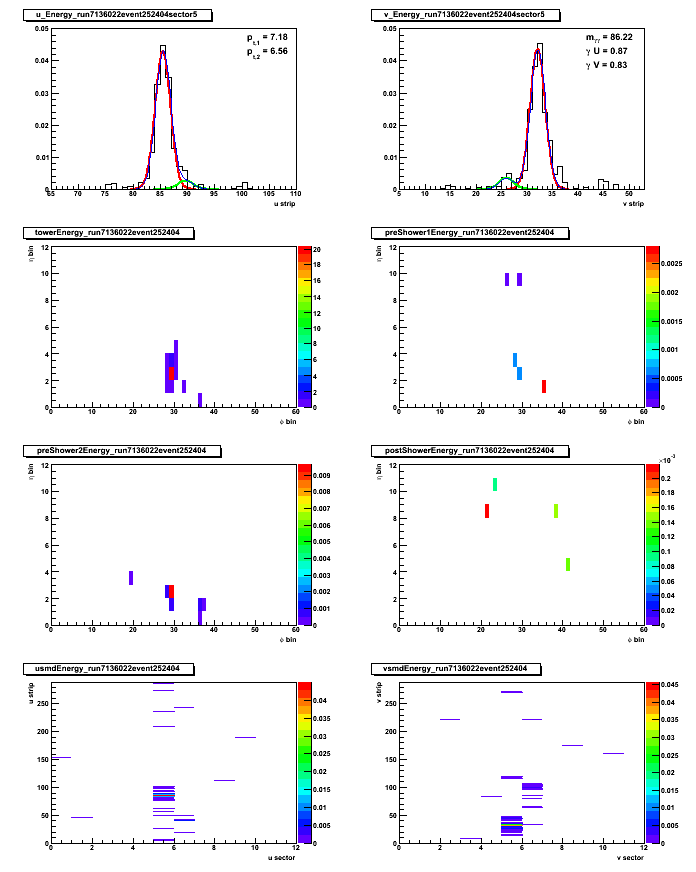
- EEMC pi0 cuts:
if (invMass < 0) reject
if (jet2_pt < jet1_pt) reject
if (jet2_pt < 7) reject
if (minFraction < 0.75) rejectEvent by event EEMC response for pi0 (di-jet) candidates
selected according to these conditions can be found in this pdf file.
2008.02.20 Gamma-jet candidates: more statistics from jet-trees
Ilya Selyuzhenkov February 20, 2008
Short summary
After processing all available jet-trees for pp2006 (ppProductionLong),
and applying all "gamma-jet" cuts (which are described below):
-
there are 47K di-jet events selected
-
for pt1>7GeV there are 5,4K gamma-jet candidates (3,7K with an additional cut of pt1>pt2)
-
Figure 1: 2,4K events with both pt1, pt2 > 7GeV
-
721 candidates within a range of pt1>pt2 and both pt1, pt2 > 7 GeV
Data set
jet trees by Murad Sarsour for pp2006 run, number of runs processed: 323
4.7M di-jet events found (no triggerId cuts yet)
Di-jets gross features
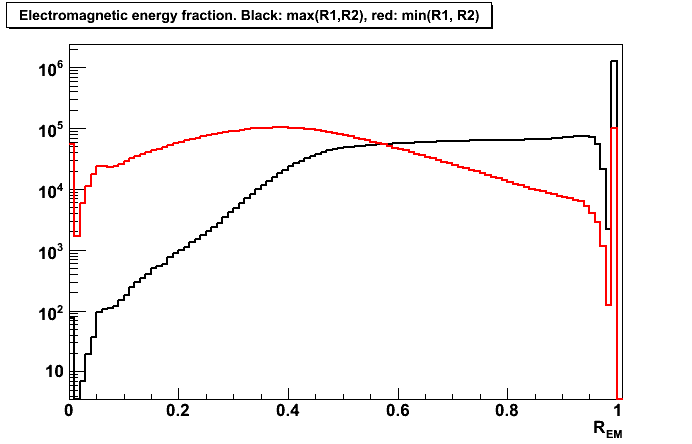
- Figure 2: Distribution of electromagnetic energy (EM) fraction, R_EM, for di-jet events (number of jets/event = 2).
R_EM = [E_t(endcap)+E_t(barrel)]/E_t(total).
Black histogram is for R_EM1 = max(Ra, Rb), red is for R_EM2 = min(Ra, Rb).
Ra and Rb are EM fraction for jets in the di-jet event.
Same data on a log scale is here.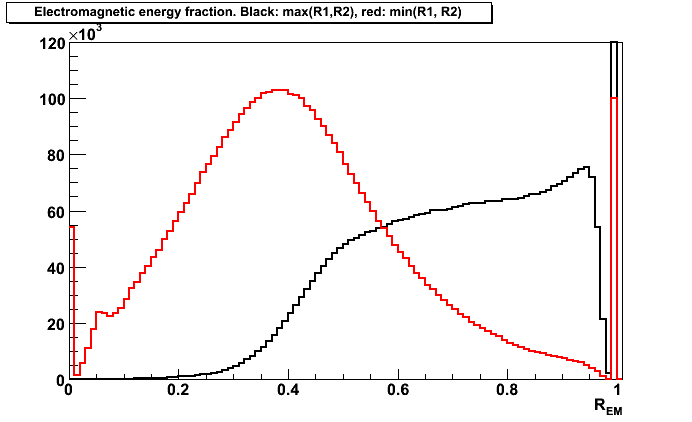
Gamma-jet isolation cuts:
- selecting di-jet events with one of the jet dominated by EM energy,
and another one with more hadronic energy:R_EM1 >0.9 and R_EM2 < 0.9
- selecting di-jet events with jets pointing opposite in azimuth:
cos(phi1 - phi2) < -0.9
- requiring the number of associated charged tracks with a first jet (with maximum EM fraction) to be less than 2:
nChargeTracks1 < 2
- requiring the number of fired EEMC towers associated with a first jet (with maximum EM fraction) to be 1 or 2:
0 < nEEMCtowers1 < 3
Applying gamma-jet isolation cuts
- Figure 3: Distribution of eta vs number of EEMC towers for the first jet (with maximum EM fraction).
Cuts:1-3 applied (no 0 < nEEMCtowers1 < 3 cut).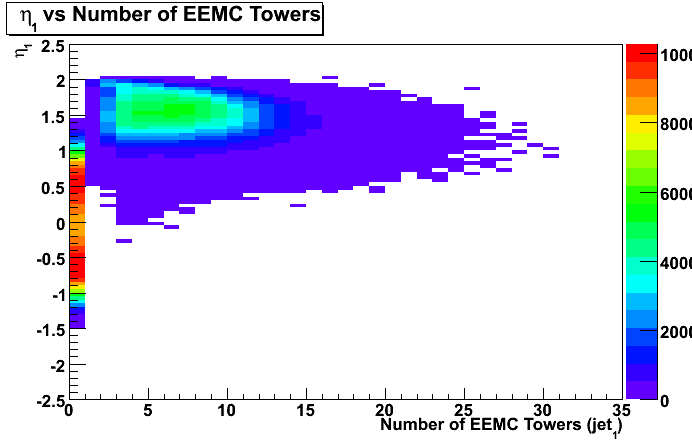
- Figure 4: Distribution of transverse momentum, pt1, of the first jet (with maximum EM fraction)
vs transverse momentum, pt2, of the second jet.
Cuts:1-4 applied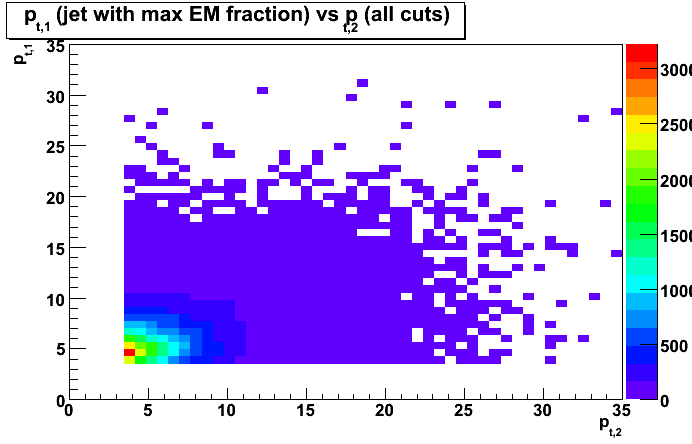
- Figure 5: Distribution of mean transverse momentum, < pt1 >, of the first jet (with maximum EM fraction)
vs transverse momentum, pt2, of the second jet.
Cuts:1-4 applied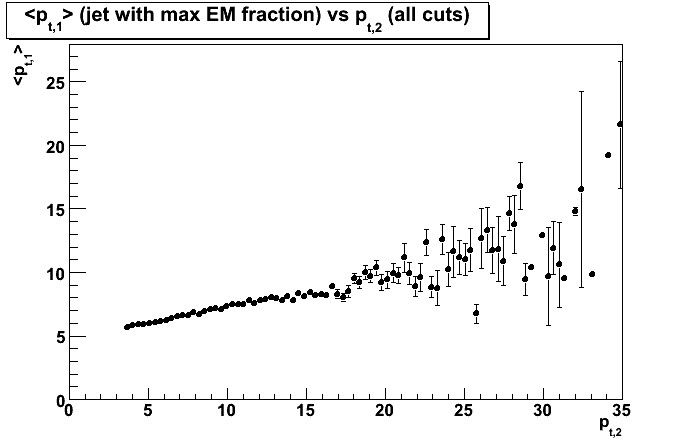
- Figure 6: Distribution of pseudorapidity, eta1, of the first jet (with maximum EM fraction)
vs pseudorapidity, eta2, of the second jet.
Cuts:1-4 applied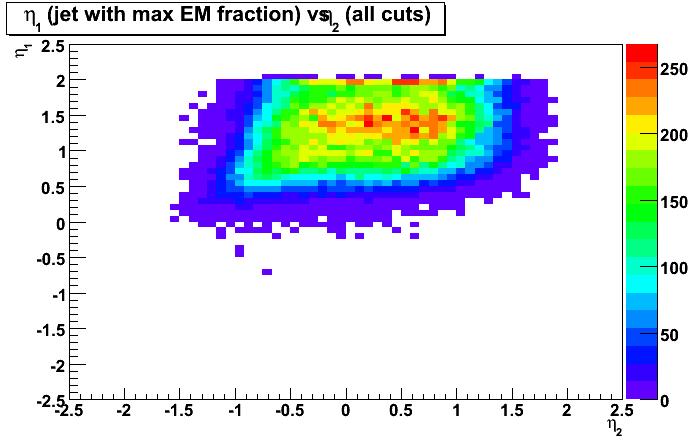
- Figure 7: Distribution of azimuthal angle, phi1, of the first jet (with maximum EM fraction)
vs azimuthal angle, phi2, of the second jet.
Cuts:1-4 applied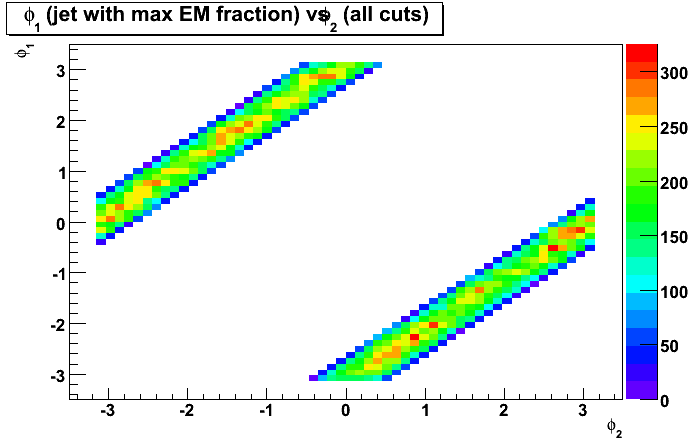
- Figure 8: Distribution of transverse momentum, pt1, of the first jet (with maximum EM fraction)
vs transverse energy sum for the EEMC towers associated with this jet.
Cuts:1-4 applied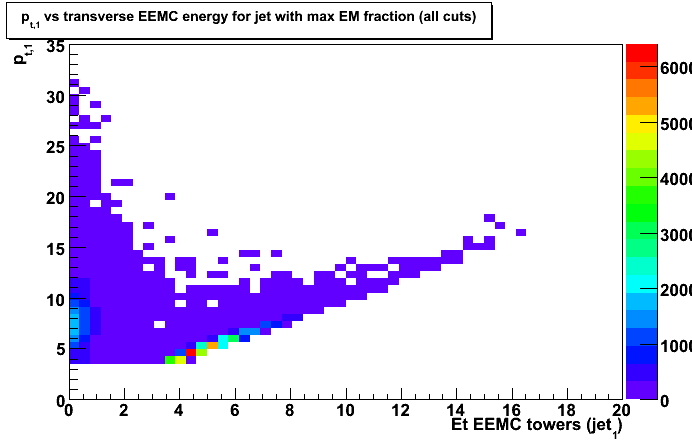
- Figure 9: Distribution of transverse momentum, pt1, of the first jet (with maximum EM fraction)
vs transverse momentum, pt2, of the second jet.
Cuts:1-4 + Et(EEMC) > 3.0 GeV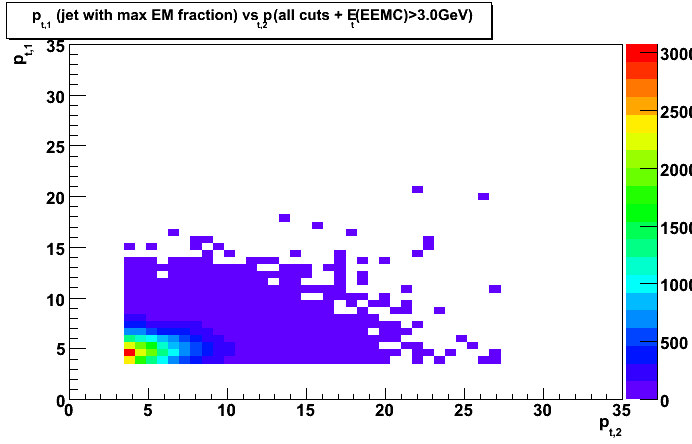
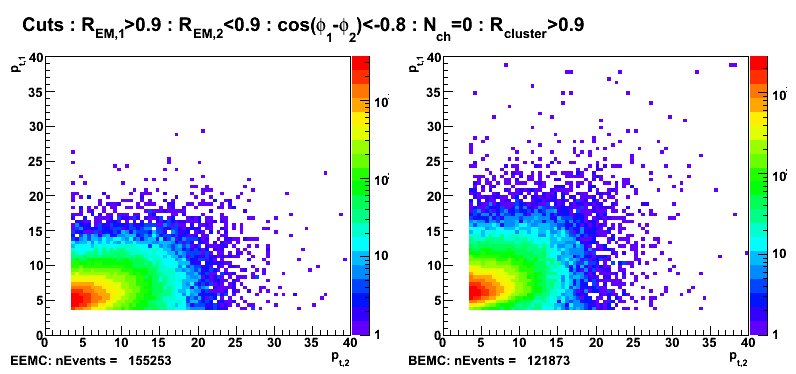
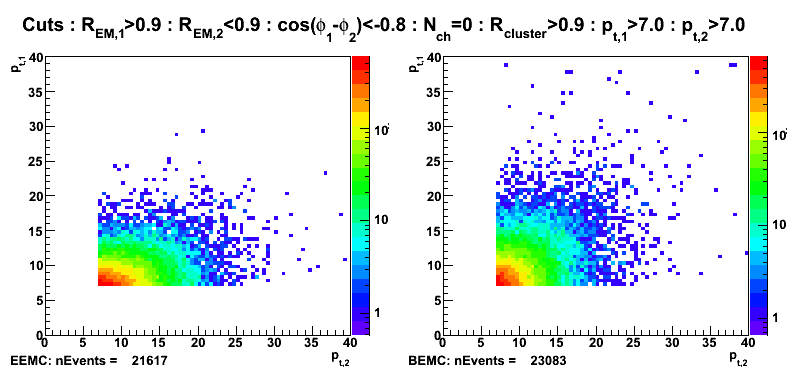
2008.02.27 Tower based clustering algorithm, and EEMC/BEMC candidates
Ilya Selyuzhenkov February 27, 2008
Gamma-jet candidates before applying clustering algorithm
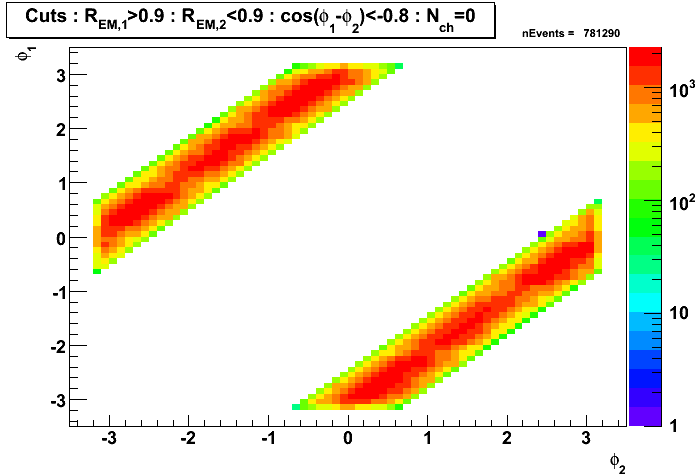
Gamma-jet isolation cuts:
- selecting di-jet events with the first jet dominated by EM energy,
and the second one with a large fraction of hadronic energy:R_EM1 >0.9 and R_EM2 < 0.9
- selecting di-jet events with jets pointing opposite in azimuth:
cos(phi1 - phi2) < -0.8
- requiring no charge tracks associated with a first jet (jet with a maximum EM fraction):
nCharge1 = 0
Figure 1: Transverse momentum
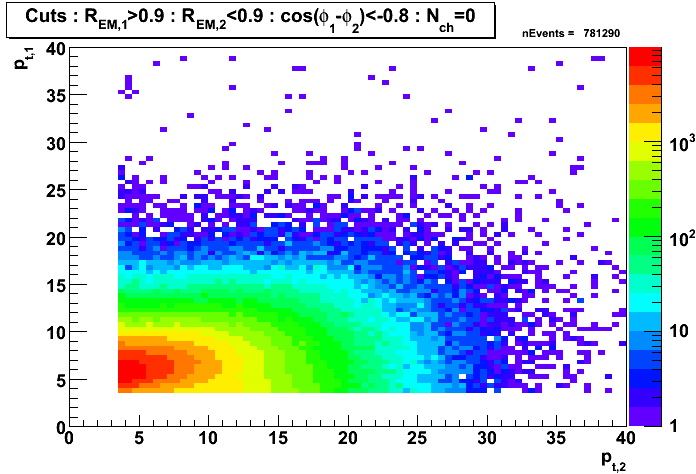
Figure 2: Pseudorapidity
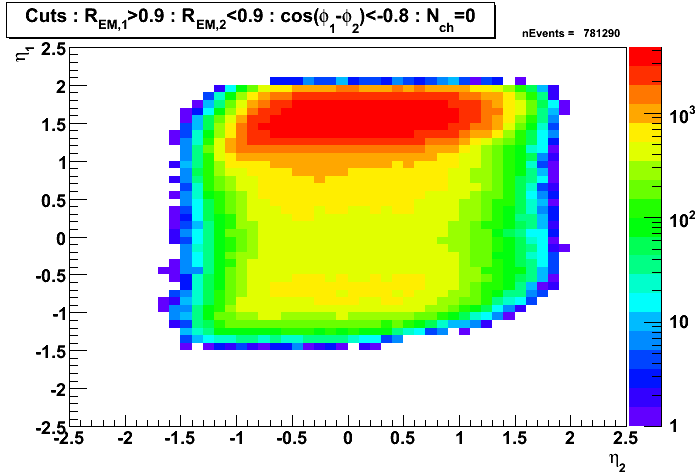
Figure 3: Azimuthal angle
Tower based clustering algorithm
-
for each gamma-jet candidate finding a tower with a maximum energy
associated with a jet1 (jet with a maximum EM fraction). -
Calculating energy of the cluster by finding all adjacent towers and adding their energy together.
- Implementing a cut based on cluster energy fraction, R_cluster, where
R_cluster is defined as a ratio of the cluster energy
to the total energy in the calorimeter associated with a jet1.
Note, that with a cut Ncharge1 =0, energy in the calorimeter is equal to the jet energy.
Distribution of cluster energy vs number of towers fired in EEMC/BEMC
Figure 4: R_cluster vs number of towers fired in EEMC (left) and BEMC (right). No pt cuts.
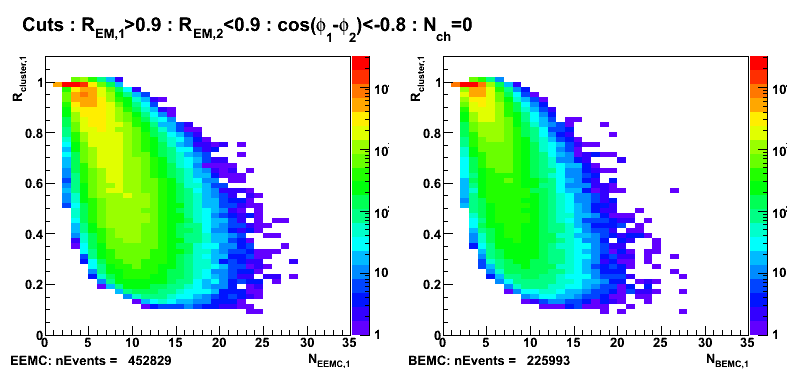
Figure 5: R_cluster vs number of towers fired in EEMC (left) and BEMC (right). Additional cut: pt1>7GeV
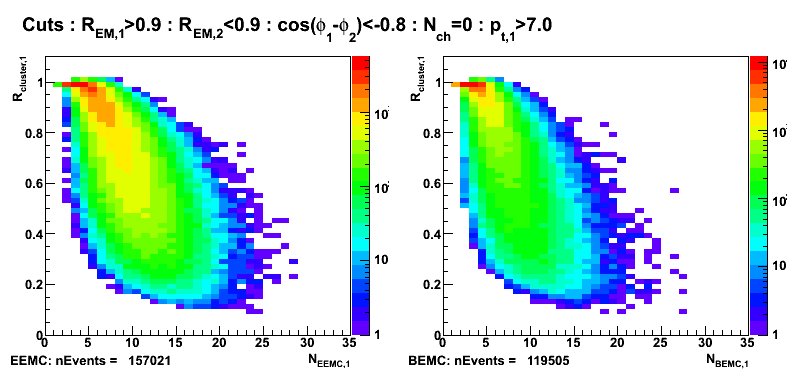
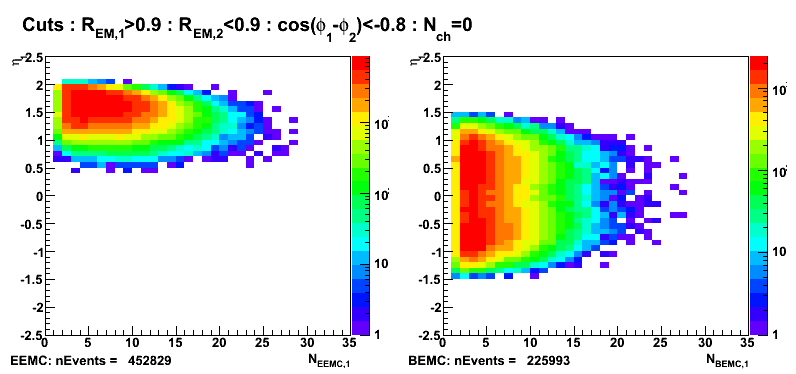
Figure 6: jet1 pseudorapidity vs number of towers fired in EEMC (left) and BEMC (right).
R_cluster>0.9 cut: EEMC vs BEMC gamma-jet candidates
EEMC candidates: nTowerFiredBEMC=0
BEMC candidates: nTowerFiredEEMC=0
Figure 7: Pseudorapidity (left EEMC, right BEMC candidates)
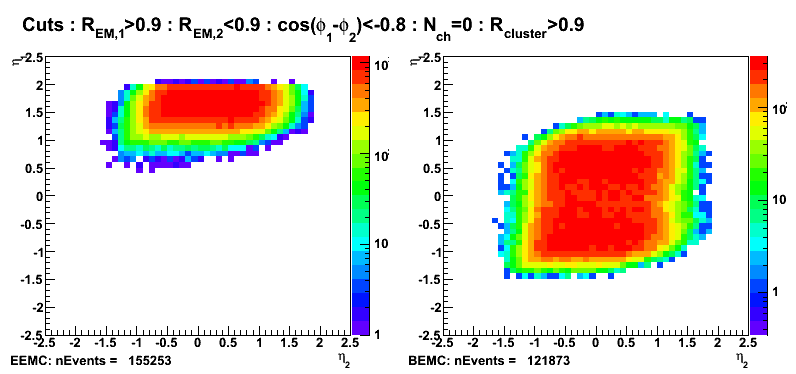
Figure 8: Azimuthal angle (left EEMC, right BEMC candidates)
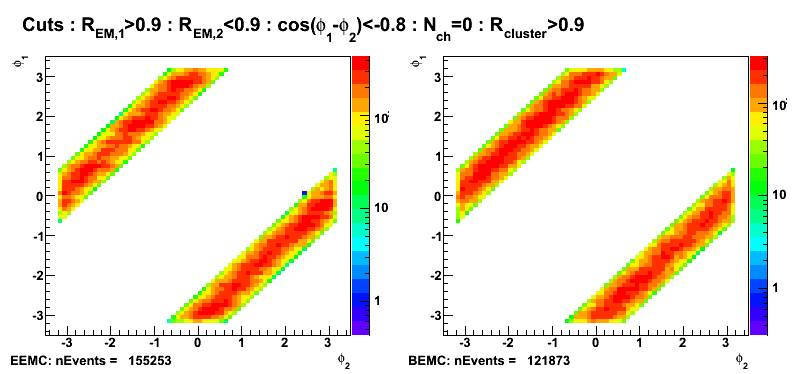
Figure 9: Transverse momentum (left EEMC, right BEMC candidates)
Number of gamma-jet candidates with an addition pt cuts
Figure 10: Transverse momentum (left EEMC, right BEMC candidates): pt1>7GeV
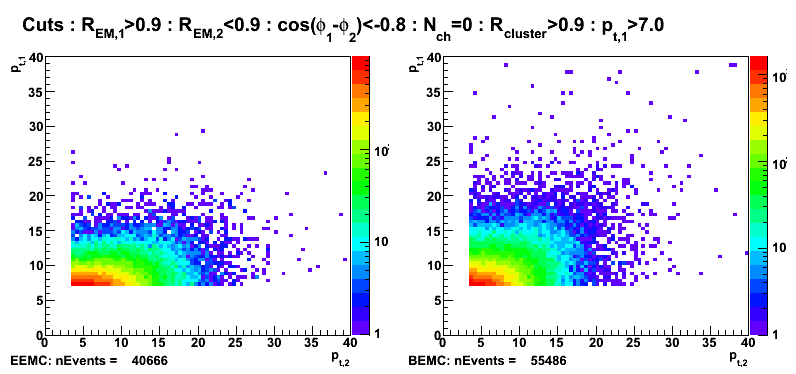
Figure 11: Transverse momentum (left EEMC, right BEMC candidates): pt1>7 and pt2>7
03 Mar
March 2008 posts
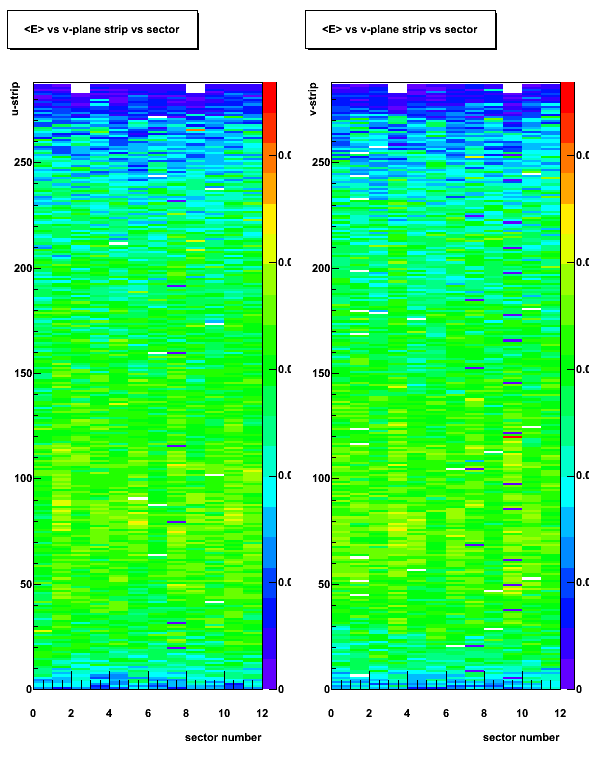
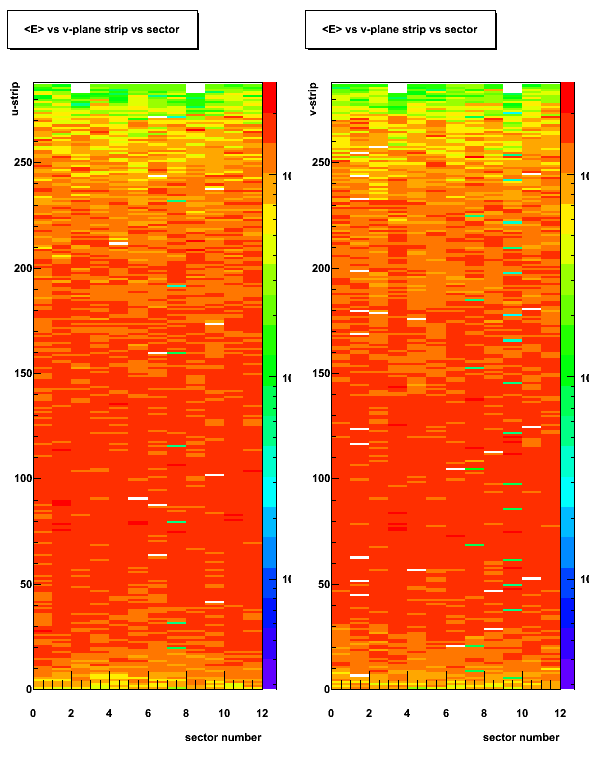
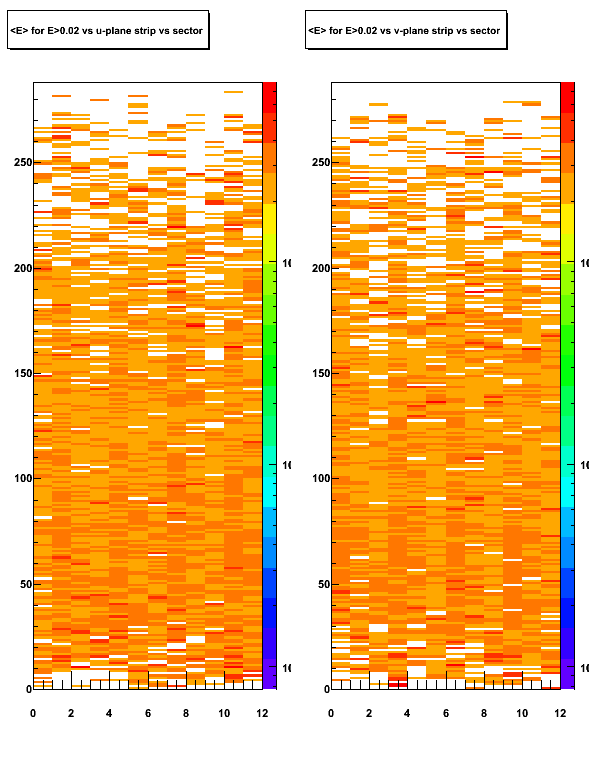
2008.03.03 EEMC SMD: u/v-strip energy distribution
Ilya Selyuzhenkov March 03, 2008
Data set: ppLongitudinal, runId = 7136033.
Some observations/questions:
-
In general distributions look clean and good
-
Sectors 7 and 9 for v-plane and sector 7 for u-plane are noise.
-
Sector 9 has a hot strip (id ~ 120)
-
In sector 3, strips id=0-5 in v-plane are hot (see figure 2 right, bottom)
-
Sectors 2 and 8 in u-plane and sectors 3 and 9 in v-plane have missing strips id=283-288?
-
Strips 288 are always empty?
Figure 1:Average energy E in the strip vs sector and strip number (max < E > = 0.0027)
same figure on a log scale
Figure 2: Average energy E for E>0.02 (max < E > = 0.0682)
Same figure on a log scale
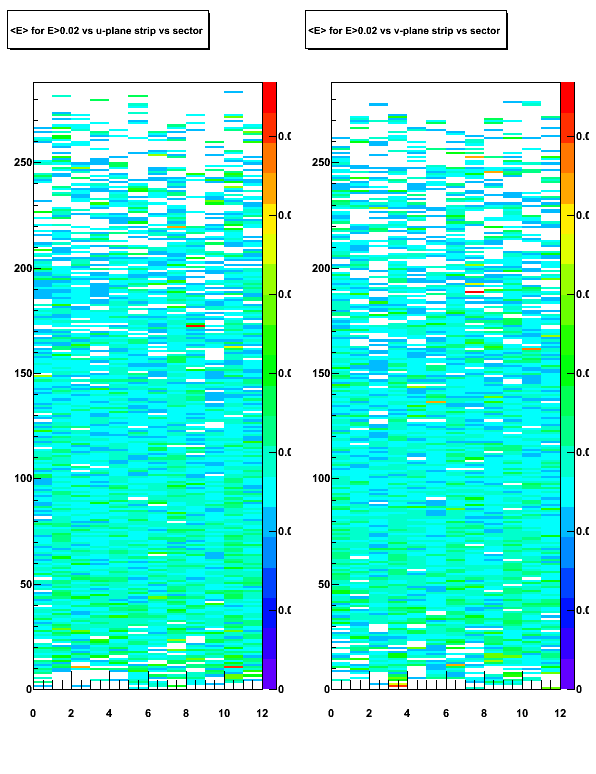
2008.03.12 Gamma-jet candidates: 2-gammas invariant mass and Eemc response
Ilya Selyuzhenkov March 12, 2008
Gamma-jet candidates: 2-gammas invariant
Note: Di-jet transverse momentum distribution for these candidates can be found on figure 11 at this page
Figure 1:Invariant mass distribution for gamma-jet candidates assuming pi0 (2-gammas) hypothesys
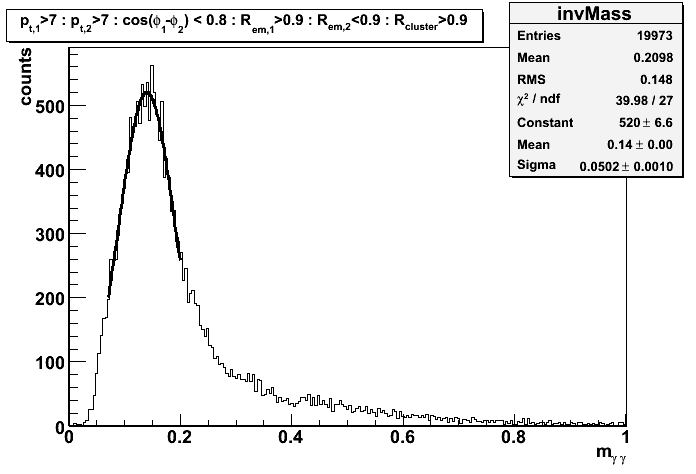
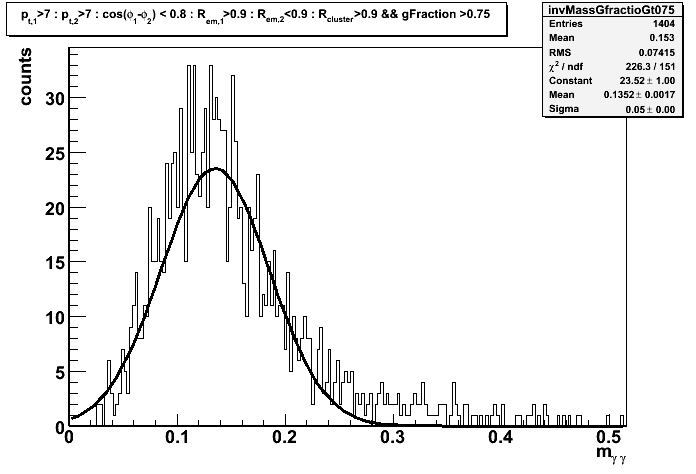
Figure 2:Invariant mass distribution for gamma-jet candidates assuming pi0 (2-gammas) hypothesys
with an additional SMD isolation cut: gammaFraction >0.75
GammaFraction is defined as ratio of the integral
other SMD strips for the first peak to the total energy in the sector
EEMC response for the gamma-jet candidates (gammaFraction >0.75)
-
pdf file (first 100 events) with event by event EEMC response for the candidates reconstructed into pion mass (gammaFraction >0.75)
-
pdf file with event by event EEMC response for the candidates not reconstructed into pion mass
(second peak not found), but has a first peak with gammaFraction >0.75.
2008.03.20 Sided residual and chi2 distribution for gamma-jet candidates
Ilya Selyuzhenkov March 20, 2008
Side residual (no pt cut on gamma jet-candidates)
The procedure to discriminate gamma candidate from pions (and other background)
based on the SMD response is described at Pibero's web page.
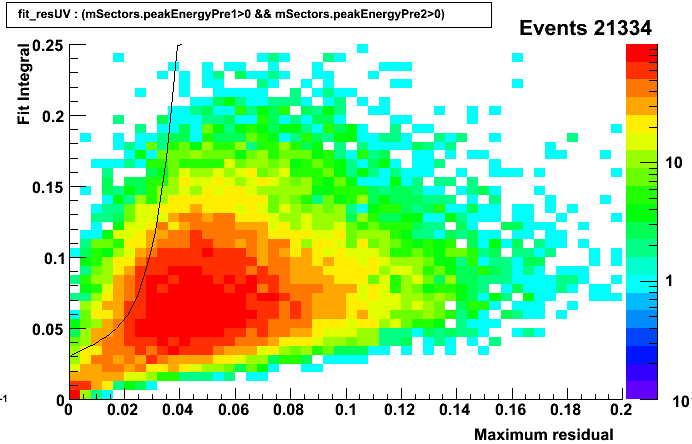
Figure 1: Fit integral vs maximum residual for gamma-jet candidates requesting
no energy deposited in the EEMC pre-shower 1 and 2
(within a 3x3 clusters around tower with a maximum energy).
Black line is defined from MC simulations (see Jason's simulation web page, or Pibero's page above).
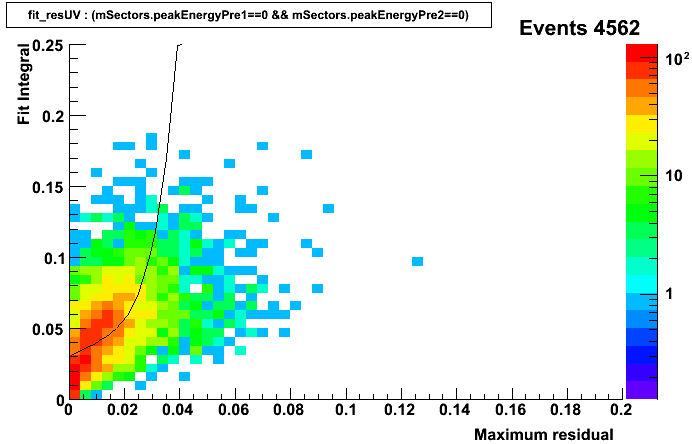
Figure 2: Fit integral vs maximum residual for gamma-jet candidates requesting requesting
no energy deposited in pre-shower 1 cluster and
no energy deposited in post-shower cluster (this cut is not really essential in demonstrating the main idea)
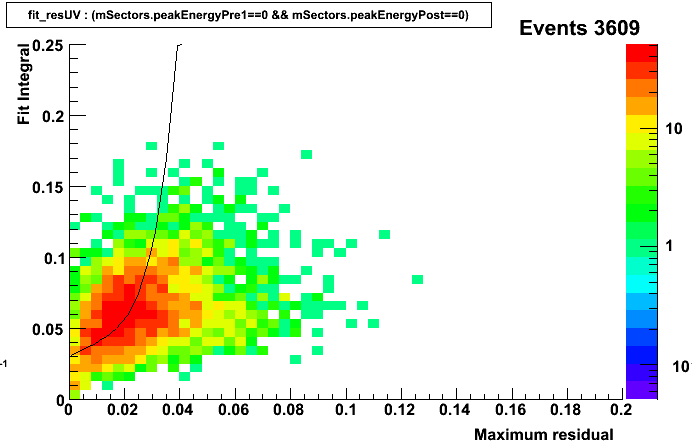
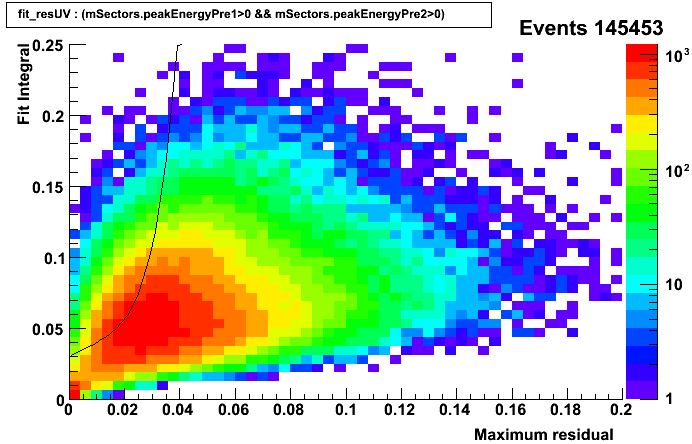
Figure 3: Fit integral vs maximum residual for gamma-jet candidates requesting requesting
non-zero energy deposited in both clusters of pre-shower 1 and 2
Side residual: first and second jet pt are greater than 7GeV
Event by event EEMC response for gamma-jet candidates for the case of
no energy deposited in the EEMC pre-shower 1 and 2 can be found in this pdf file
Figure 4: Fit integral vs maximum residual for gamma-jet candidates requesting
no energy deposited in the EEMC pre-shower 1 and 2
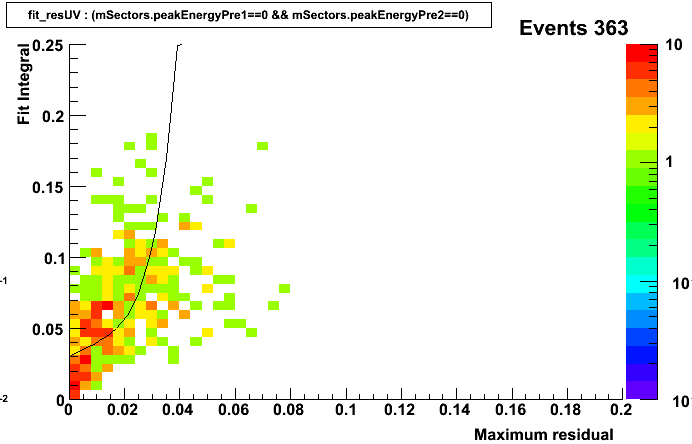
Figure 5: Fit integral vs maximum residual for gamma-jet candidates requesting requesting
no energy deposited in pre-shower 1 cluster and
no energy deposited in post-shower cluster
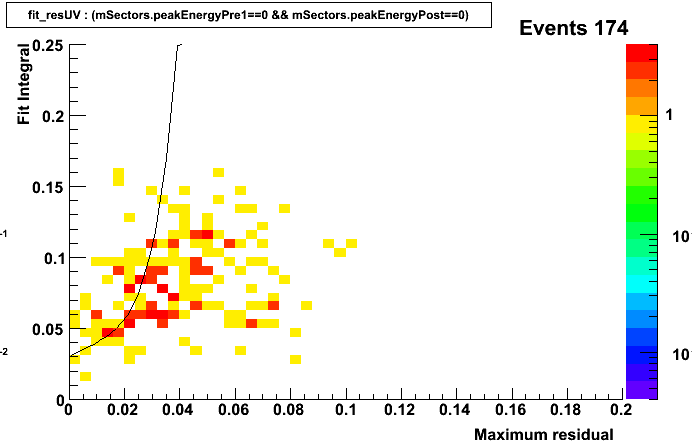
Figure 6: Fit integral vs maximum residual for gamma-jet candidates requesting requesting
non-zero energy deposited in both clusters of pre-shower 1 and 2
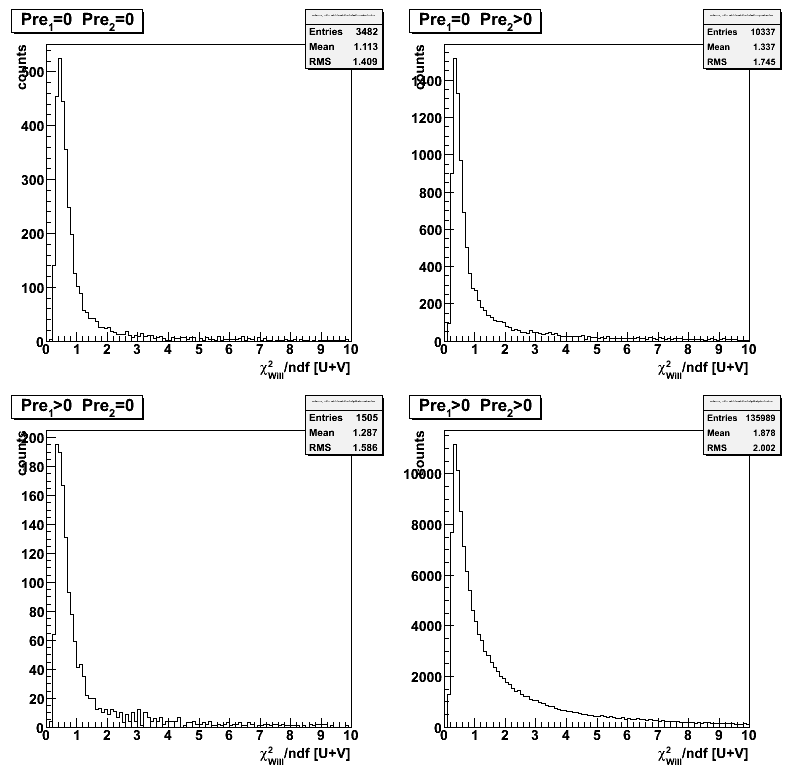
Chi2 distribution for gamma-jet candidates
Monte Carlo shape
Event Monte Carlo shape allows to distinguish gammas from background by cutting at chi2/ndf < 0.5
(although the distribution looks wider than for the case of Will's shape).
Figure 7: Chi2/ndf for gamma-jet candidates using Monte Carlo shape requesting
no energy deposited in both clusters of pre-shower 1 and 2
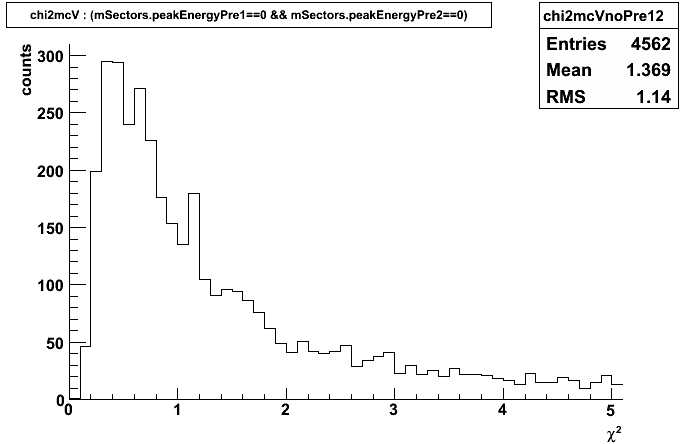
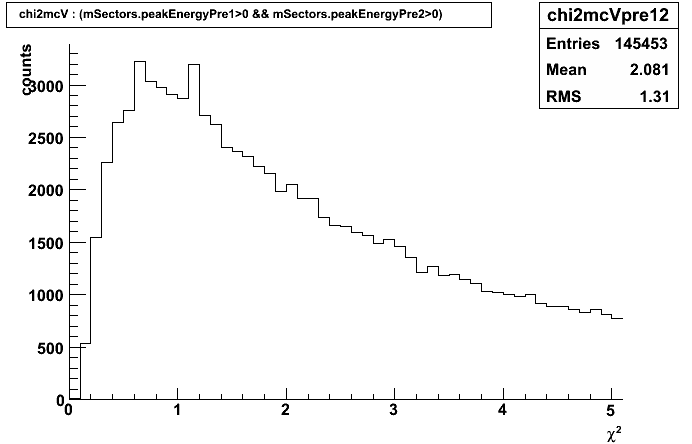
Figure 8: Chi2/ndf for gamma-jet candidates using Monte Carlo shape requesting
non-zero energy deposited in both clusters of pre-shower 1 and 2
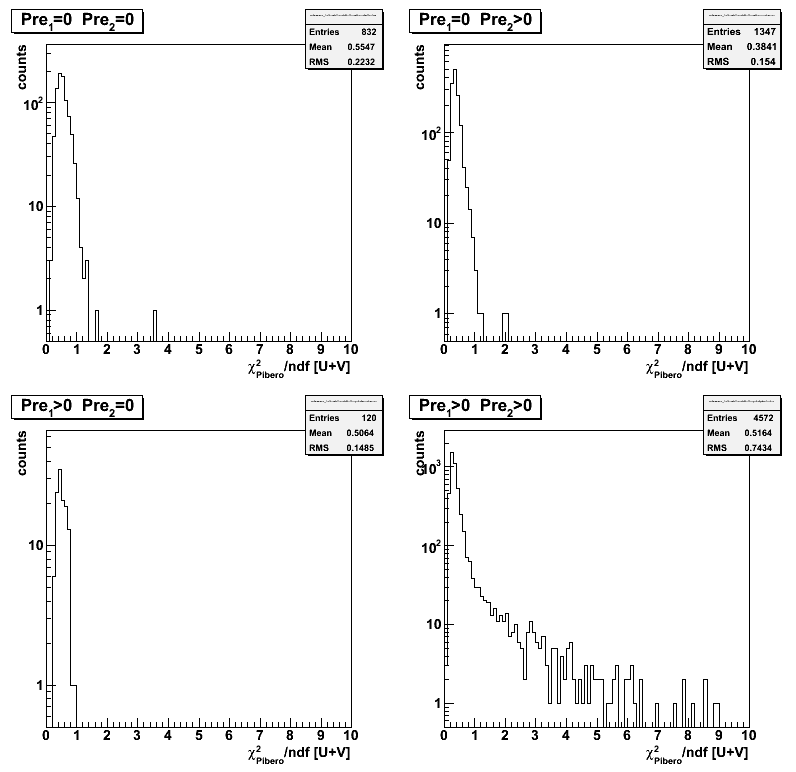
Will''s shape
Less clear where to cut on chi2?
Figure 9: Chi2/ndf for gamma-jet candidates using Monte Carlo shape requesting
no energy deposited in both clusters of pre-shower 1 and 2
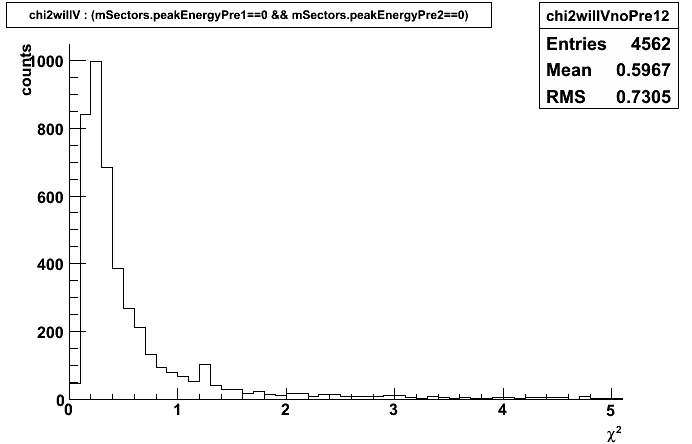
Figure 10: Chi2/ndf for gamma-jet candidates using Monte Carlo shape requesting
non-zero energy deposited in both clusters of pre-shower 1 and 2
2008.03.26 Sided residual and chi2 distribution for gamma-jet candidates (pre1,2 sorted)
Ilya Selyuzhenkov March 26, 2008
gamma-jet candidates (no pt cut)
Definitions:
- F_peak - integral for a fit within [-2,2] strips around SMD u/v peak
- D_peak - integral over the data within [-2,2] strips around SMD u/v peak
- D_tail^max (D_tail^min) - maximum (minimum) integral over the data tail within +-[3,30] strips from a SMD u/v peak
- F_tail is the integral over the fit tail within [3,30] strips from a SMD u/v peak.
- Maximum residual = D_tail^max - F_tail
All results are for combined distributions from u and v planes: ([u]+[v])/2
Gamma-jet isolation cuts described here
Additional quality cuts:
- Matching between 3x3 tower cluster and u-v high strip intersection
- At least 4 strips fired within [-2,2] strips from a peak
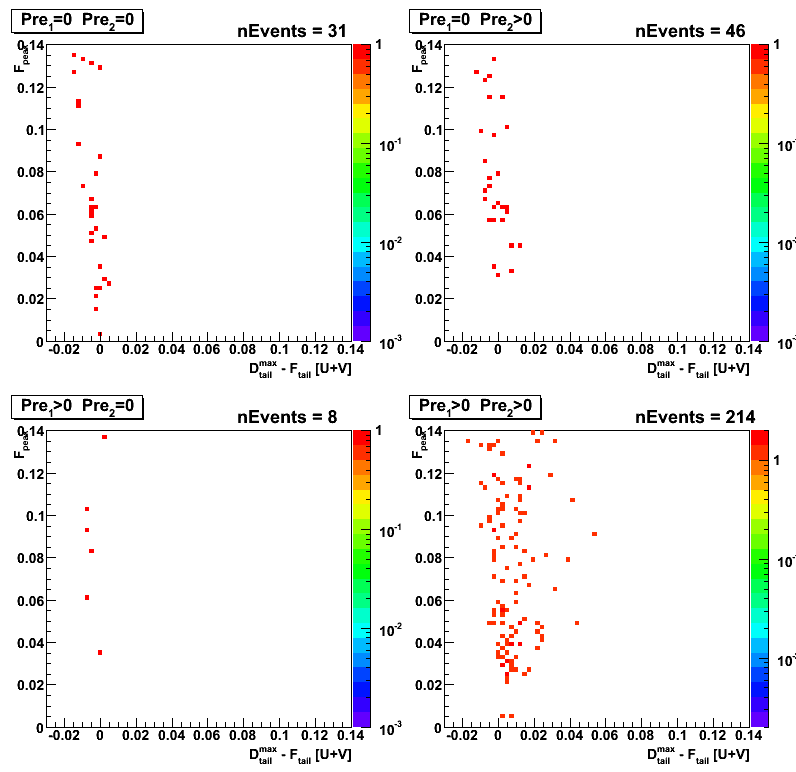
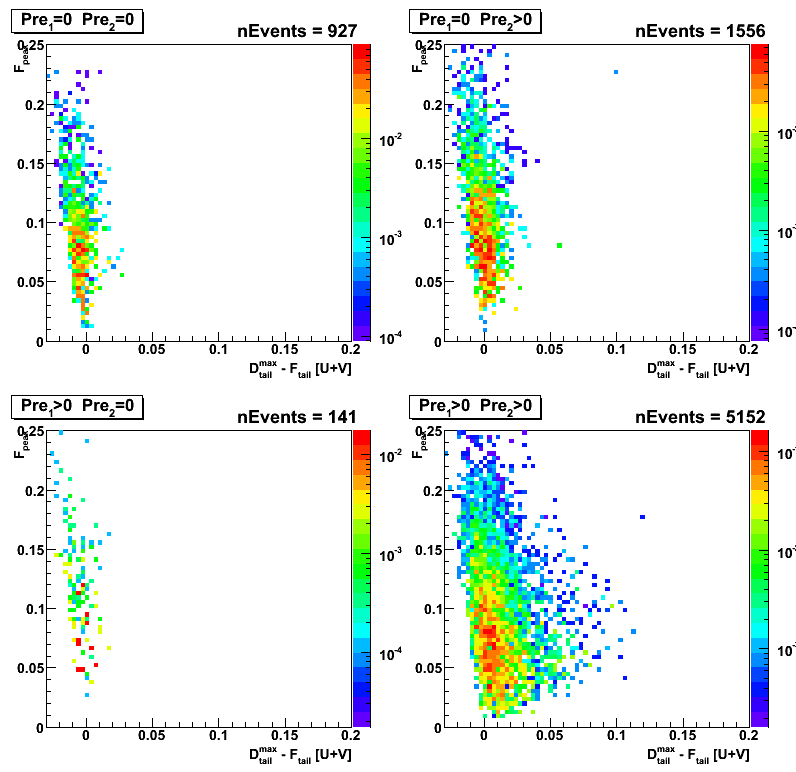
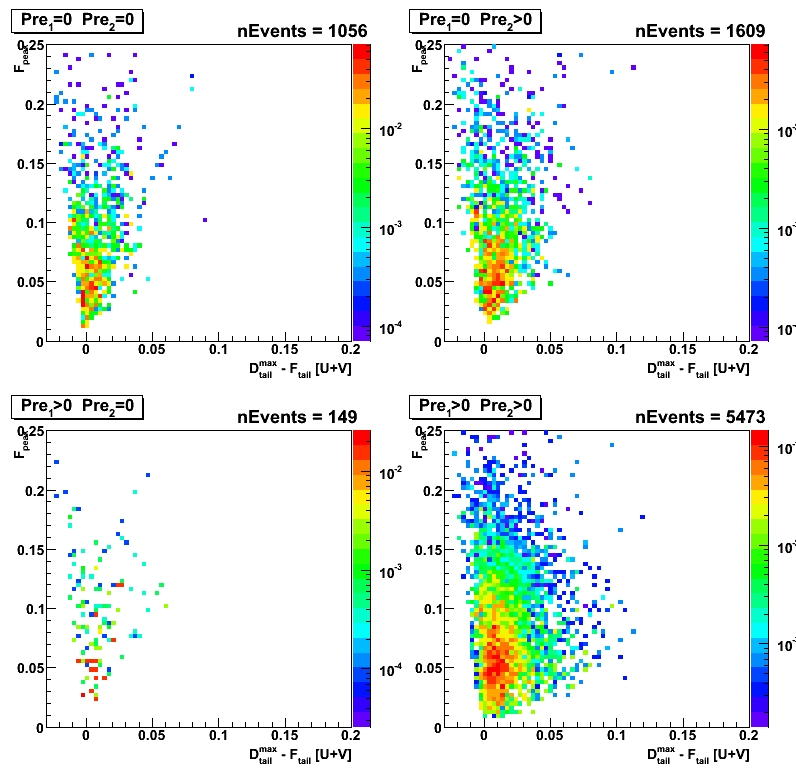
Figure 1: F_peak vs maximum residual
for various cuts on energy deposited in the EEMC pre-shower 1 and 2
(within a 3x3 clusters around tower with a maximum energy).
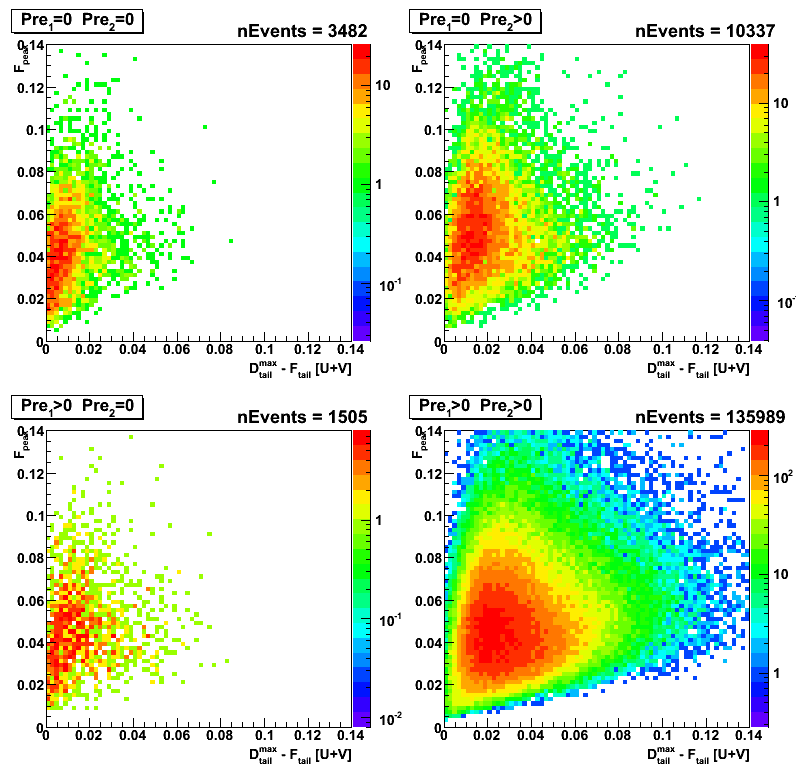
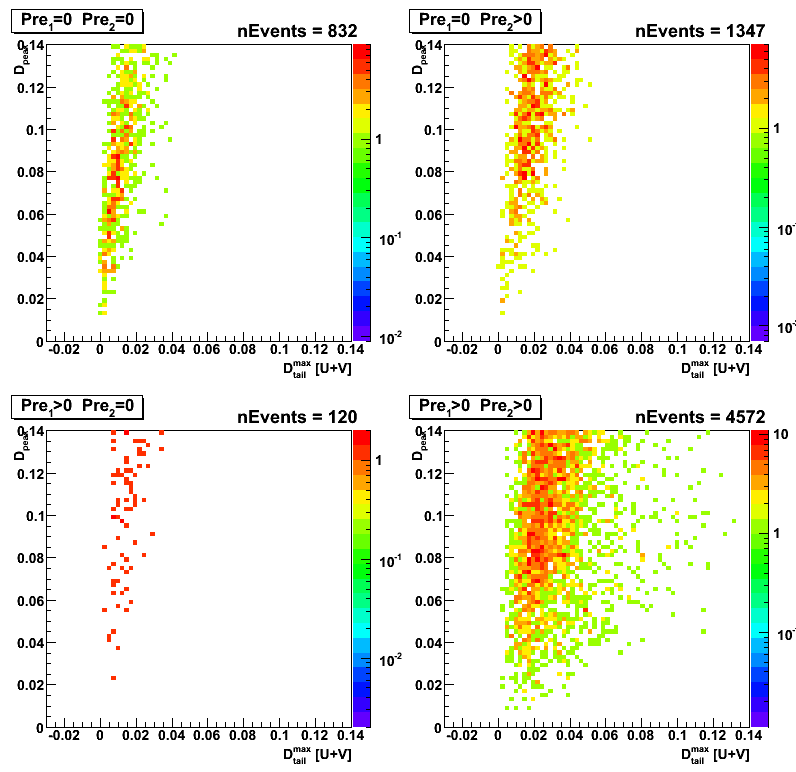
Figure 2: F_data vs D_tail^max
Note:This plot is fit independend (only the peak position is defined based on the fit)
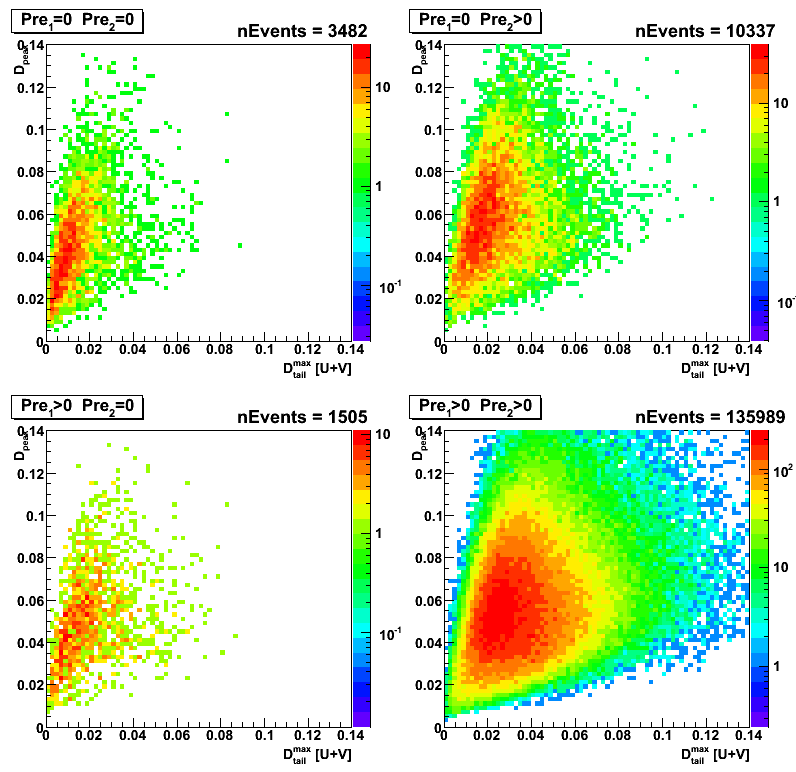
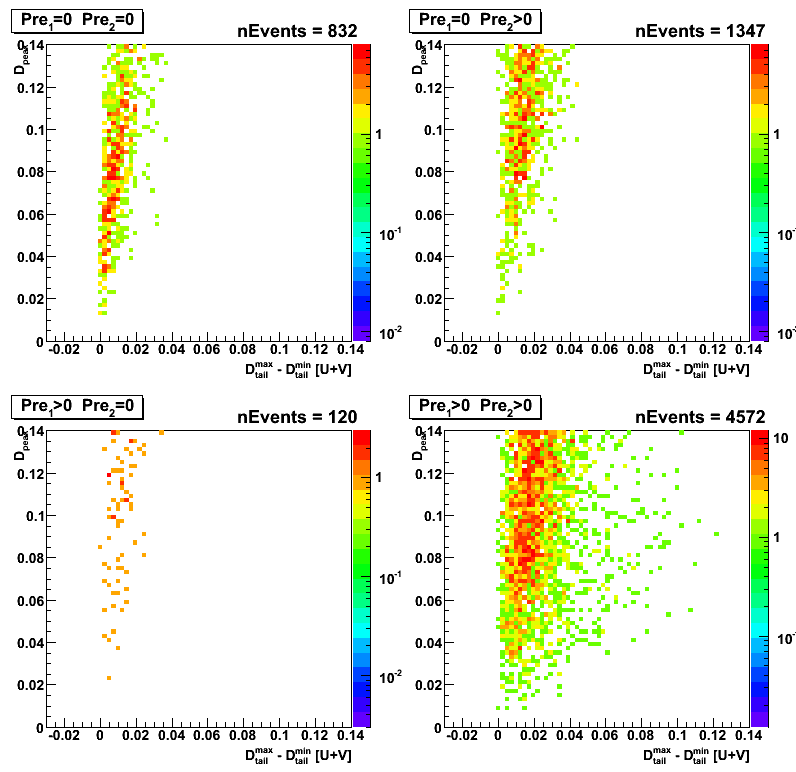
Figure 3: F_data vs D_tail^max-D_tail^max
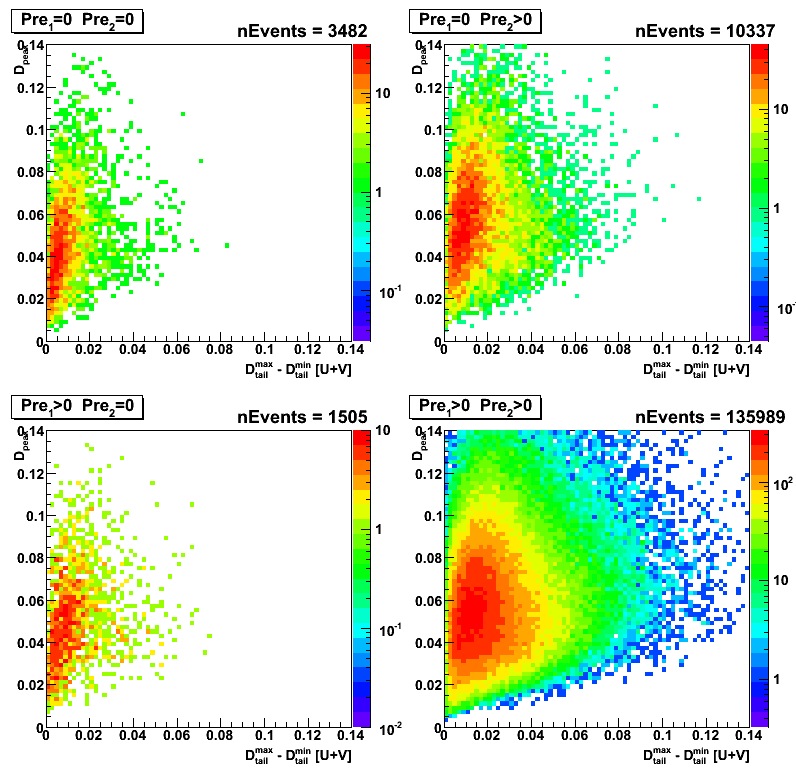
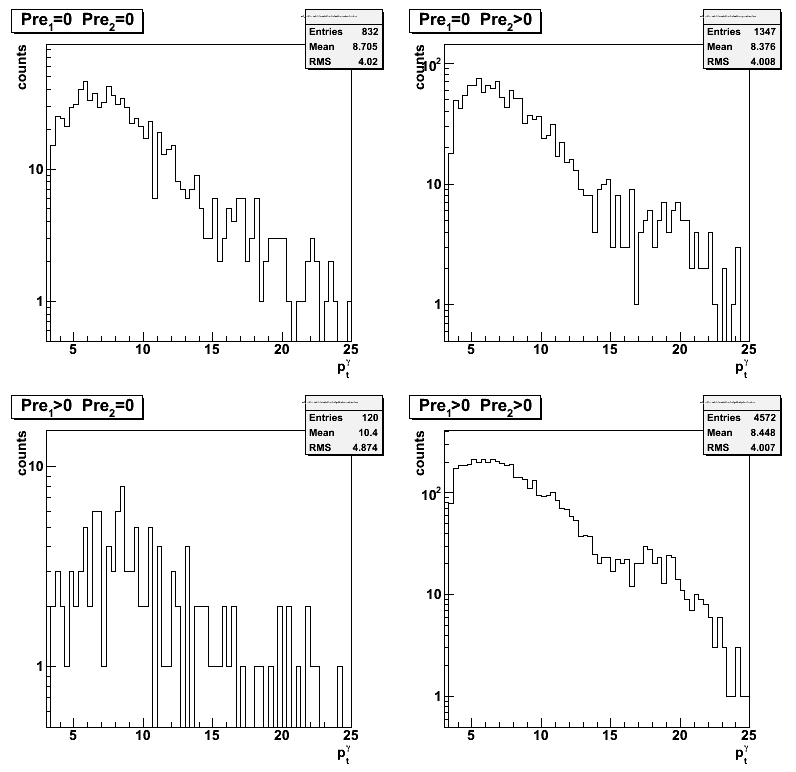
Figure 4: Gamma transverse momentum vs jet transverse momentum
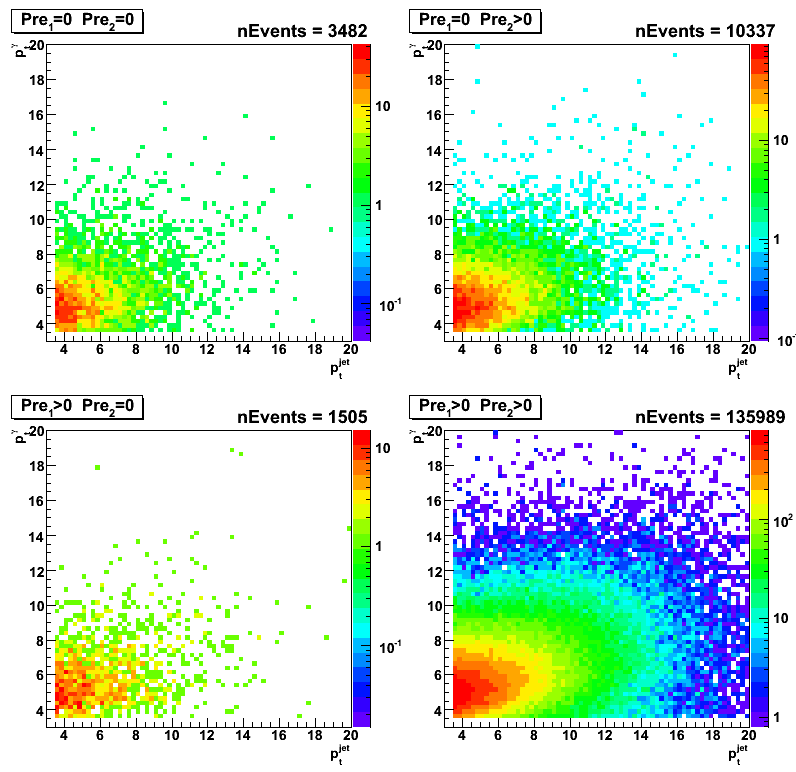
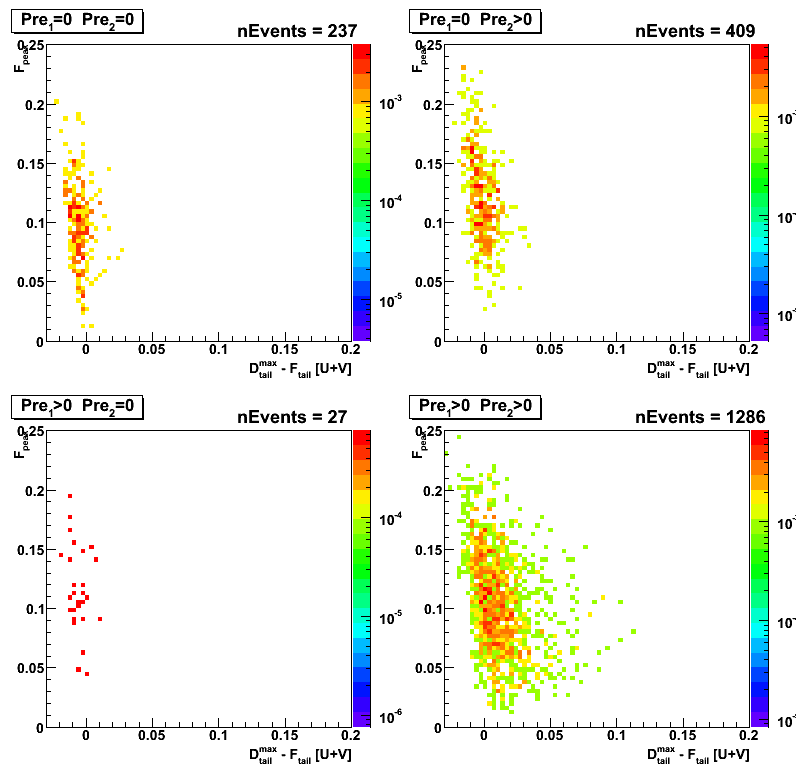
gamma-jet candidates: pt > 7GeV
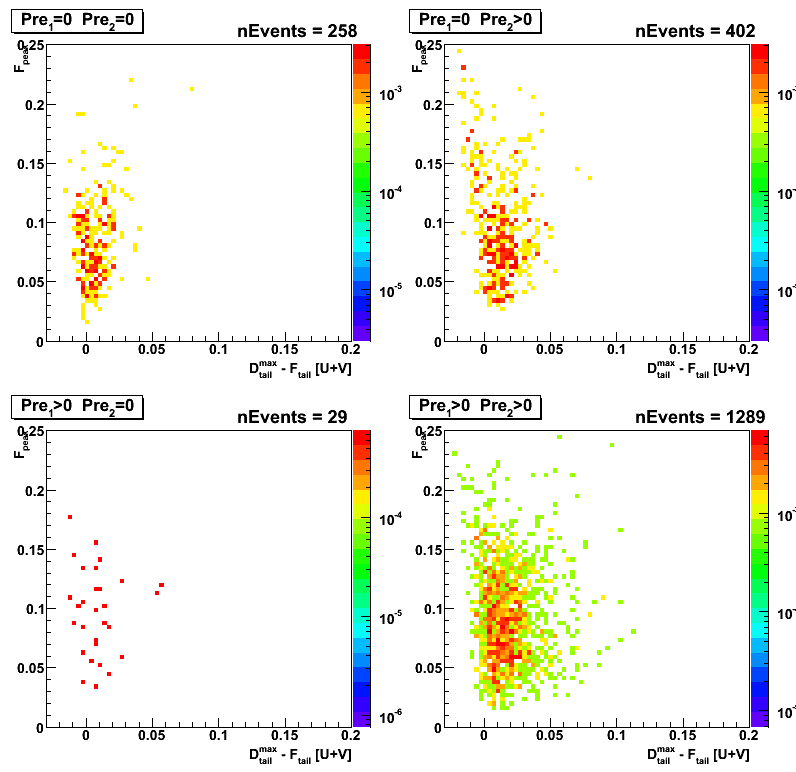
Figure 5: F_peak vs maximum residual
for various cuts on energy deposited in the EEMC pre-shower 1 and 2
(within a 3x3 clusters around tower with a maximum energy).
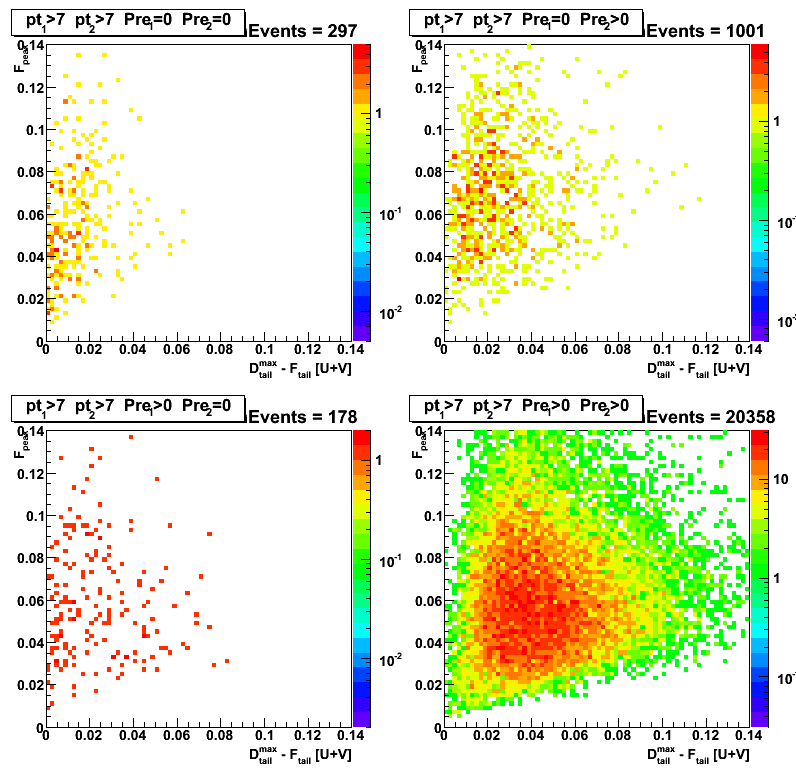
Figure 6: F_data vs D_tail^max
Note:This plot is fit independend (only the peak position is defined based on the fit)
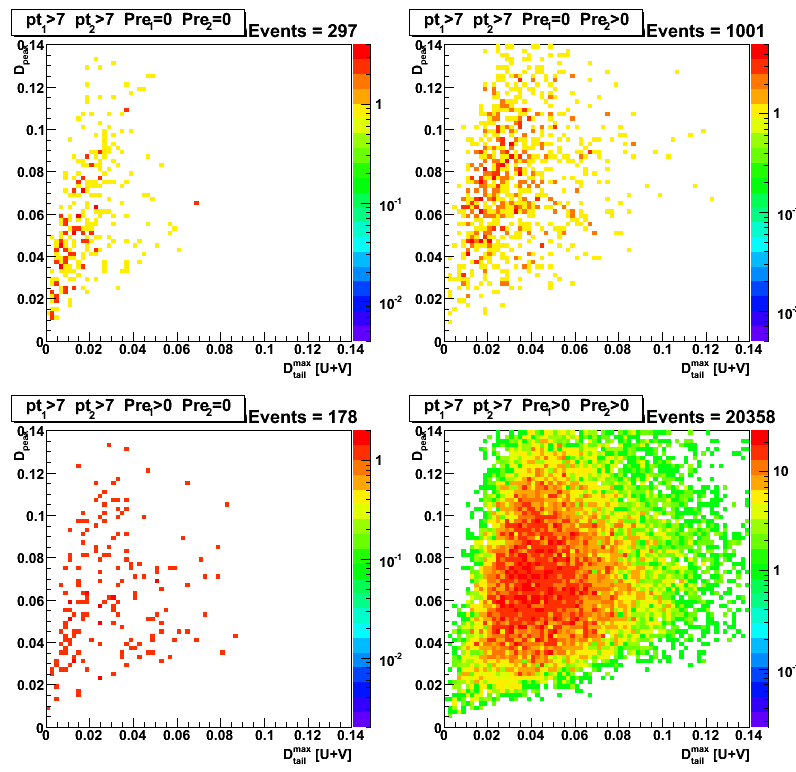
Figure 7: F_data vs D_tail^max-D_tail^max
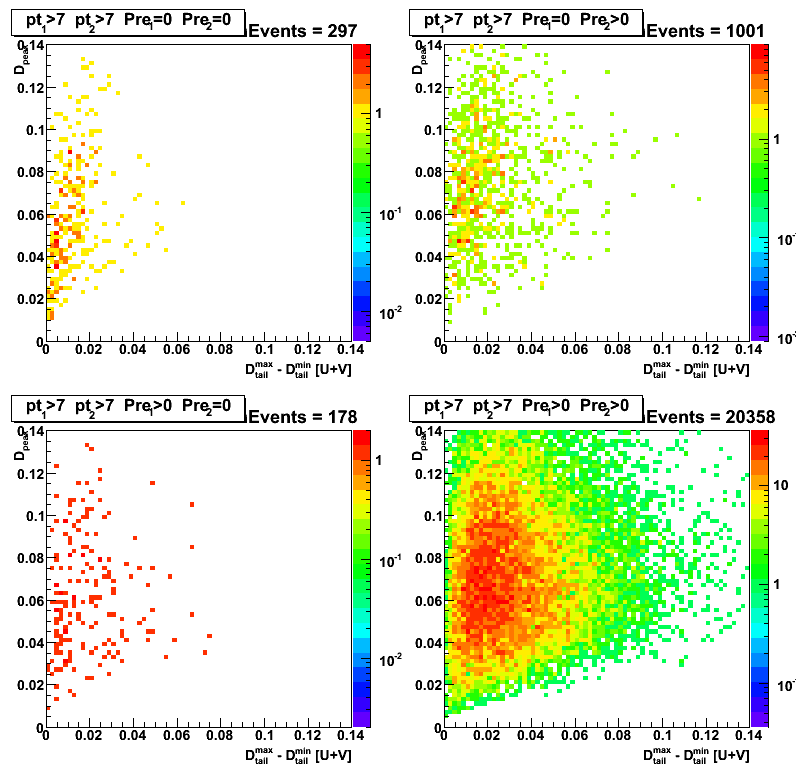
Figure 8: Gamma transverse momentum vs jet transverse momentum
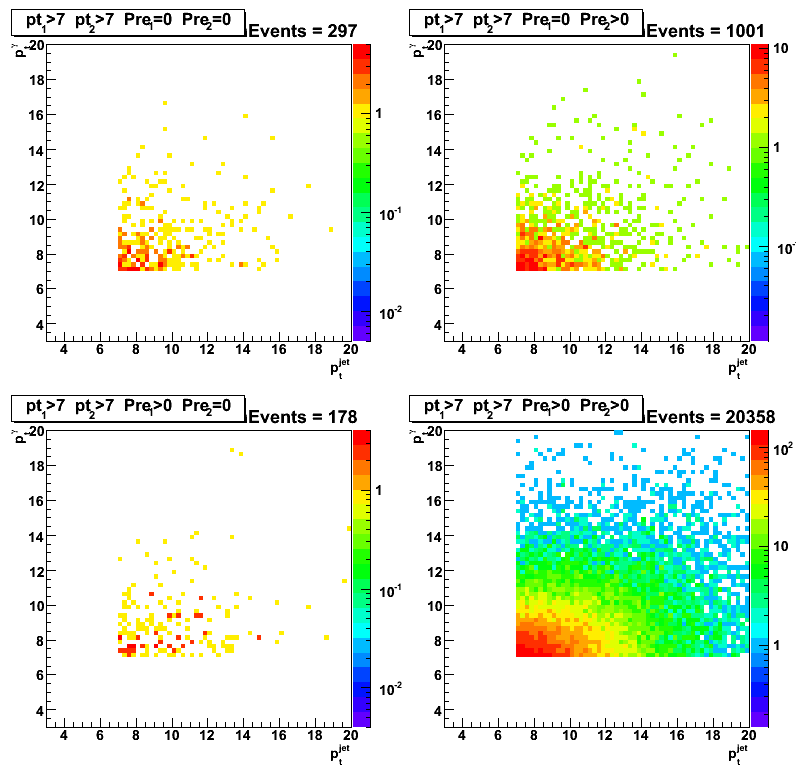
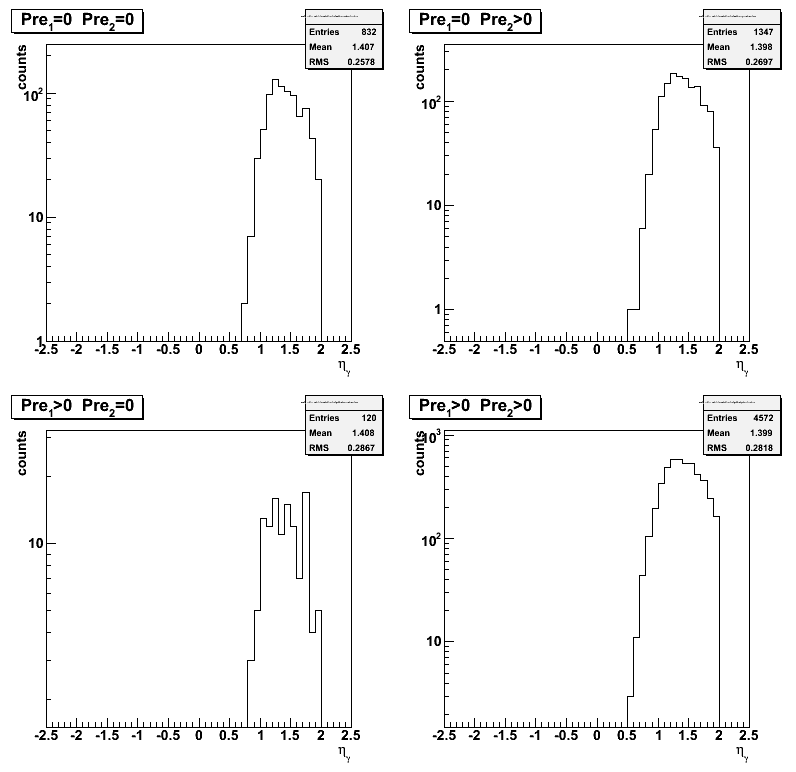
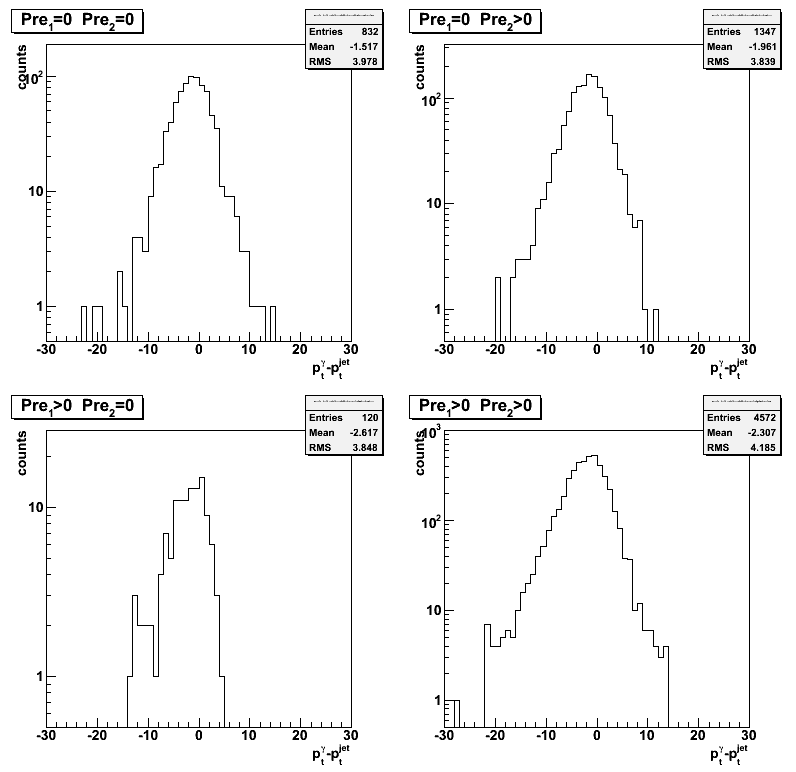
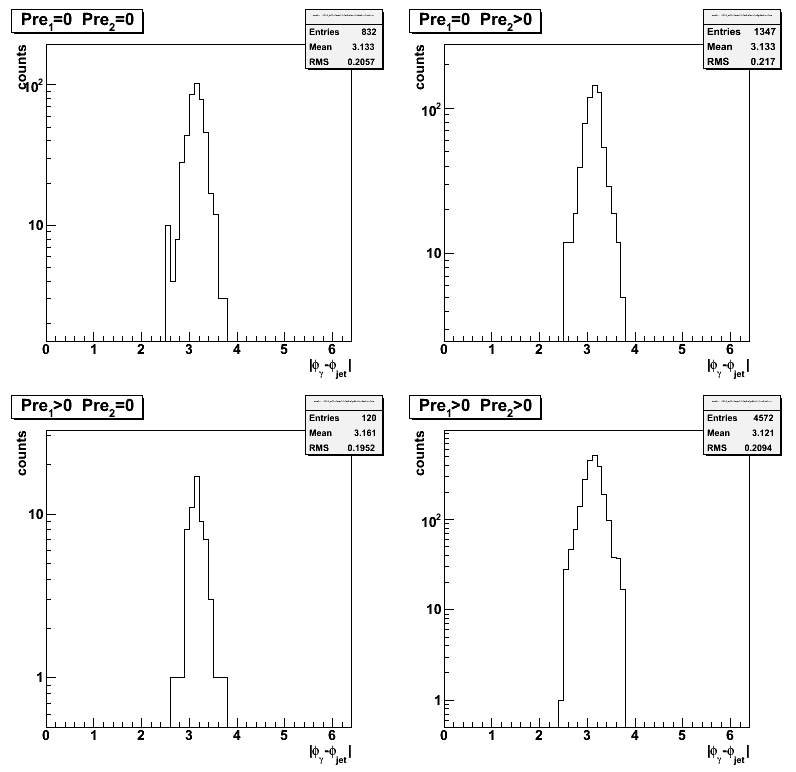
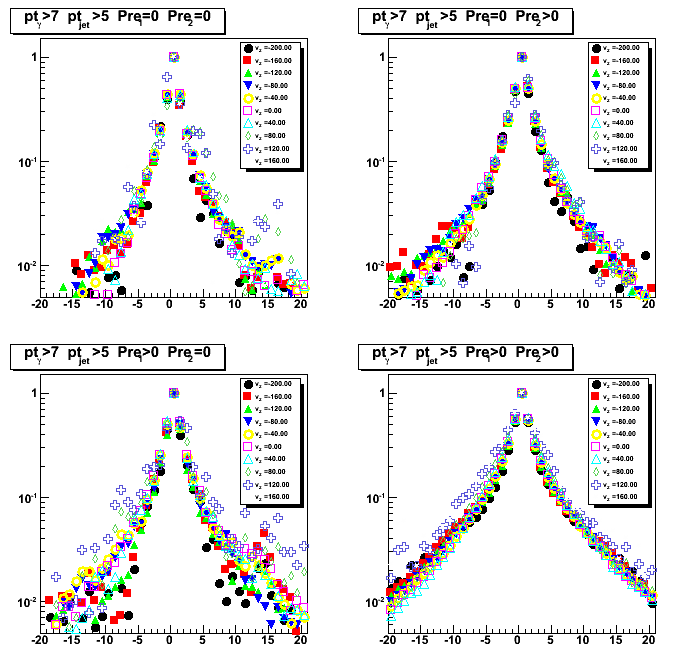
gamma-jet candidates: eta, phi, and max[u,v] strip distributions (no pt cuts)
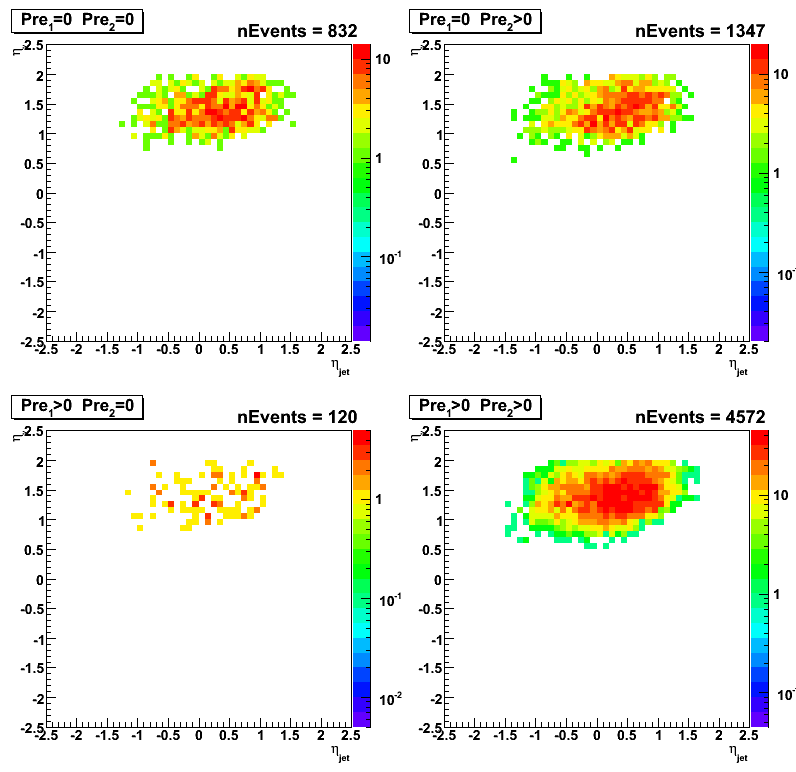
Figure 9: Gamma pseudorapidity vs jet pseudorapidity
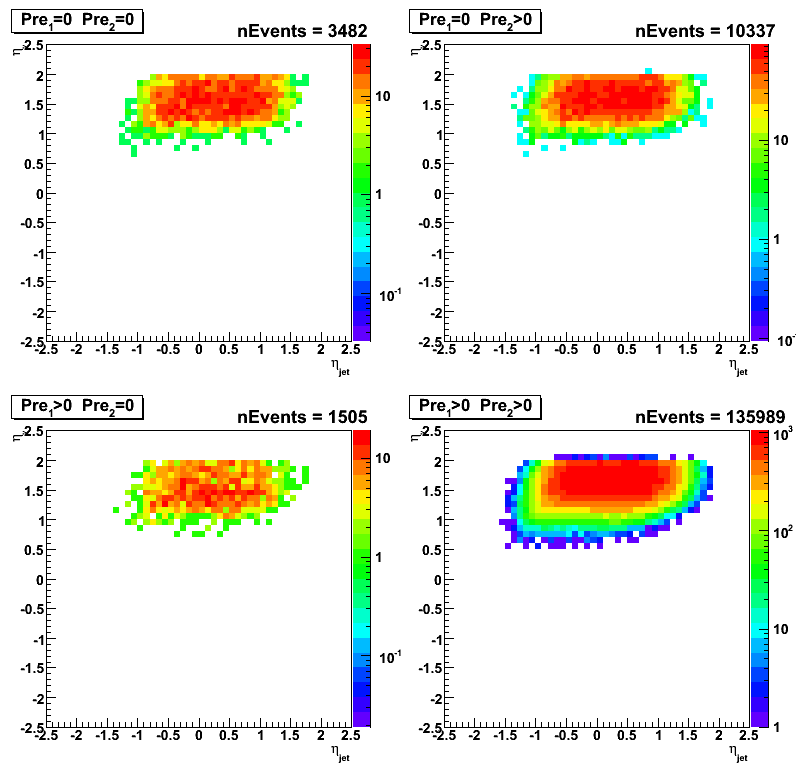
Figure 10: Gamma azimuthal angle vs jet azimuthal angle
Note: for the case of Pre1>1 && Pre2==0 there is an enhancement around phi_gamma = 0?
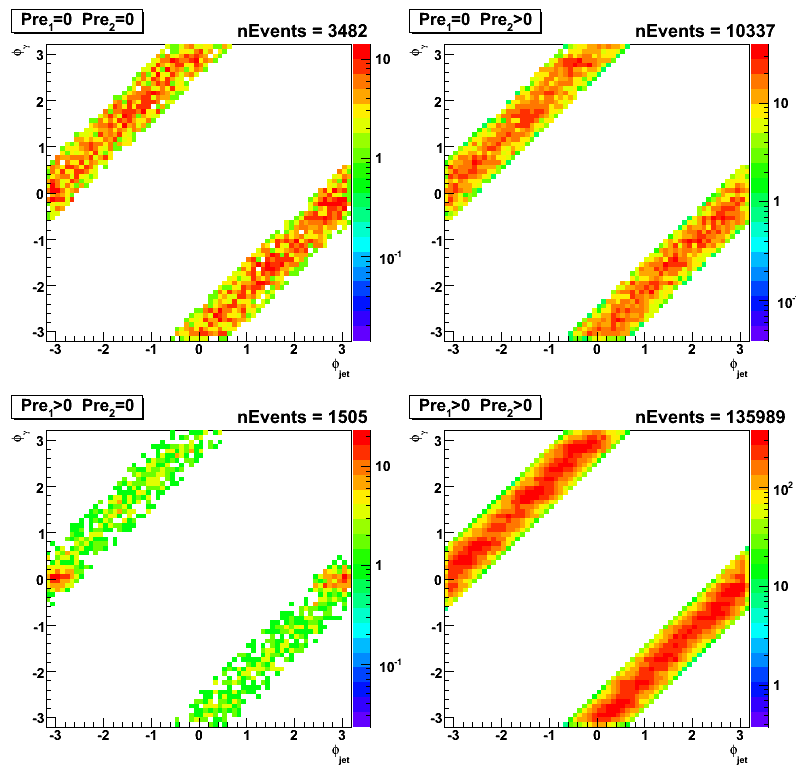
Figure 11: maximum strip in v-plane vs maximum strip in u-plane
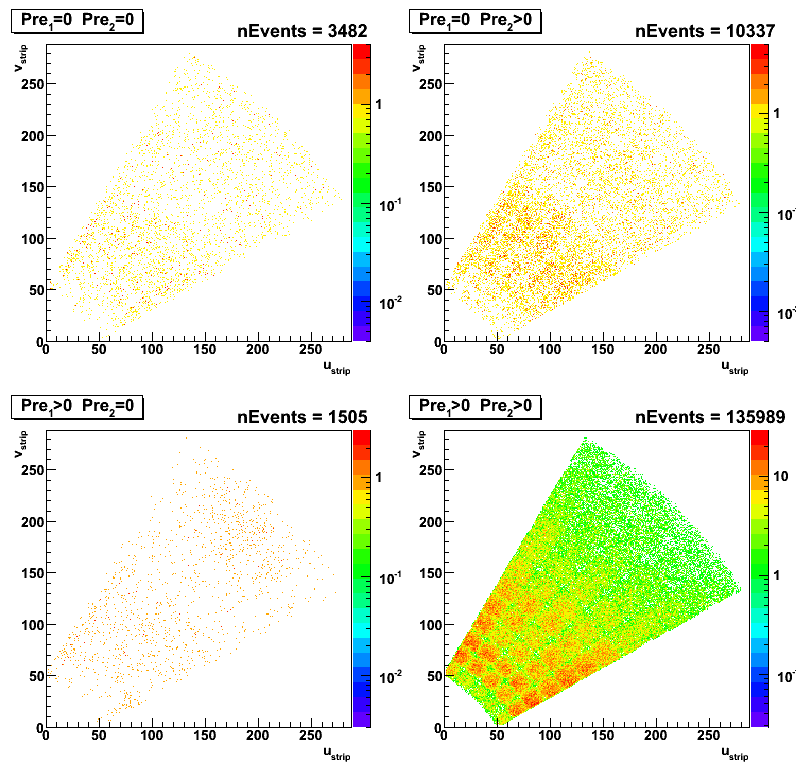
Chi2 distribution for gamma-jet candidates (no pt cuts)
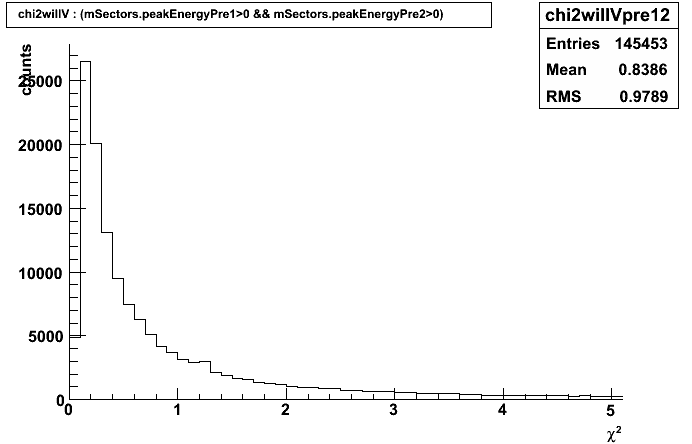
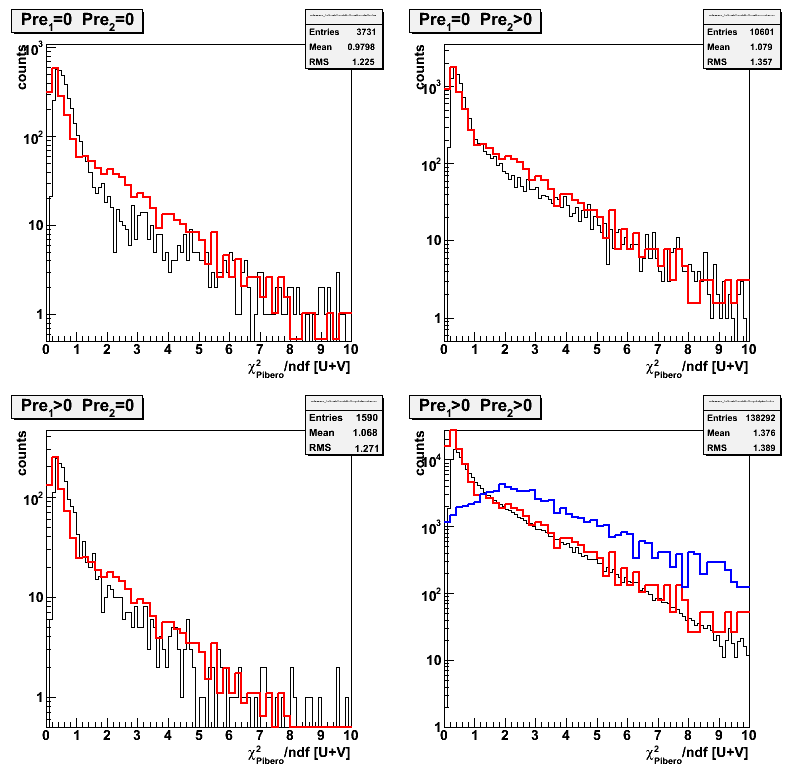
Figure 12:Chi2/ndf for gamma-jet candidates using Monte Carlo shape (combined for [u+v]/2 plane )
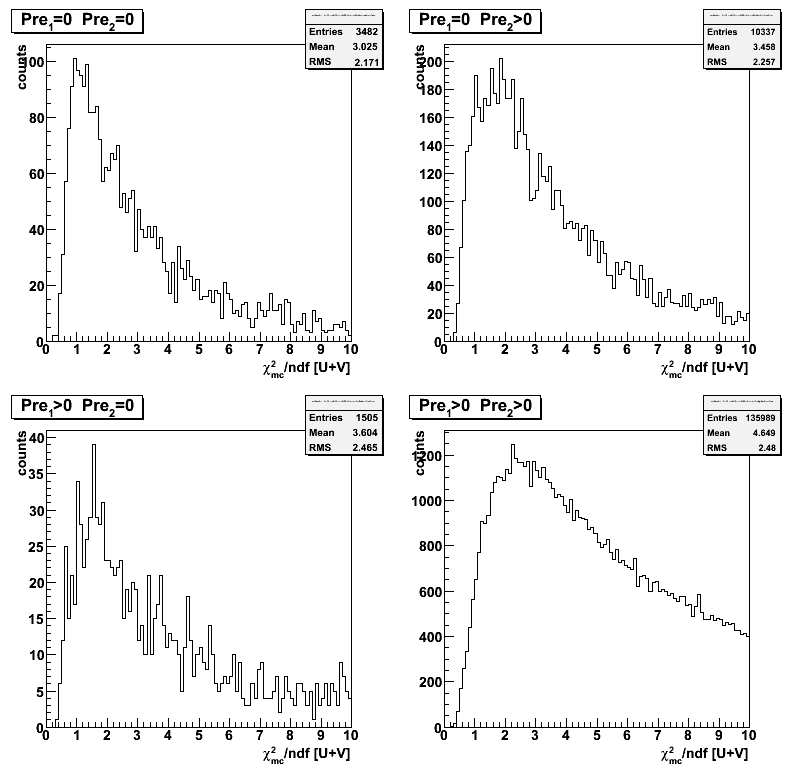
Figure 13:Chi2/ndf for gamma-jet candidates (combined for [u+v]/2 plane ) using Will's shape
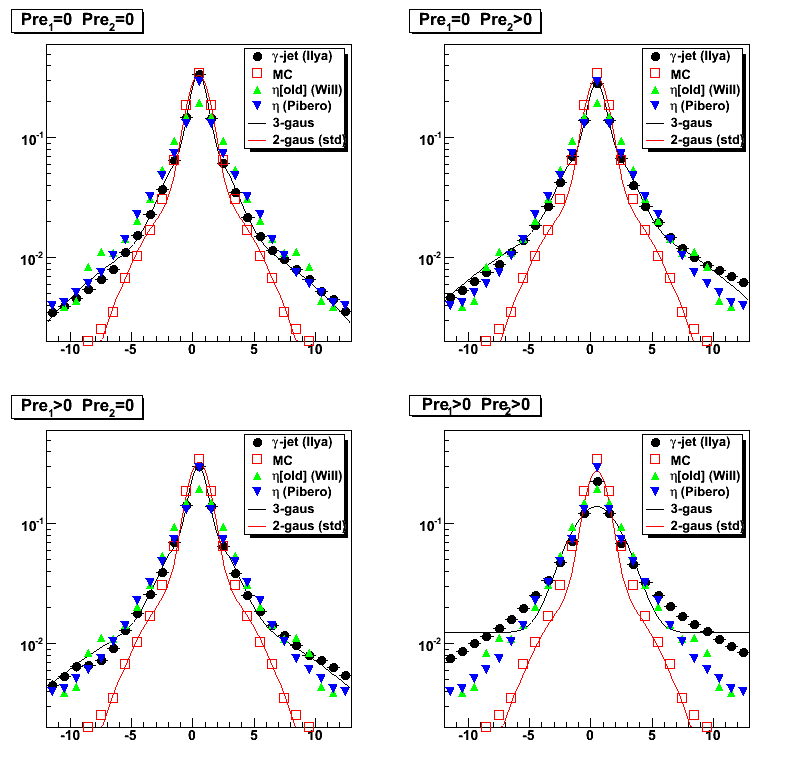
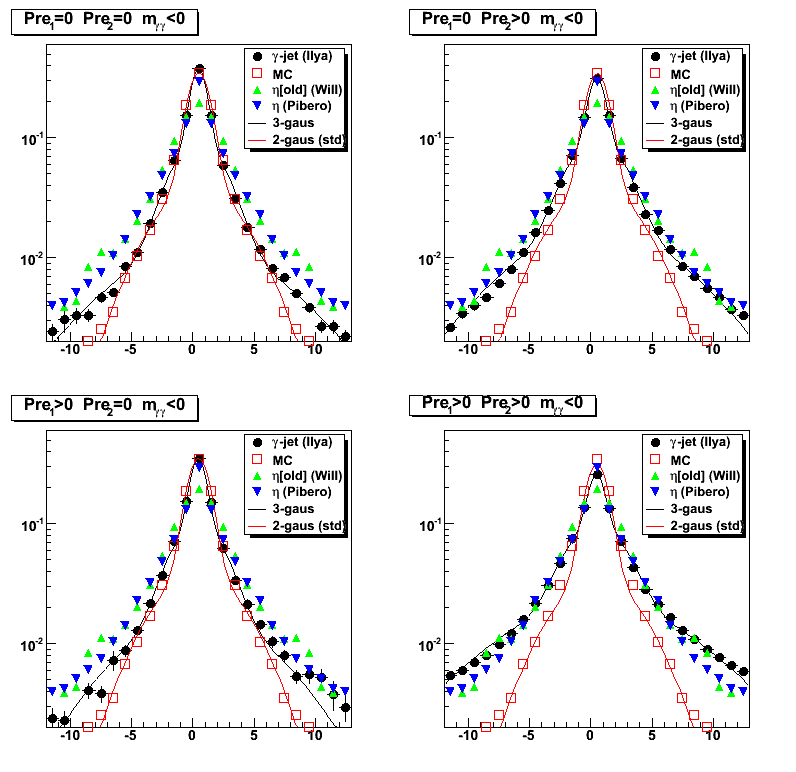
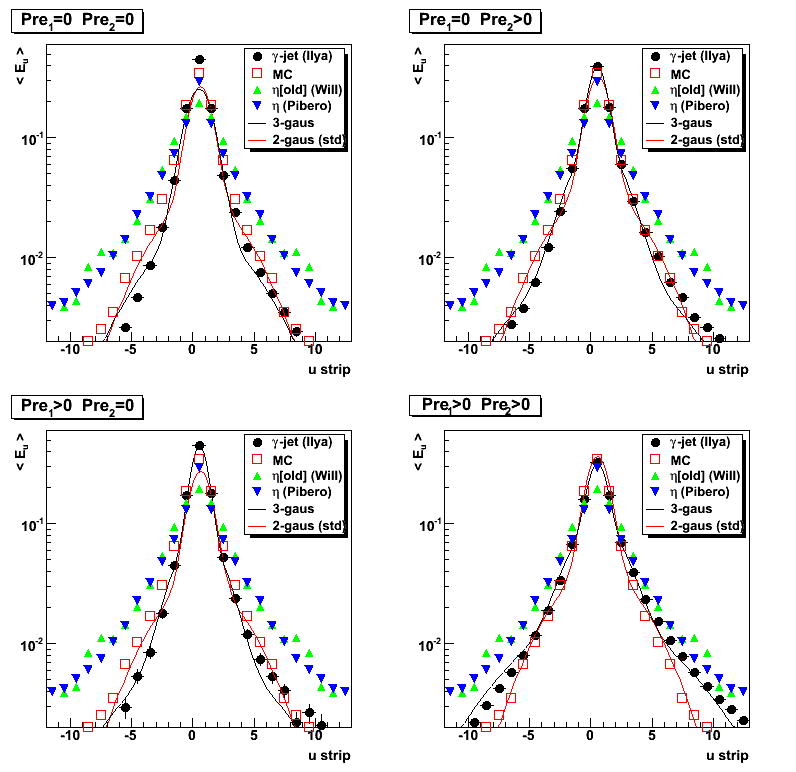
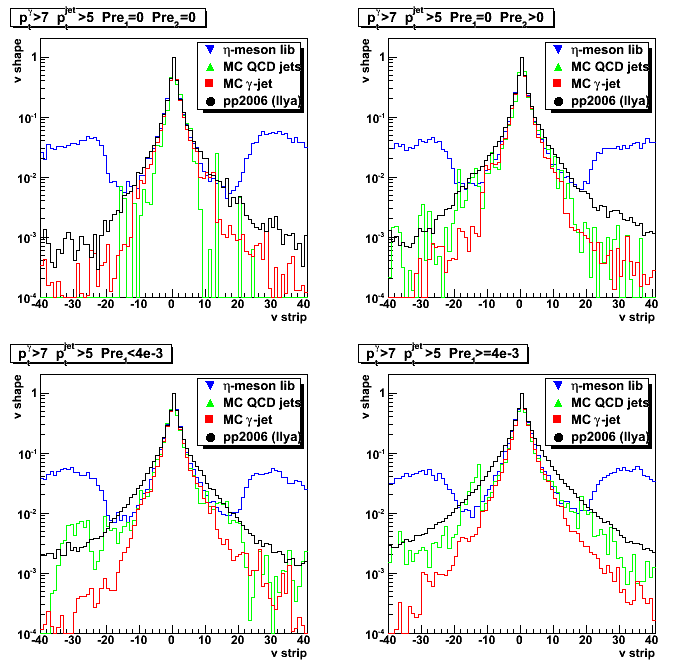
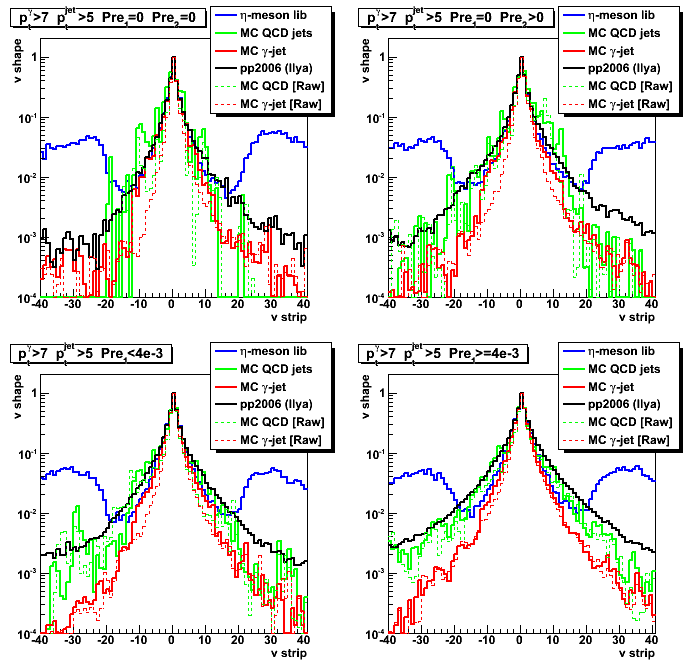
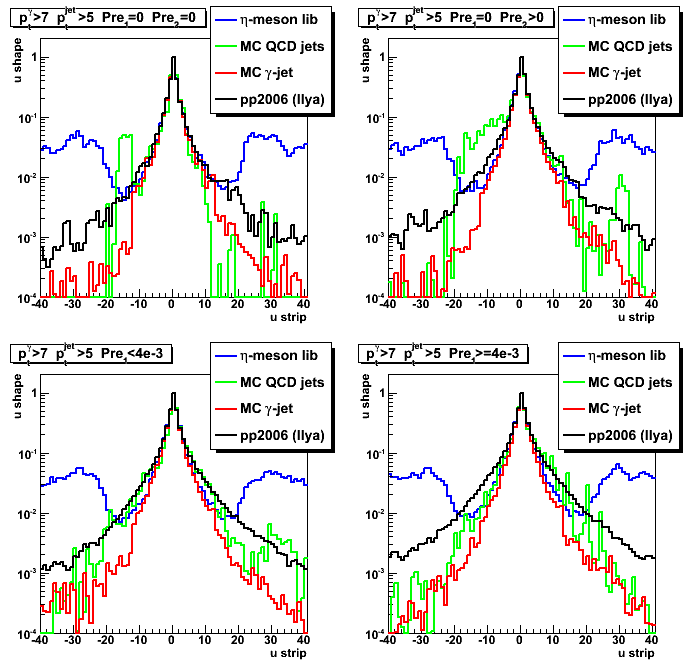
2008.03.28 EEMC SMD shapes: gamma's from gamma-jets (data), MC, and eta-meson analysis
Ilya Selyuzhenkov March 28, 2008
Some observations:
- SMD data-driven shapes from different analysis are in a good agreement (Figure 1, upper left plot)
- Overall MC shape is too narrow compared to the data shapes (Figure 1, upper left plot)
- Shapes are similar with or without gamma-jet 7GeV pt cut (compare Figures 1 and 2),
what may indicate that shape is independent on energy (at least within our kinematic limits). - Data-driven and MC shapes are getting close to each other (Figure 4, upper left plot)
when requiring no energy above threshold in both preshower layers and
with suppressed contribution from pi0 background.
The latter is achieved by using the information on
reconstructed invariant mass of 2gamma candidates (compare Figure 3 and 4).One interpretation of this can be that in Monte Carlo simulations
the contribution from the material in front of the detector is underestimated - Energy distribution for each strip in the SMD peak does not looks like a Gaussian (Figure 5),
what makes very difficult to interpret results obtained from chi2 analysis (Figure 6-8). -
Triple Gaussian fit gives a better description of the data shapes,
compared to the double Gaussian function (compare red and black lines on Figure 1-4)
Figure 1: EEMC SMD shape comparison for various preshower cuts
(black points shows u-plane shape only, v-plane results can be found here)
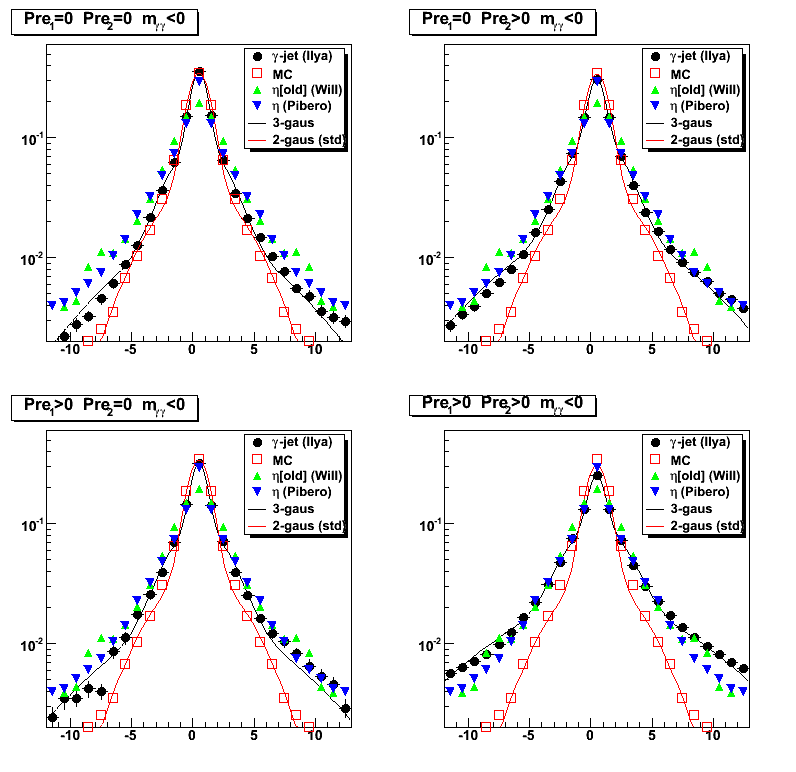
Figure 2: EEMC SMD shape comparison for various preshower cuts with gamma-jet pt cut of 7GeV
(black points shows u-plane shape only, v-plane results can be found here)
Figure 3: Shapes with an additional cut on 2-gamma candidates within pi0 invariant mass range.
Sample invariant mass distribution using "simple" pi0 finder can be found here
(black points shows u-plane shape only, v-plane results can be found here)
Figure 4: Shapes for the candidates when "simple" pi0 finder failed to find a second peak
(black points shows u-plane shape only, v-plane results can be found here)
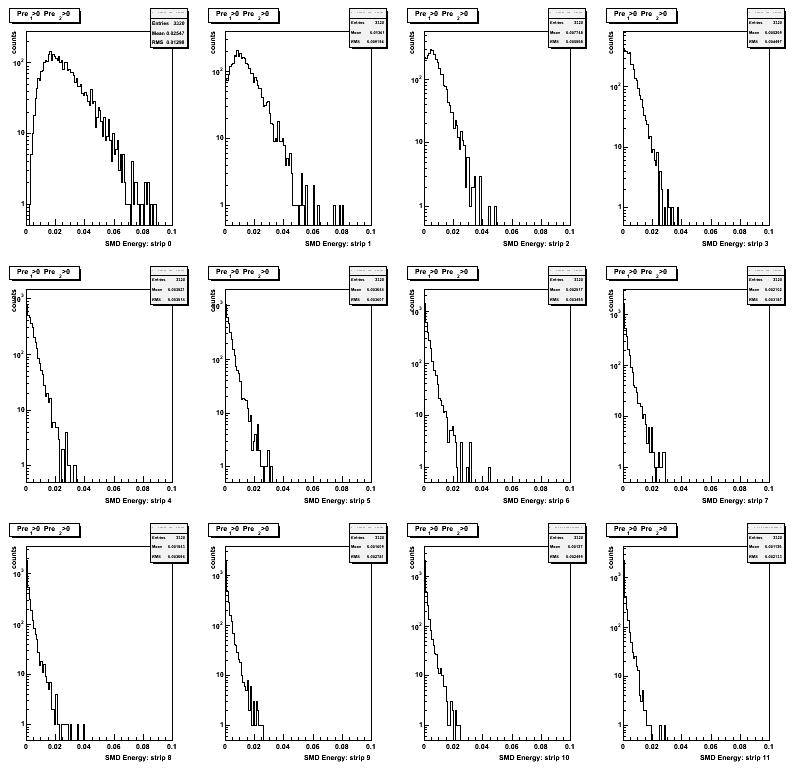
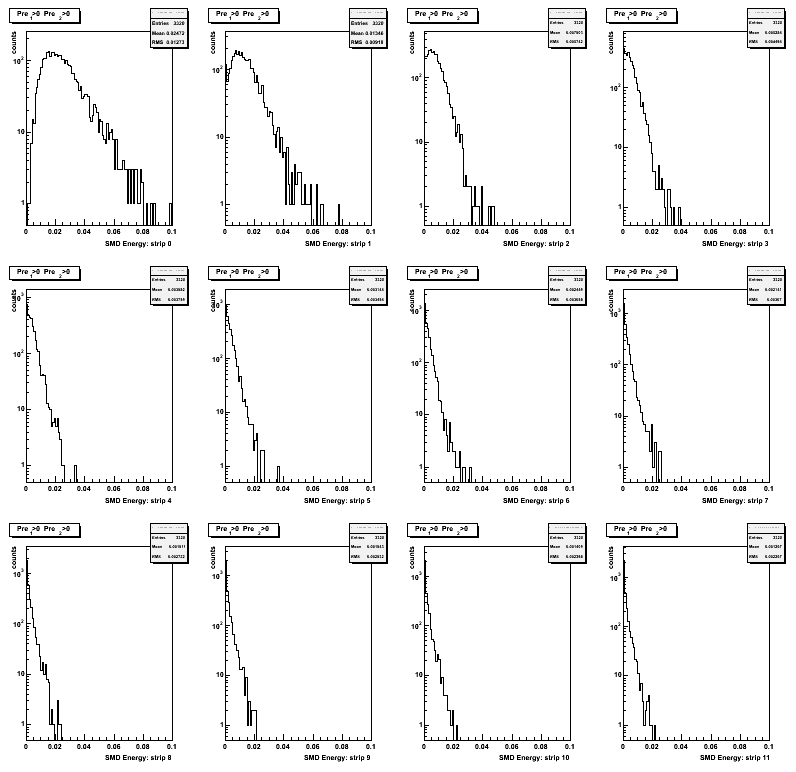
Figure 5: Strip by strip SMD energy distribution.
Only 12 strips from the right side of the maximum are shown.
Zero strip (first upper left plot) corresponds to the high strip in the shape
Note, that already at the 3rd strip from a peak,
RMS values are comparable to those for a mean, and for a higher strips numbers RMS starts to be bigger that mean.
(results for u-plane only, v-plane results can be found here)
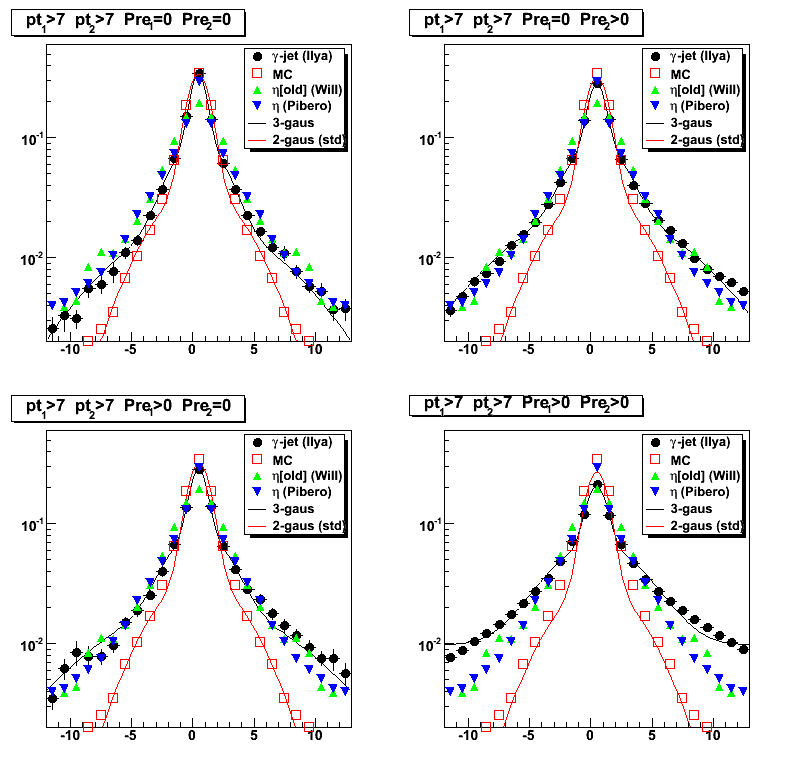
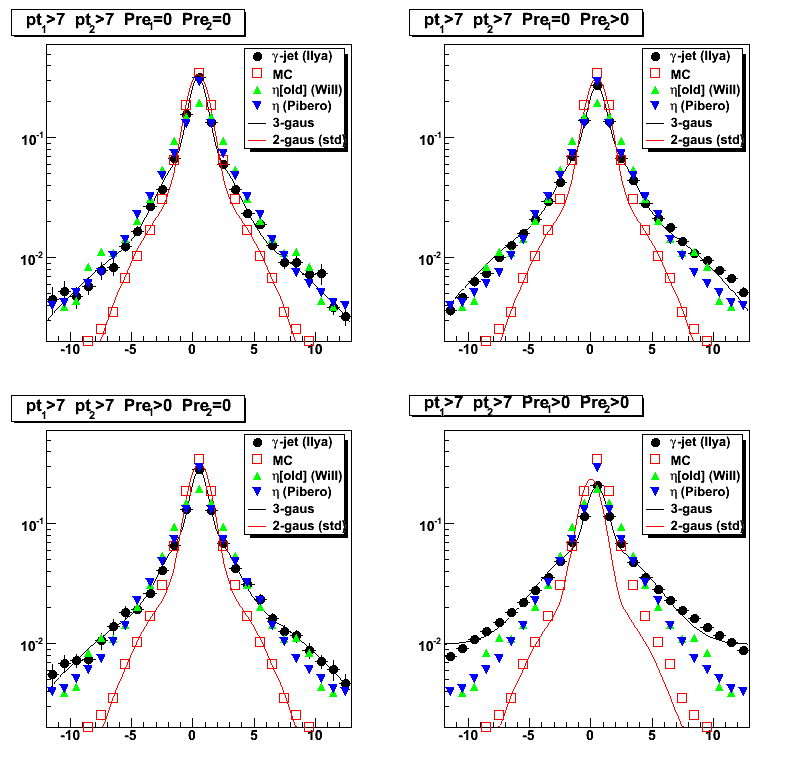
Comparing chi2 distributions for gamma-jet candidates using MC, Will, and Pibero's shapes
Results for side residual (together with pt, eta, phi distributions) for gamma-jet candidates can be found at this web page
Red histograms on Figures 6-8 shows chi2 distribution from MC-photons (normalized at chi2=1.4)
Blue histograms on Figures 6-8 shows chi2 distribution from MC-pions (normalized at chi2=1.4)
Figure 6: Chi2/ndf for gamma-jet candidates using Monte Carlo shape
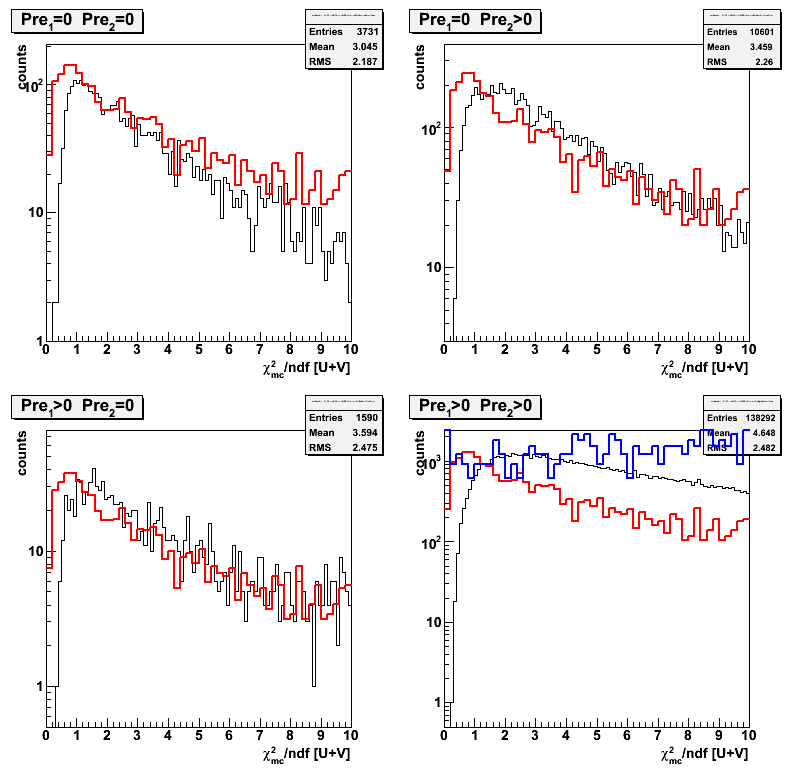
Figure 7: Chi2/ndf for gamma-jet candidates using Will's shape (derived from eta candidates based on Weihong's pi0-finder)
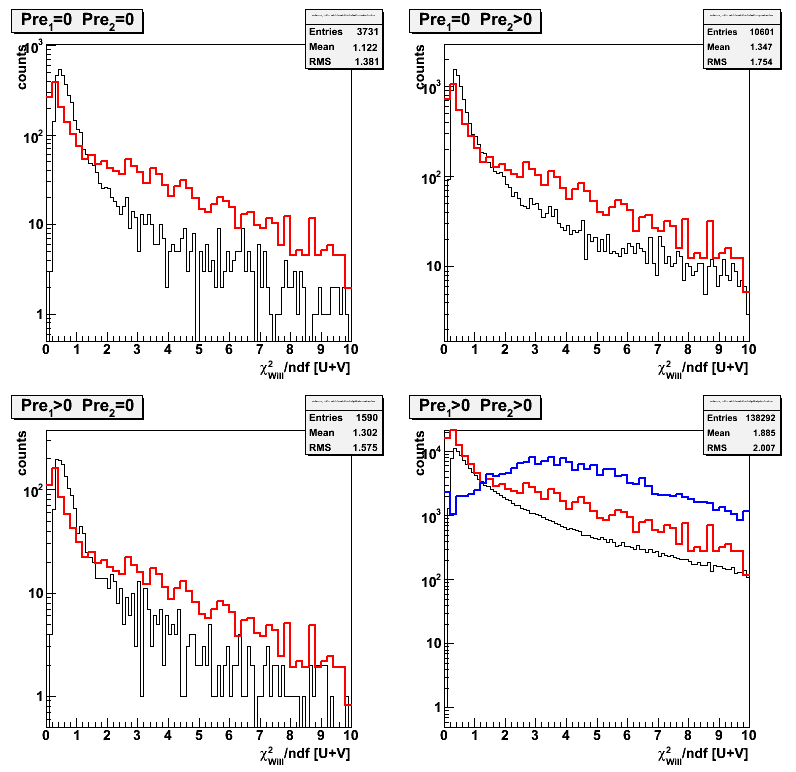
Figure 8: Chi2/ndf for gamma-jet candidates using Pibero's shape (derived from eta candidates)
04 Apr
April 2008 posts
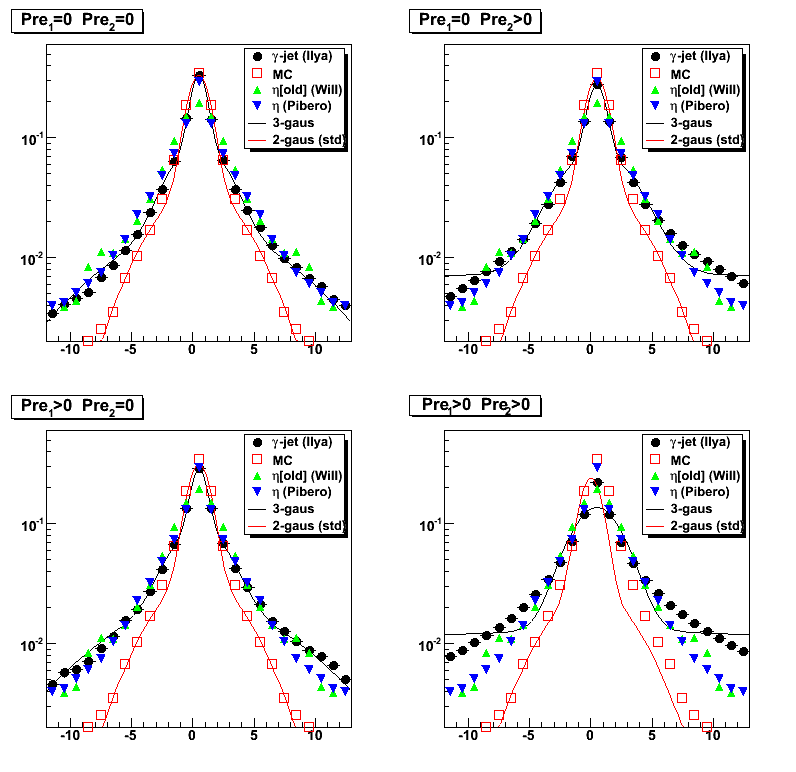
2008.04.02 EEMC SMD shapes: data-driven (eta, gamma-jet) vs Monte Carlo (single gamma, gamma-jet)
Ilya Selyuzhenkov April 02, 2008
Some observations:
- SMD data-driven shapes from eta-meson and gamma-jet studies
are in a good agreement for different preshower conditions
(compage Fig.1 green circles/triangles in upper-left/bottom-right plots) - single gamma MC shapes show preshower dependance,
but they are still narrower compared to the data shapes
(compare Fig.1 green circles vs blue open squares) - MC shapes for gamma-jet and single gamma are consistent (Fig.1, bottom right plot)
Figure 1: EEMC SMD shape comparison for various preshower cuts
Note:Only MC gamma-jet shape (open red squares) is the same on all plots
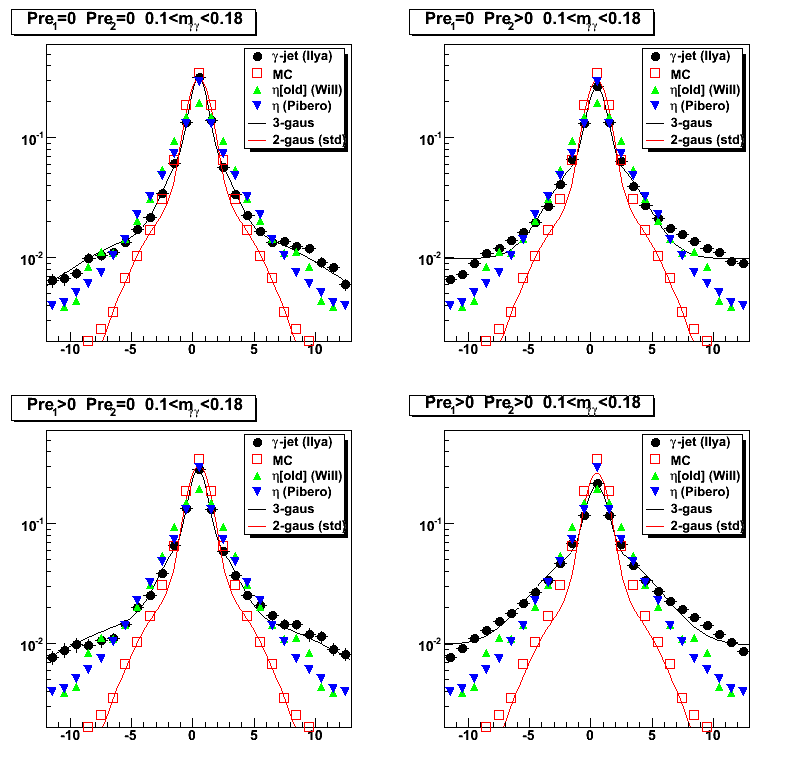
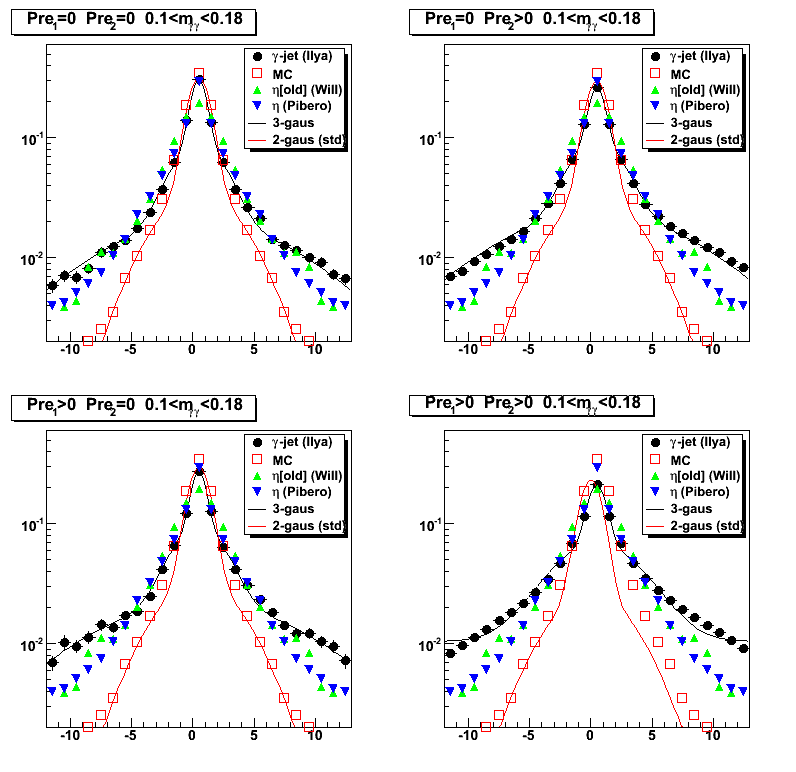
2008.04.02 Sided residual: Using data driven gamma-jet shape (3 gaussian fit)
Ilya Selyuzhenkov April 02, 2008
Figure 1: Side residual for various cuts on energy deposited in the EEMC pre-shower 1 and 2
No EEMC SMD based cuts
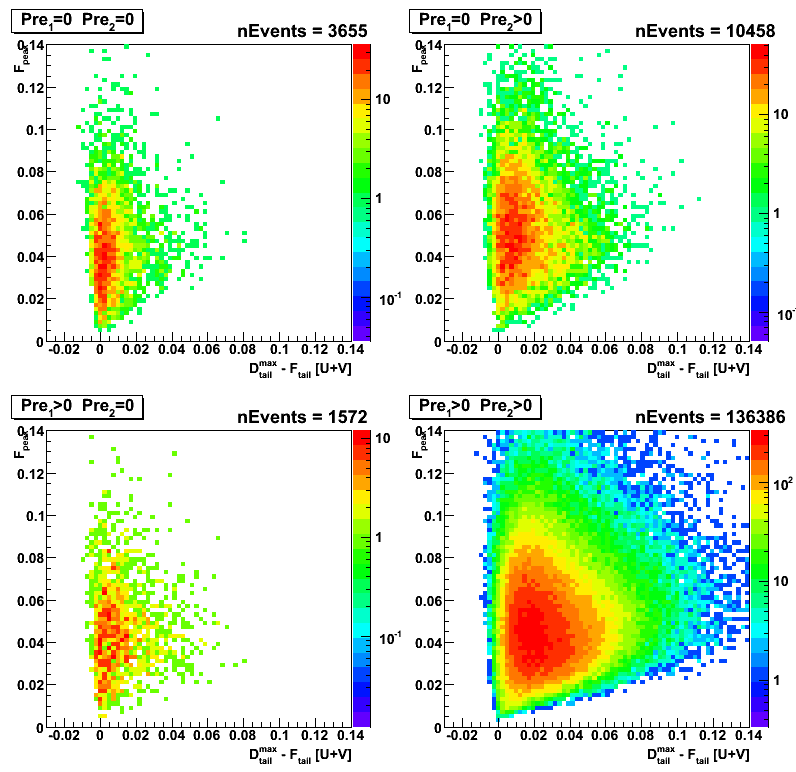
Figure 2: Side residual for various cuts on energy deposited in the EEMC pre-shower 1 and 2
"Simple" pi0 finder can not find a second peak
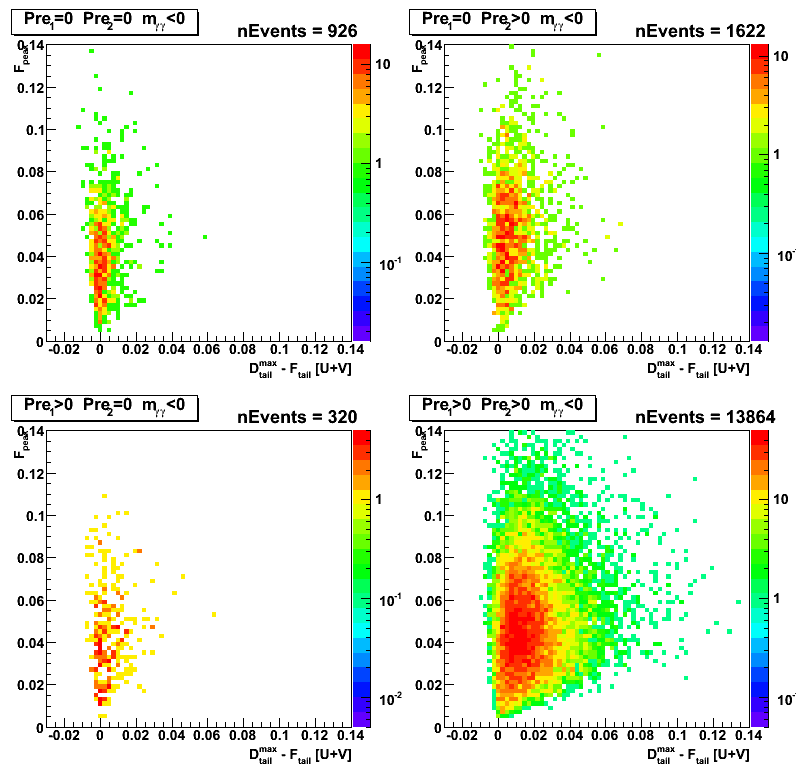
Figure 3: Side residual for various cuts on energy deposited in the EEMC pre-shower 1 and 2
"Simple" pi0 finder reconstruct the invarian mass within [0.1,0.18] range
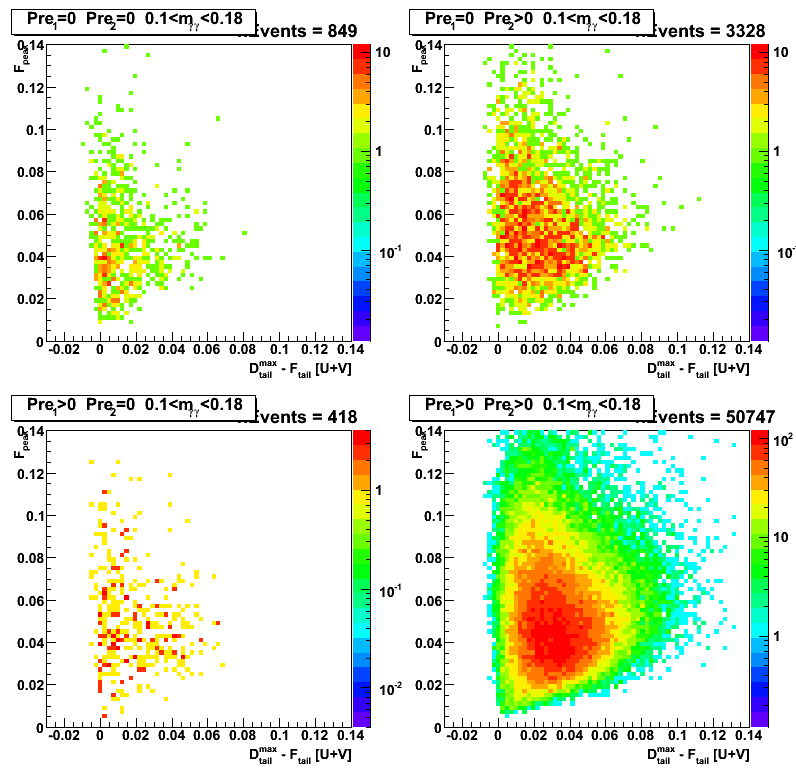
Figure 4: Side residual distribution (Projection for side residual in Figs.1-3 on vertical axis)
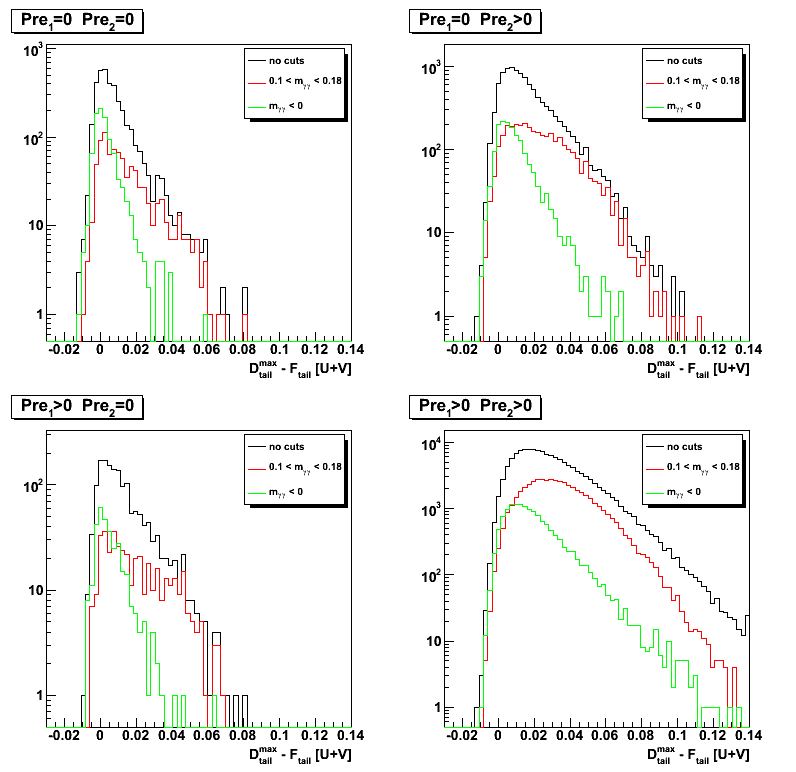
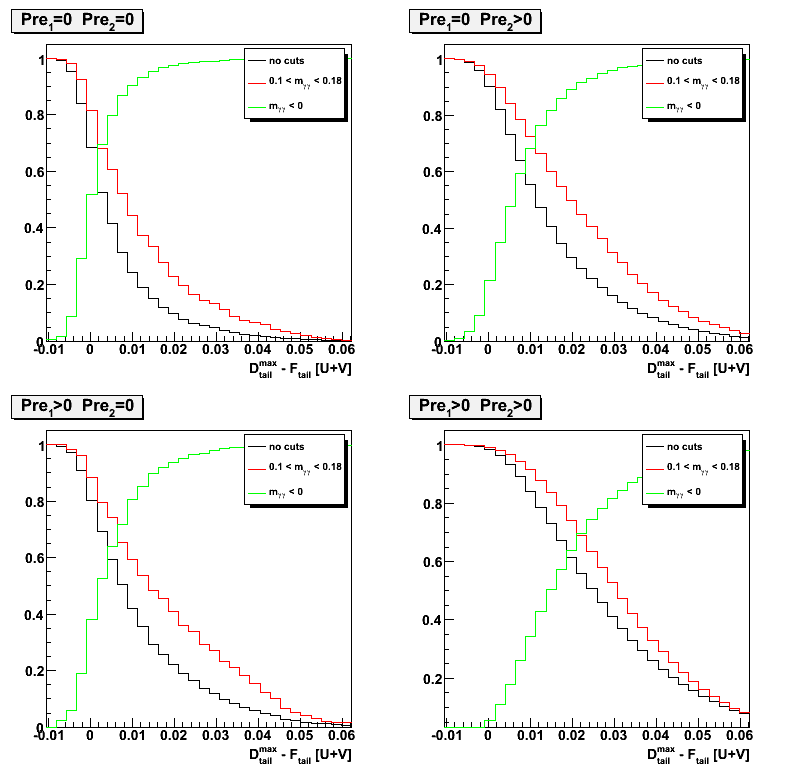
Figure 5: Signal (green: m < 0) vs background (black, red) separation
2008.04.02 Sided residual: single gamma Monte-Carlo simulations
Ilya Selyuzhenkov April 02, 2008
Side residual: single gamma Monte-Carlo simulations
Figure 1: Side residual for various cuts on energy deposited in the EEMC pre-shower 1 and 2
No EEMC SMD based cuts
2008.04.03 chi2-shape subtraction for different Preshower conditions
Ilya Selyuzhenkov April 03, 2008
Request from Hal Spinka:
Hi Ilya,
I think you gave up on the chi-squared method too quickly, and am sorry I missed the phone meeting last week. So, I would like to make a request that will hopefully take a minimal amount of your time to show that all is okay. Then, if there is a delay in getting the sided residual information out and into the beam use request, you can still fall back on the chi-squared method.
In your March 28 posting, Figure 8 at the bottom, I would like to get numerical values for the events per bin for the black curves. I won't use the preshower1>0 and preshower2=0 data, so those you don't need to send. Also, I won't use the red or blue curve information.
I think your problem has been that you normalized your curves at chi-squared/ndf = 1.4 instead of the peak. What I plan to do is to normalize the (pre1=0, pre2=0) to the (pre1=0, pre2>0) data in the peak and subtract. The (pre1=0, pre2=0) set should have some single photons, but also some multiple photons. The (pre1=0, pre2>0) should also have single photons, and more multiple photons, since the chance that one of them will convert is larger. The difference should look roughly like your blue curve, though perhaps not exactly if Pibero's mean shower shape is not perfect (which it isn't). I will do the same thing with taking the difference between (pre1>0, pre2>0) and (pre1=0, pre2=0), and again the difference should look roughly like your blue curve. The (pre1>0, pre2>0) data should have even larger fraction of multiple photons than either of the other two data sets. I would expect the two difference curves to look approximately the same.
Hope this is possible for you to do. Since our reduced chi-squared curve looks so much like the one from CDF, I am pretty confident that we are okay, but this should be checked to convince people that we are not doing anything terribly wrong.
Reply by Ilya:
Dear Hal,
I have tried to implement your idea and produce a figure attached.
There are 4 plots in it:
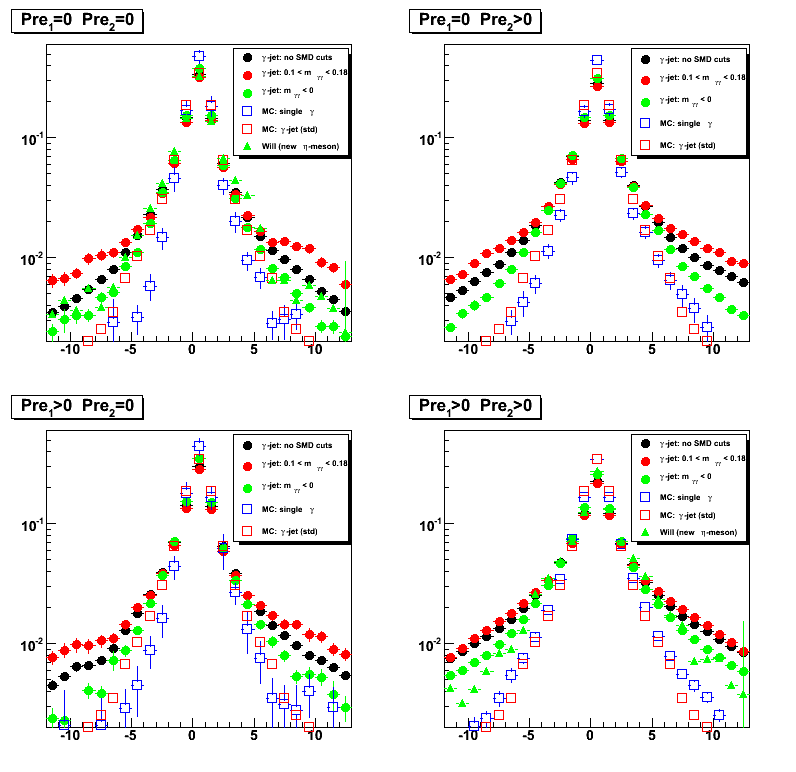
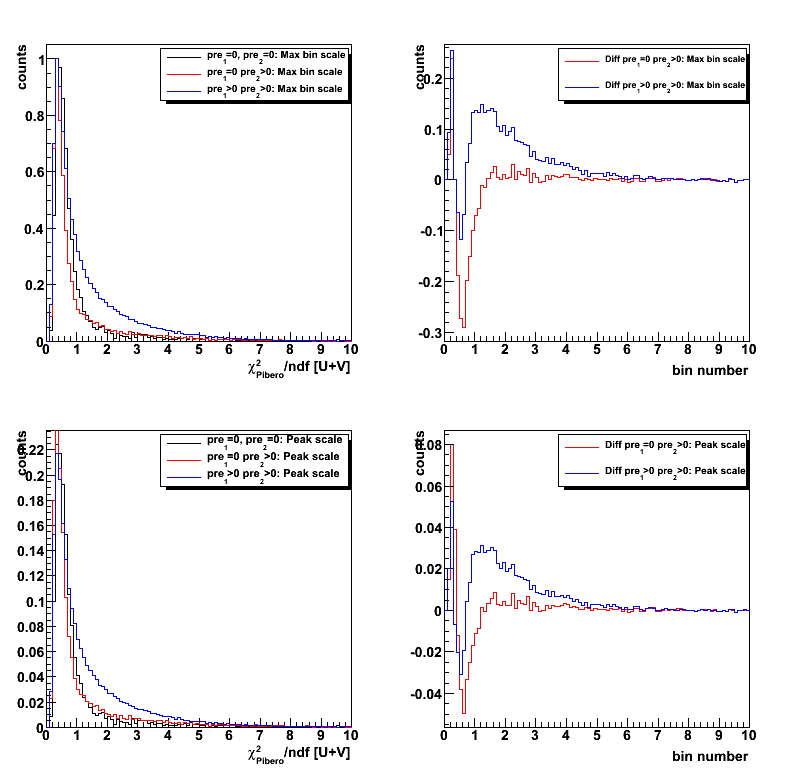
1. Upper left plot shows normalized to unity (at maximum) chi2 distribution (obtained with Pibero shape for gamma-jet candidates) for a different pre1, pre2 conditions
2. Upper right plot shows bin-by-bin difference: a) between normalized chi2 for pre1=0, pre2>0 and pre1=0, pre2=0 (red) and b) between normalized chi2 for pre1>0, pre2>0 and pre1=0, pre2=0 (blue)
3. Bottom left Same as upper right, but normalization were done based on the integral within [-4,4] bins around maximum.
4. Bottom right Same as for upper right, but with a different normalization ([-4,4] bins around maximum)
I have also tried to normalized by the total integral, but the results looks similar.
Figure 1: See description above
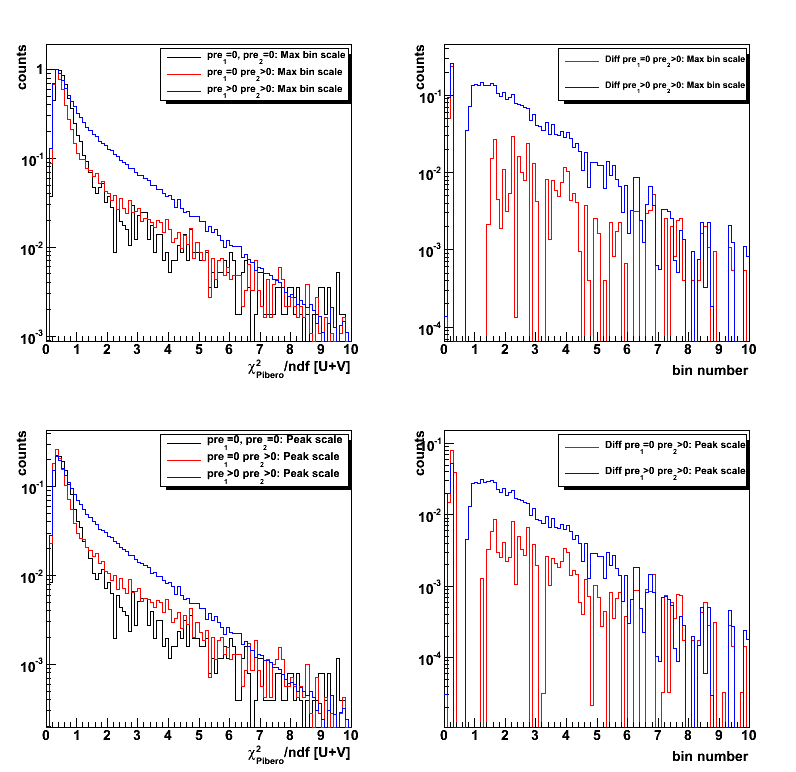
Figure 2: Same without log scale (See description above)
2008.04.09 Applying gamma-jet reconstruction algorithm for gamma-jet simulated events
Ilya Selyuzhenkov April 09, 2008
Data sample:
Monte-Carlo gamma-jet sample for partonic pt range of 5-7, 7-9, 9-11,11-15, 15-25, 25-35 GeV.
Analysis: Simulated MuDst files were first processed through jet finder algorithm (thanks to Renee Fatemi),
and later analyzed by applying gamma-jet isolation cuts (see this link for details) and studying EEMC SMD response (see below).
To test the algorithm, Geant records were not used in this analysis.
Further studies based on Geant records (yield estimates, etc) are ongoing.
EESMD shapes comparison
Figure 1:Comparison between shower shape profile for data and MC.
Black circles shows results for MC gamma-jet sample (all partonic pt).
For v-plane results see this figure
Correlation between gamma and jet pt, eta, phi
Figure 2:Gamma vs jet transverse momentum.
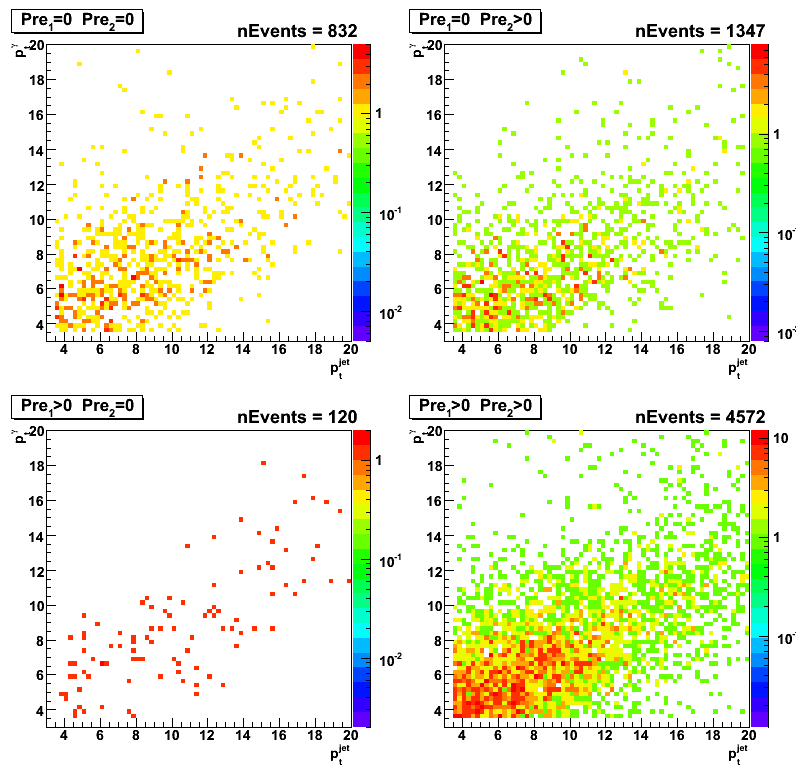
Figure 3:Gamma vs jet azimuthal angle.
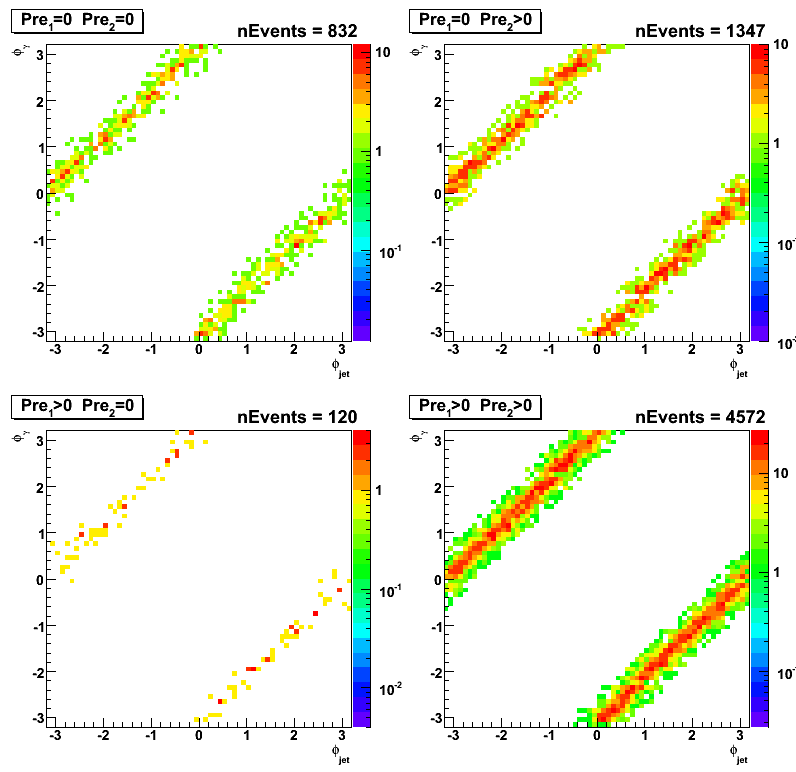
Figure 4:Gamma vs jet pseudo-rapidity.
Results from maximum sided residua study
Definitions for F_peak, D_peak, D_tail^max (D_tail^min) can be found here
Figure 5:F_peak vs maximum residual
for various cuts on energy deposited in the EEMC pre-shower 1 and 2
(within a 3x3 clusters around tower with a maximum energy).
Shower shape used to fit data is fixed to the shape from the previous gamma-jet study of real events
(see black point on Fig.1 [upper left plot] at this page)
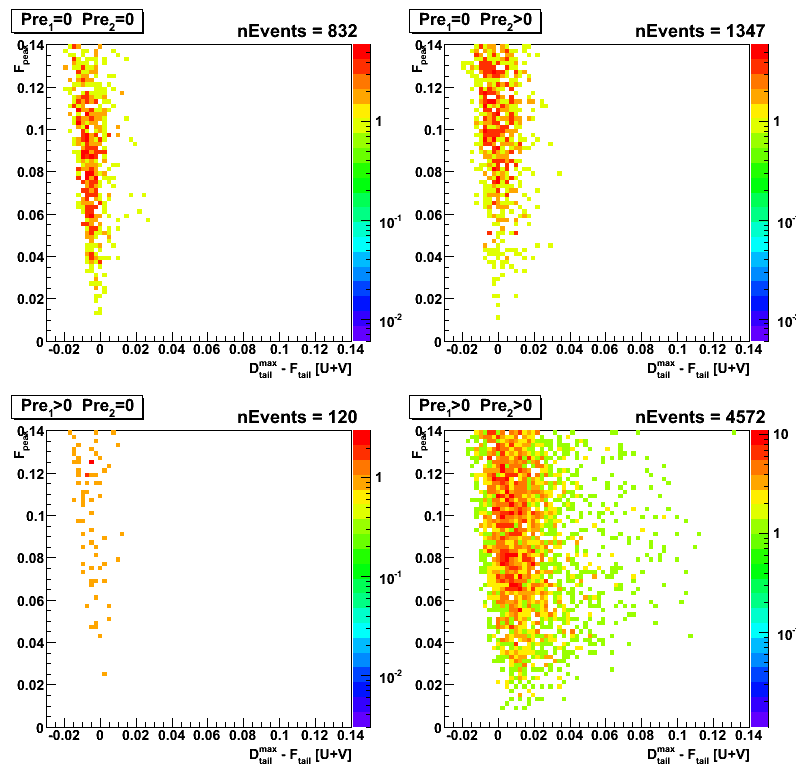
Figure 6: F_peak vs D_tail^max: click here
Figure 7: F_peak vs D_tail^max-D_tail^min: click here
Postshower to SMD[uv] energy ratio
Figure 8:Logarithmic fraction of energy in post shower (3x3 cluster) to the total energy in SMD u- and v-planes
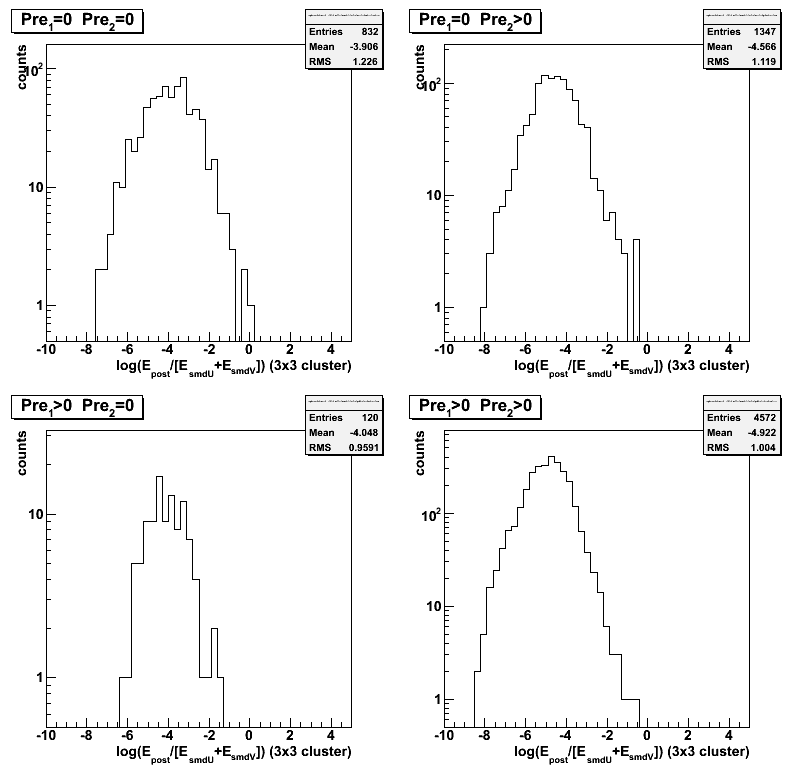
Figure 8a:
Same as figure 8, but for gamma-jet candidates from the real data (no pt cuts).
Logarithmic fraction of energy in post shower (3x3 cluster) to the total energy in SMD u- and v-planes
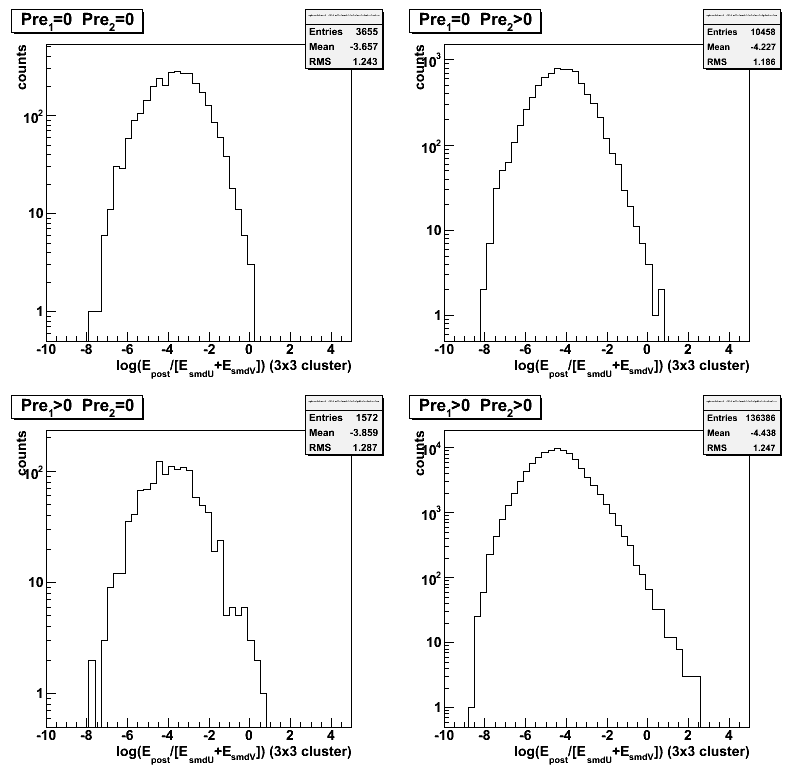
Figure 8b:
Comparison between gamma-jet candidates from data with different preshower conditions.
Points are normalized in peak to the case of pre1 > 0, pre2 > 0
Logarithmic fraction of energy in post shower (3x3 cluster) to the total energy in SMD u- and v-planes
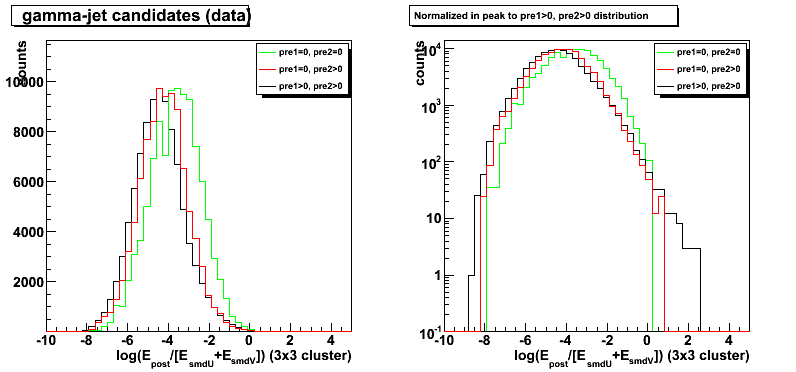
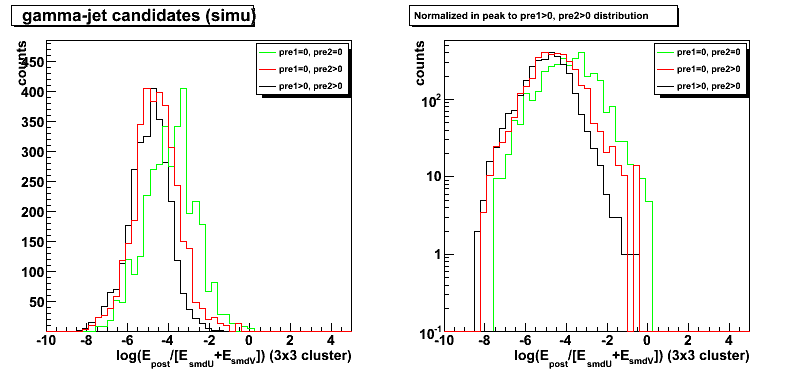
Figure 8c:
Comparison between gamma-jet candidates from Monte-Carlo simulations with different preshower conditions.
Points are normalized in peak to the case of pre1 > 0, pre2 > 0
Logarithmic fraction of energy in post shower (3x3 cluster) to the total energy in SMD u- and v-planes
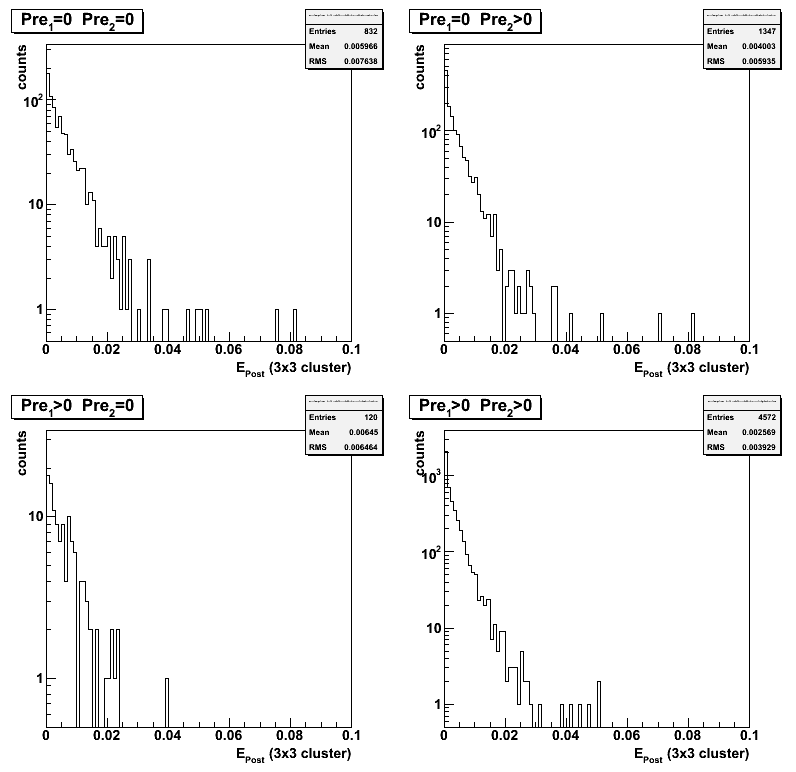
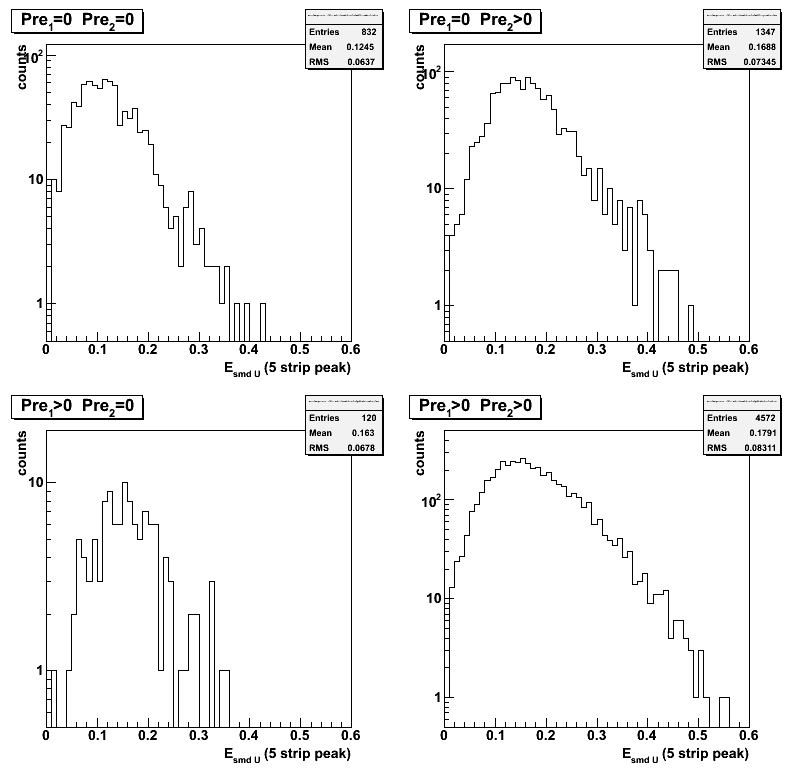
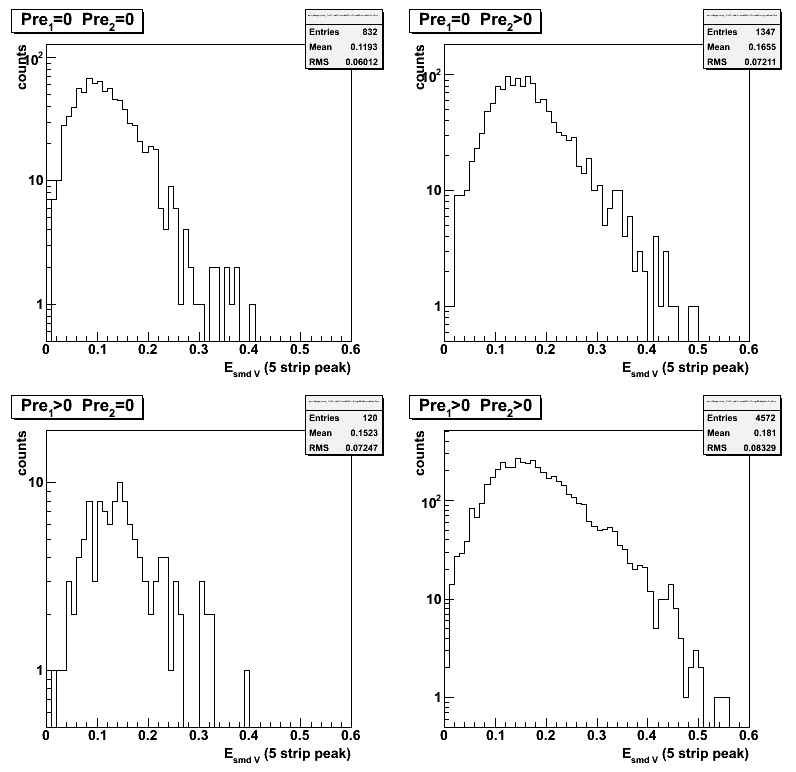
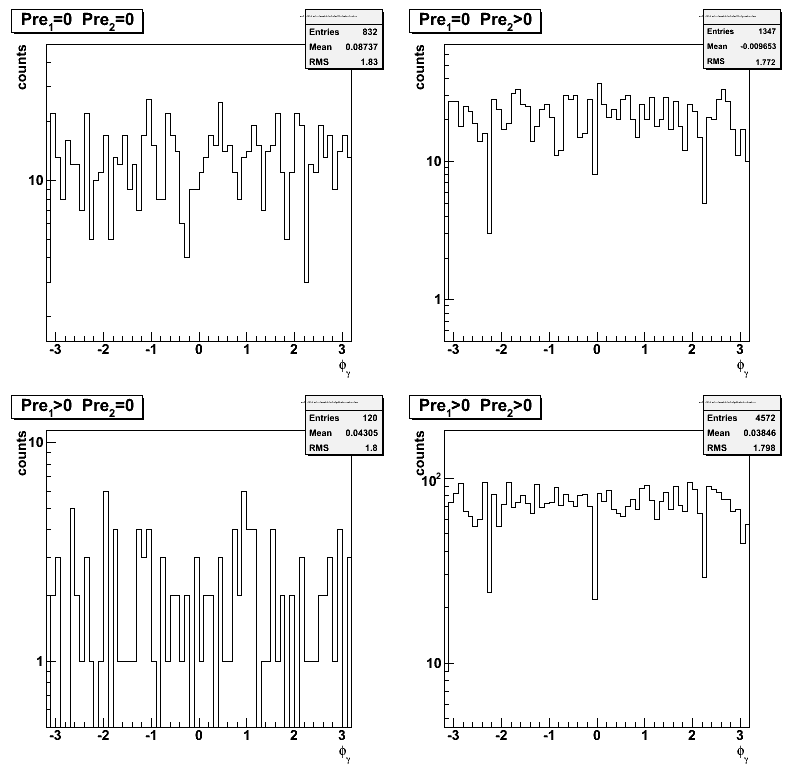
Additional QA plots
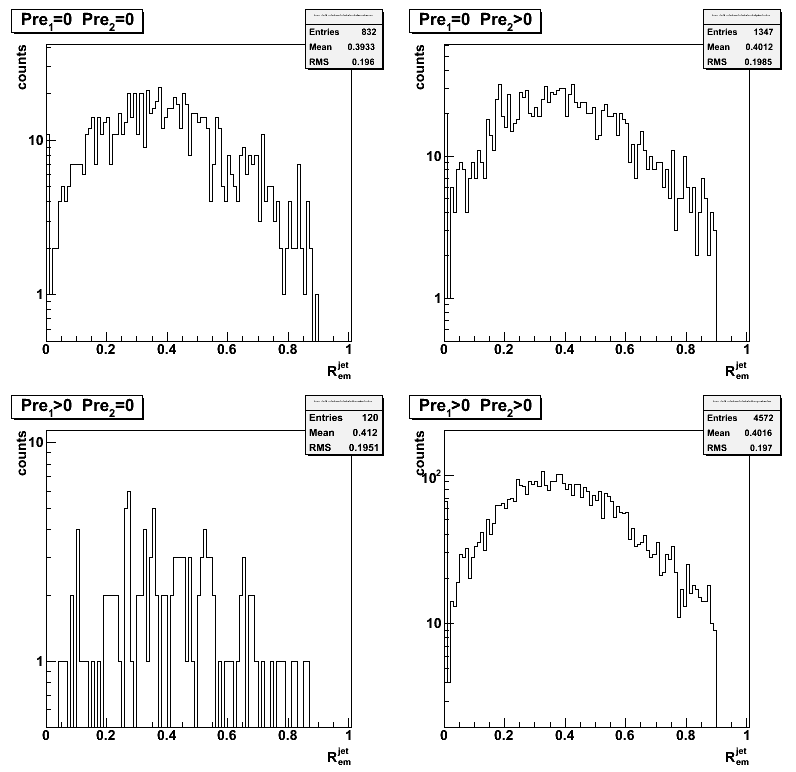
Figure 9: Jet neutral energy fraction
Figure 10: High v-strip vs u-strip
Figure 11: energy post shower (3x3 cluster)
Figure 12: Peak energy SMD-u
Figure 13: Peak energy SMD-v
Figure 14: Gamma phi
Figure 15: Gamma pt
Figure 16: Gamma eta
Figure 17: Delta gamma-jet pt
Figure 18: Delta gamma-jet eta
Figure 19: Delta gamma-jet phi
chi2 distributions
Figure 20:chi2 distribution using "standard" MC shape
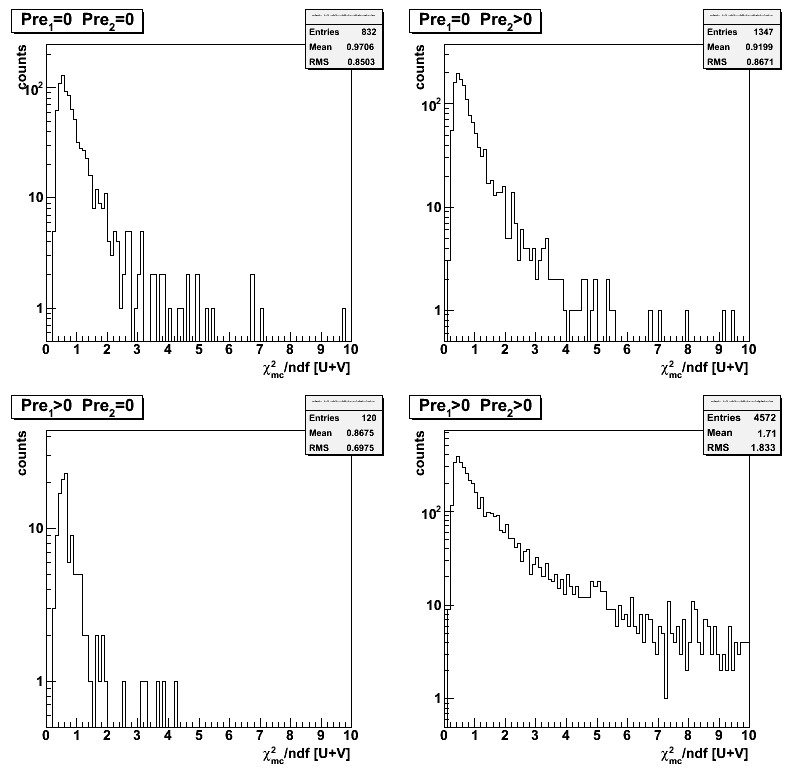
Figure 21:chi2 distribution using Pibero shape
2008.04.16 Sided residual: Data Driven MC vs raw MC vs 2006 data
Ilya Selyuzhenkov April 16, 2008
Figure 1: Sided residual for raw MC (partonic pt 9-11)
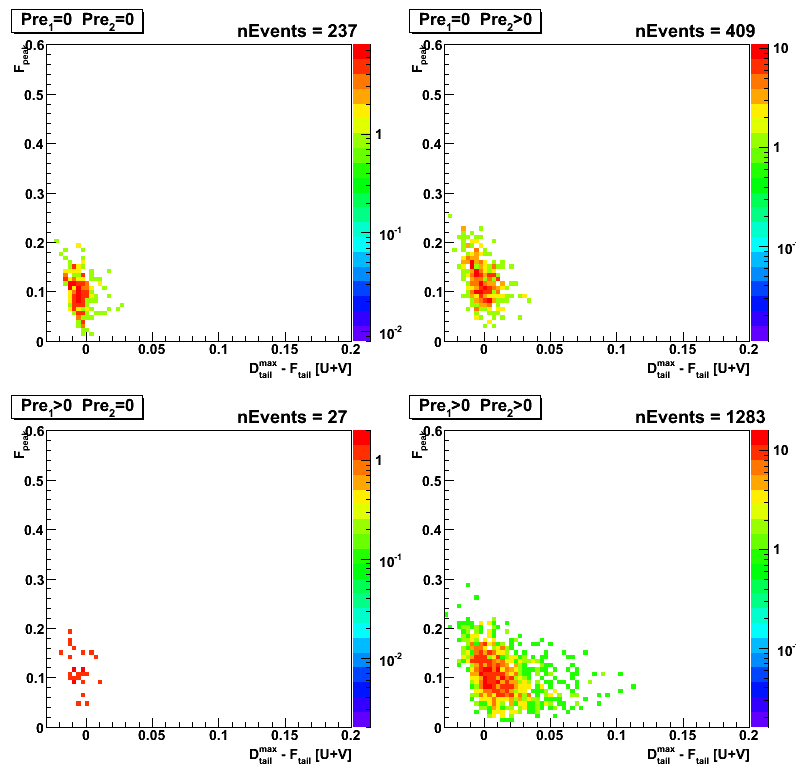
Figure 2: Sided residual for data-driven MC (partonic pt 9-11)
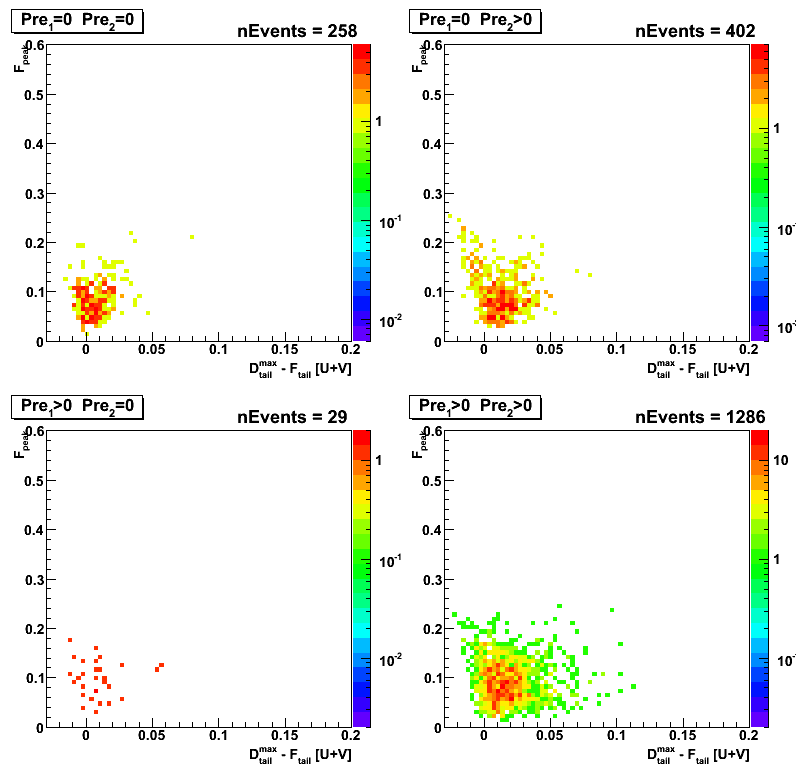
Figure 3: Sided residual for data (pp Longitudinal 2006)
Different analysis cuts vs number of events which passed the cut
- N_events : total number of di-jet events found by the jet-finder for gamma in eta region [1,2]
(Geant record is used to get this number) - cos(phi_gamma - phi_jet) < -0.8 : gamma-jet opposite in phi
- R_{3x3cluster} > 0.9 : Energy in 3x3 cluster of EEMC tower to the total jet energy.
- R_EM^jet < 0.9 : neutral energy fraction cut for on away side jet
- N_ch=0 : no charge tracks associated with a gamma candidate
- N_bTow = 0 : no barrel towers associated with a gamma candidate (gamma in the endcap)
- N_(5-strip clusler)^u > 3 : minimum number of strips in EEMC SMD u-plane cluster around peak
- N_(5-strip cluster)^v > 3 : minimum number of strips in EEMC SMD v-plane cluster around peak
- gamma-algo fail : my algorithm failed to match tower with SMD uv-intersection, etc...
- Tow:SMD match : SMD uv-intersection has a tower which is not in a 3x3 cluser
Figure 4: Number of events which passed various cuts (MC data, partonic pt 9-11)
2008.04.17 Sided residual: Data Driven MC vs raw MC (partonic pt=5-35) vs 2006 data
Ilya Selyuzhenkov April 17, 2008
MC data for different pt weigted according to Michael Betancourt web page:
weight = xSection[ptBin] / xSection[max] / nFiles
Figure 1: Sided residual for raw MC (partonic pt 5-35)
(same plot for partonic pt 9-11)
Figure 2: Sided residual for data-driven MC (partonic pt 5-35)
(same plot for partonic pt 9-11)
Figure 3: Sided residual for data (pp Longitudinal 2006)
Figure 4: Sided residual for data (pp Longitudinal 2006)
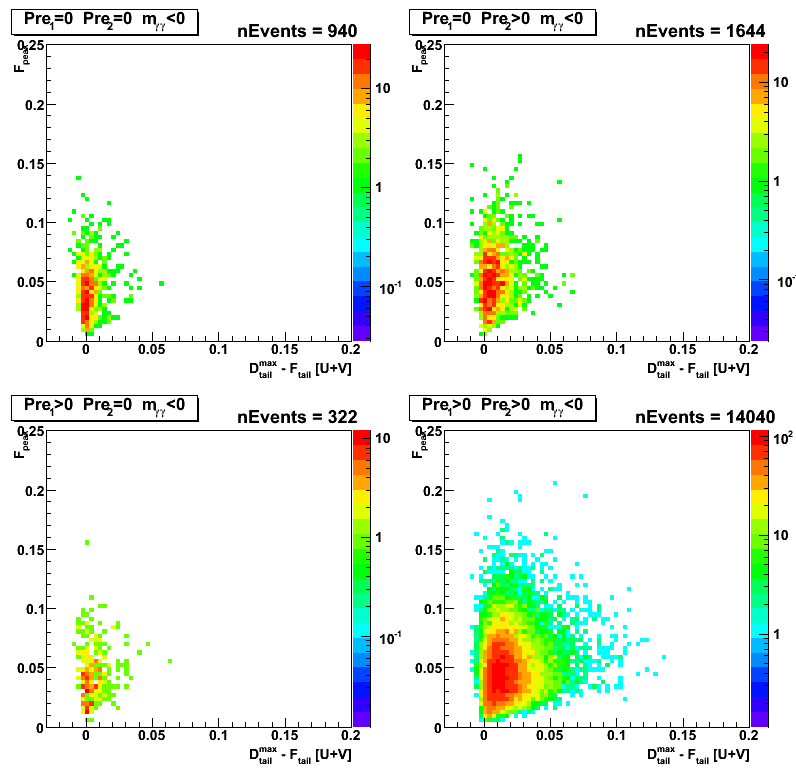
Figure 5: Sided residual for data (pp Longitudinal 2006)
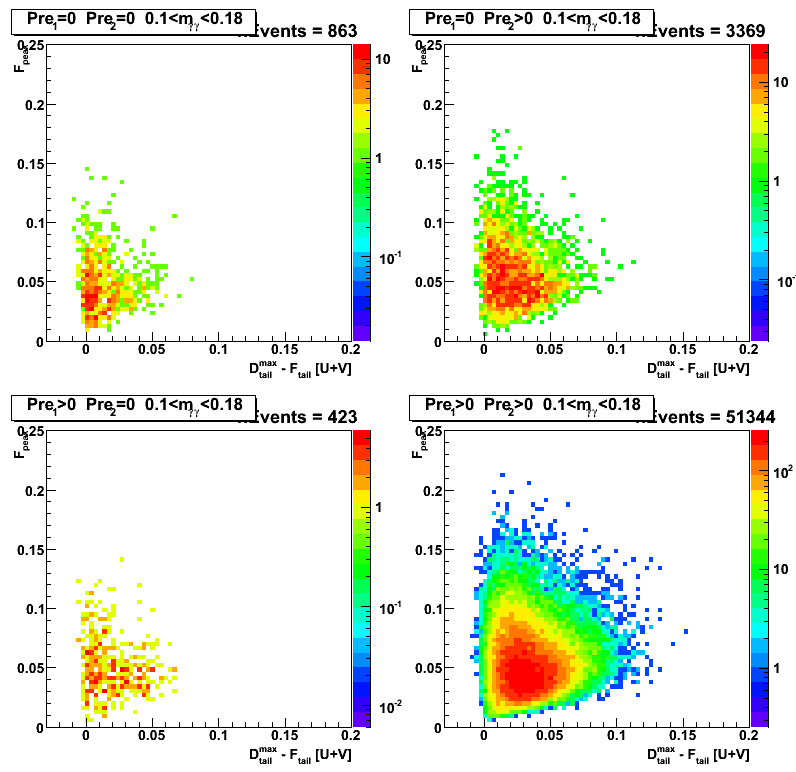
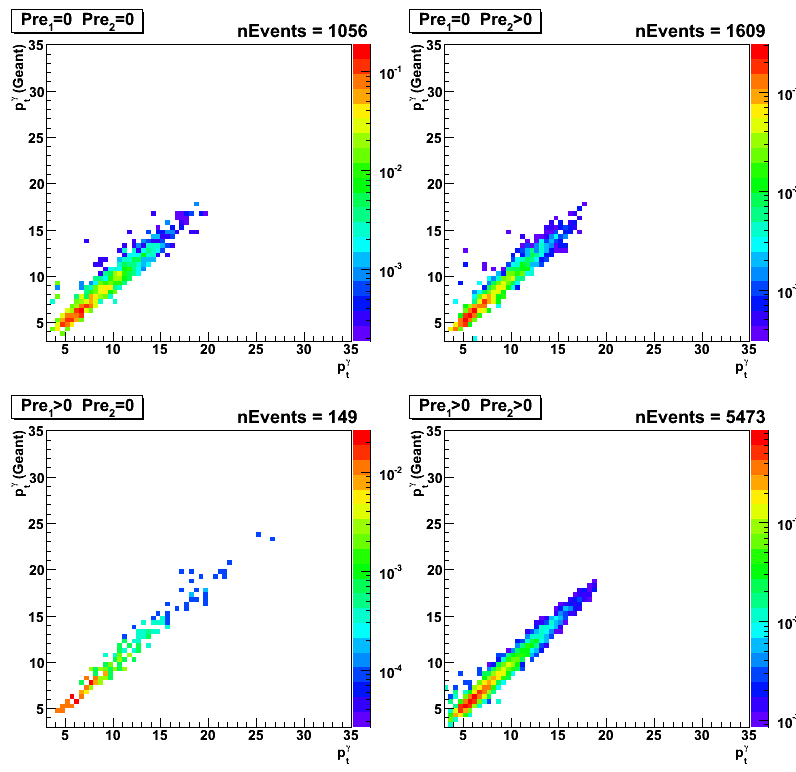
Figure 6: pt(gamma) from geant record vs
pt(gamma) from energy in 3x3 tower cluster and position for uv-intersection wrt vertex
(same on a linear scale)
Figure 7: pt(gamma) from geant record vs
pt(jet) as found by the jet-finder
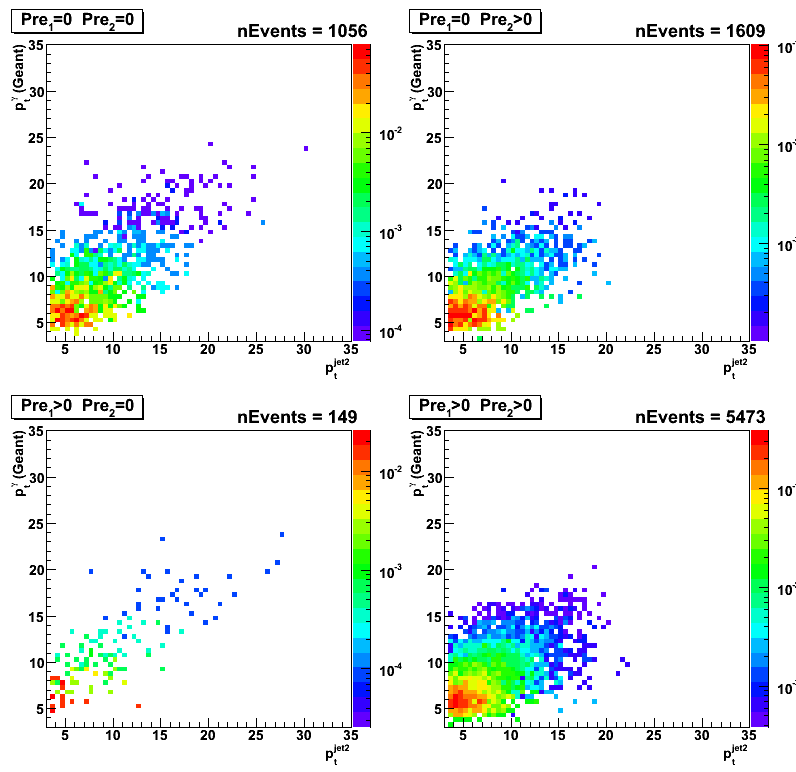
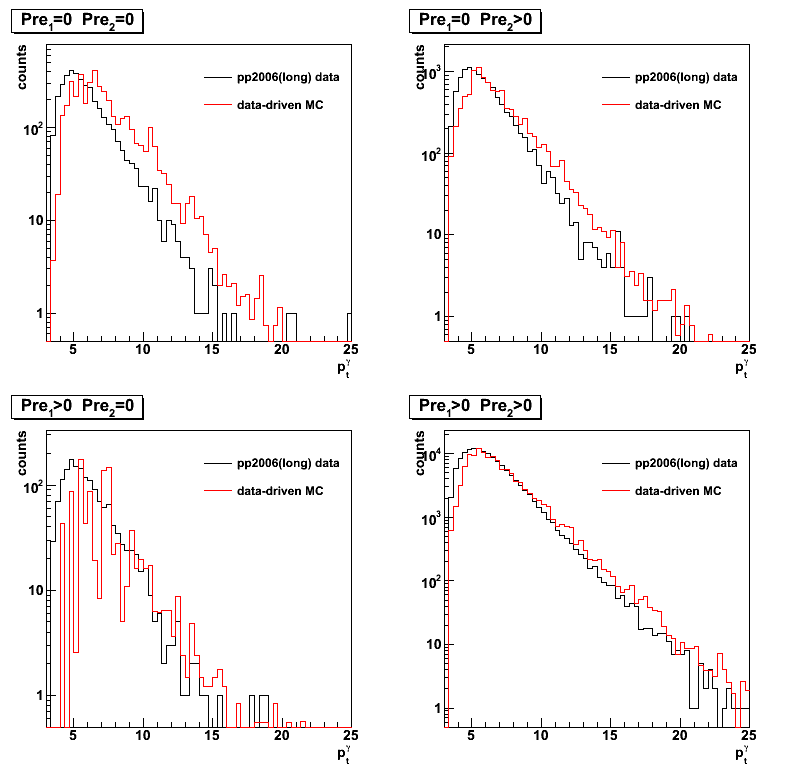
Figure 8: gamma pt distribution:
data-driven MC (red) vs gamma-jet candidates from pp2006 longitudinal run (black).
MC distribution normalized to data at maximum for each preshower condition
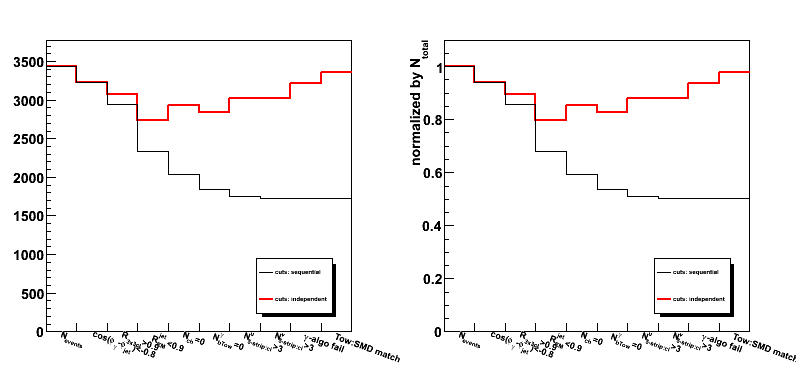
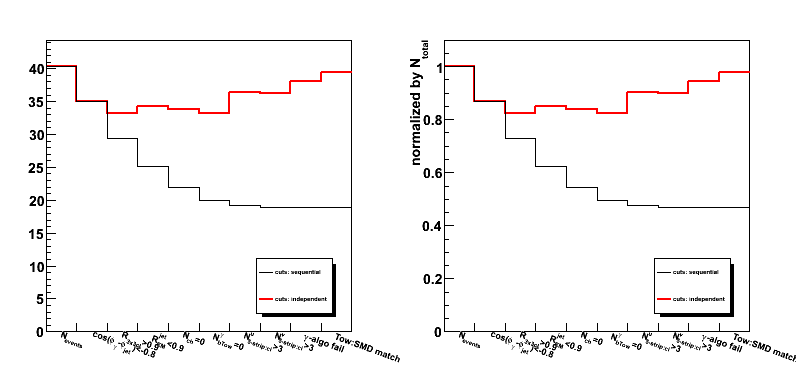
Different analysis cuts vs number of events which passed the cut
- N_events : total number of di-jet events found by the jet-finder for gamma in eta region [1,2]
(Geant record is used to get this number) - cos(phi_gamma - phi_jet) < -0.8 : gamma-jet opposite in phi
- R_{3x3cluster} > 0.9 : Energy in 3x3 cluster of EEMC tower to the total jet energy.
- R_EM^jet < 0.9 : neutral energy fraction cut for on away side jet
- N_ch=0 : no charge tracks associated with a gamma candidate
- N_bTow = 0 : no barrel towers associated with a gamma candidate (gamma in the endcap)
- N_(5-strip clusler)^u > 3 : minimum number of strips in EEMC SMD u-plane cluster around peak
- N_(5-strip cluster)^v > 3 : minimum number of strips in EEMC SMD v-plane cluster around peak
- gamma-algo fail : my algorithm failed to match tower with SMD uv-intersection, etc...
- Tow:SMD match : SMD uv-intersection has a tower which is not in a 3x3 cluser
Figure 9: Number of events which passed various cuts (MC data, partonic pt 5-35)
Red: cuts applied independent
Black: cuts applied sequential from left to right
2008.04.23 Gamma-jet candidates: pp2006 data vs data-driven MC (gamma-jet and bg:jet-jet)
Ilya Selyuzhenkov April 23, 2008
Sided residual: pp2006 data vs data-driven MC (gamma-jet and bg:jet-jet)
MC data for different partonic pt are weigted according to Michael Betancourt web page:
weight = xSection[ptBin] / xSection[max] / nFiles
Figure 1:Sided residual for data-driven gamma-jet MC events (partonic pt 5-35)
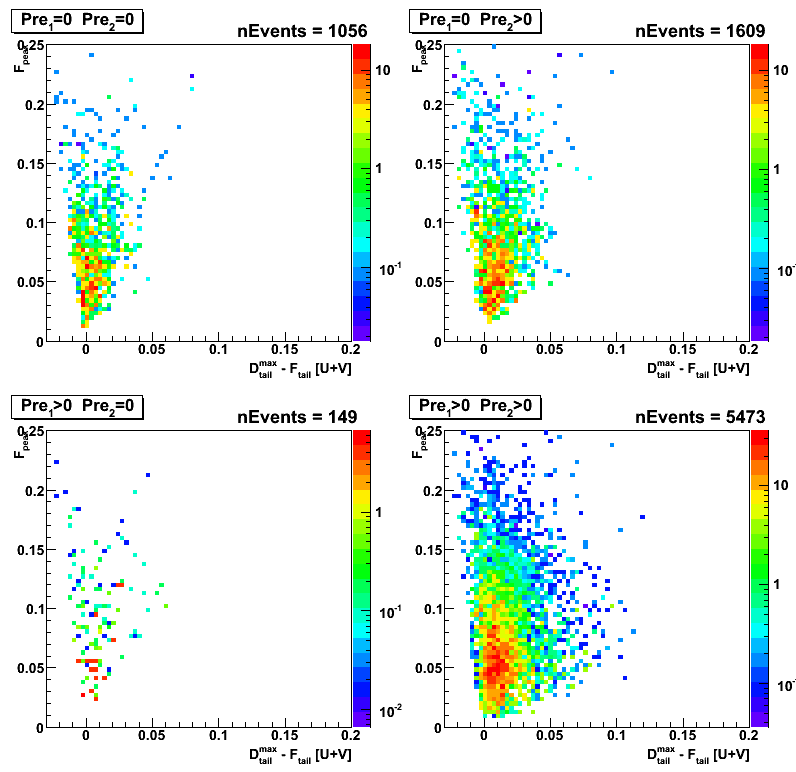
Figure 2:Sided residual for data-driven jet-jet MC events (partonic pt 3-55)
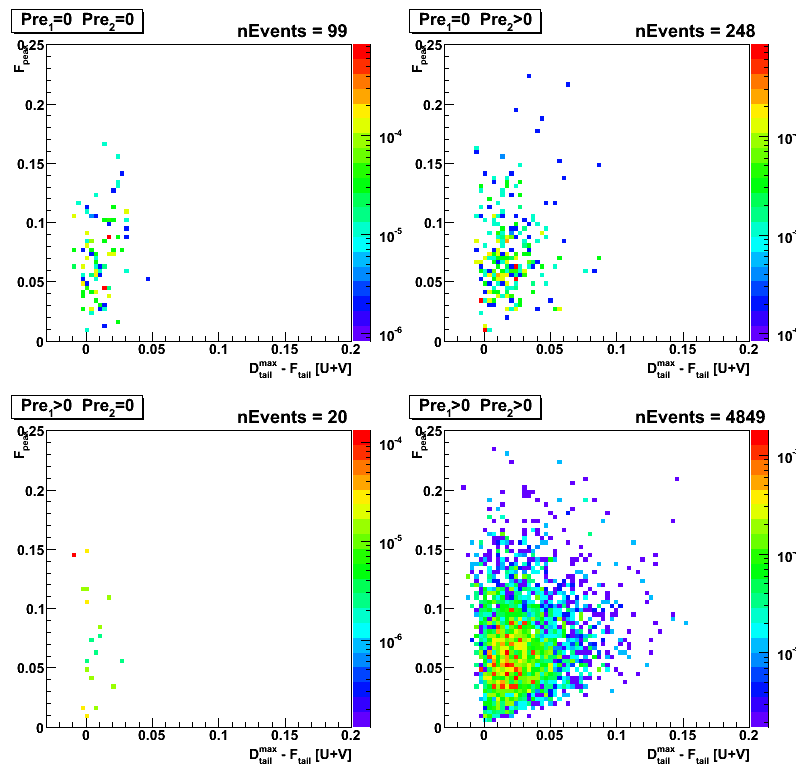
Figure 3:Sided residual for data (pp Longitudinal 2006)
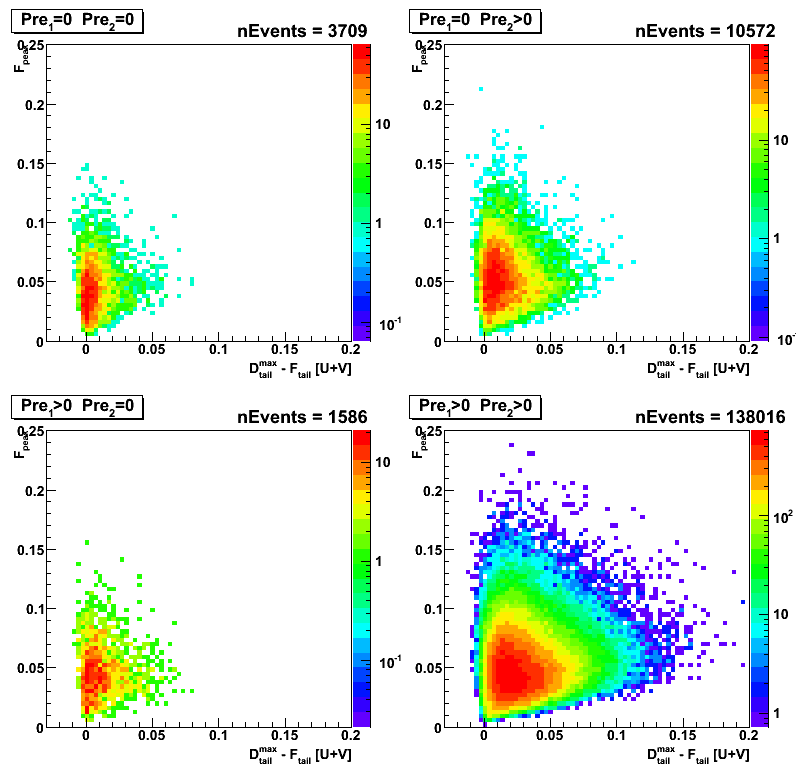
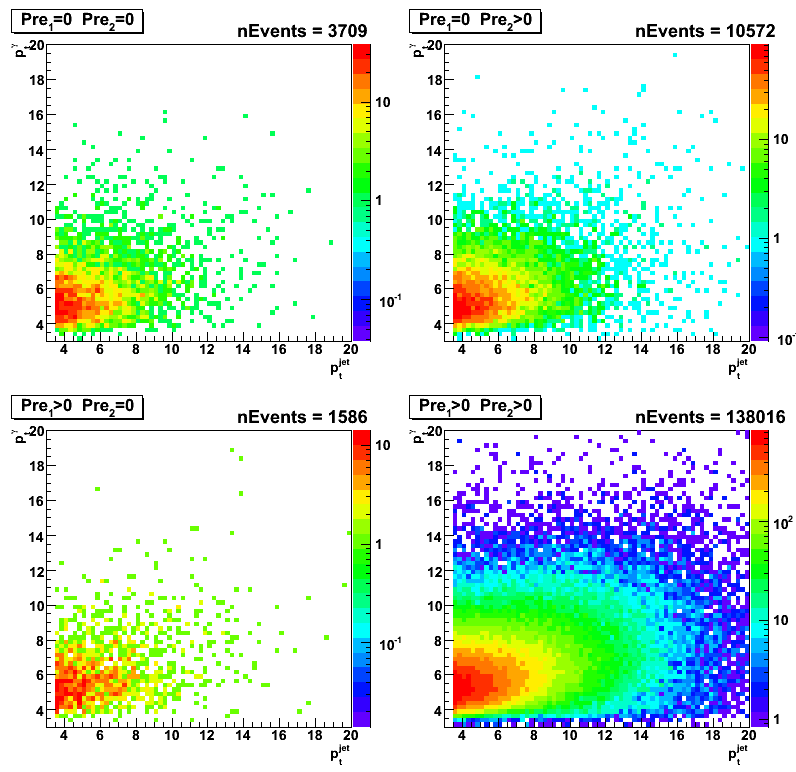
Figure 4:pt(gamma) vs pt(jet) for data-driven gamma-jet MC events (partonic pt 5-35)
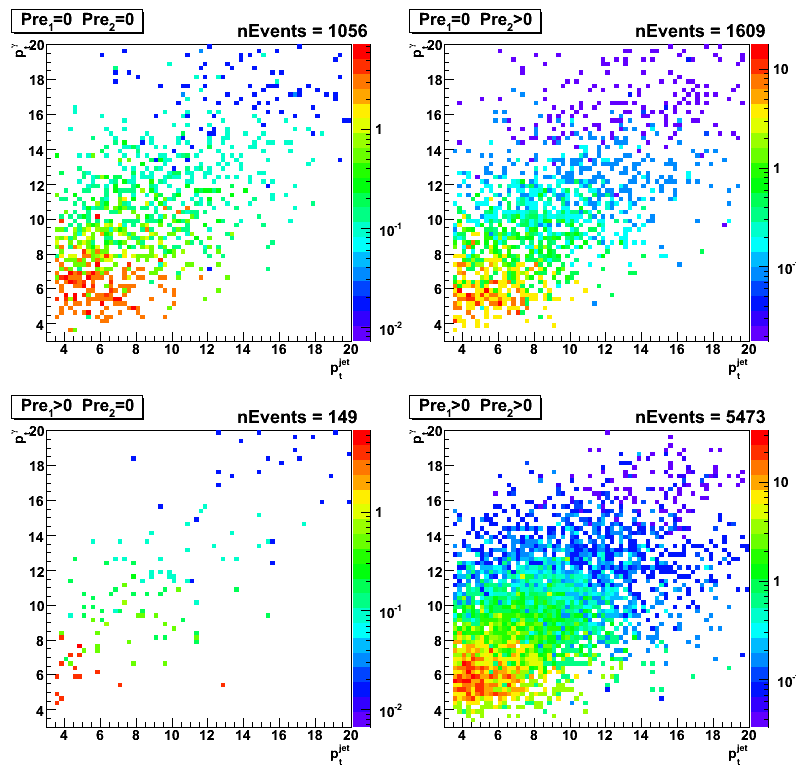
Figure 5:pt(gamma) vs pt(jet) for data-driven jet-jet MC events (partonic pt 3-55)
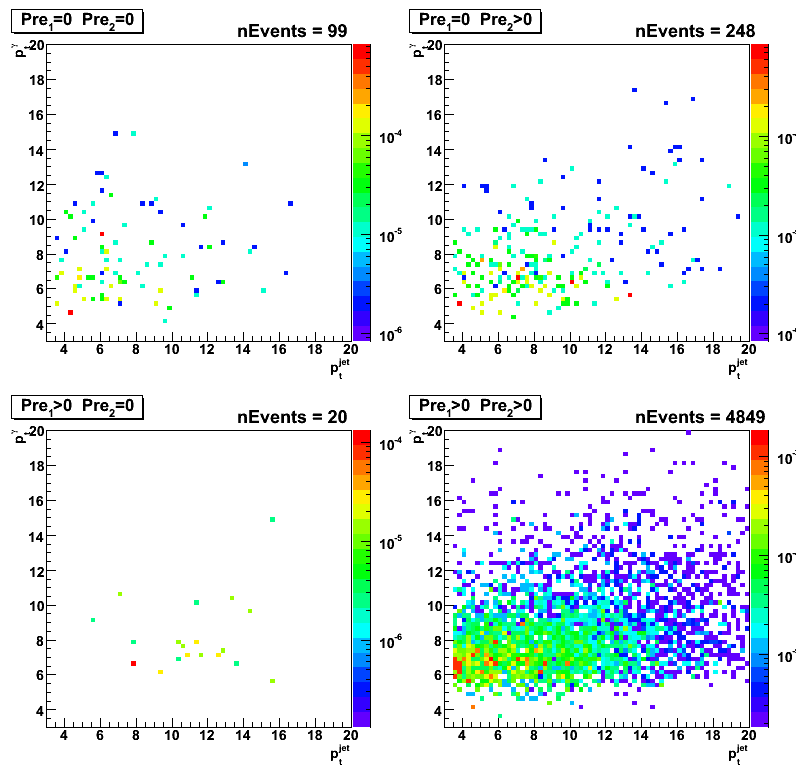
Figure 6:pt(gamma) vs pt(jet) for data (pp Longitudinal 2006)
05 May
May 2008 posts
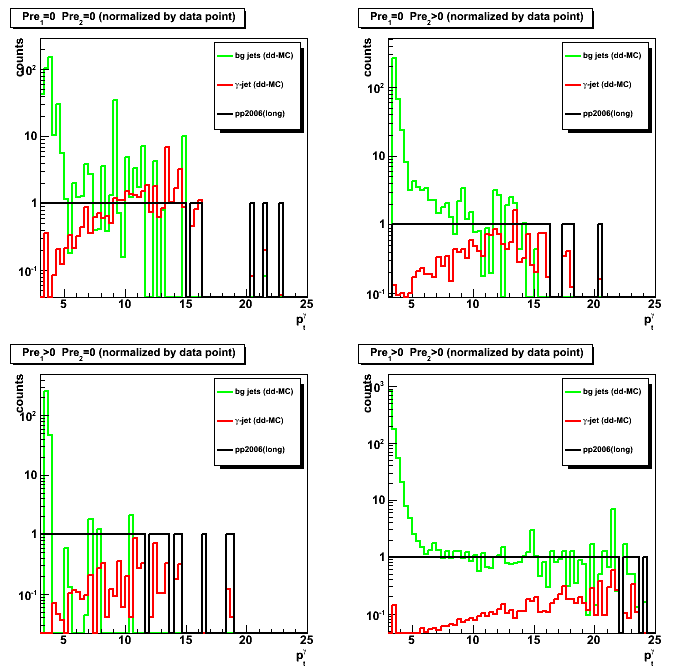
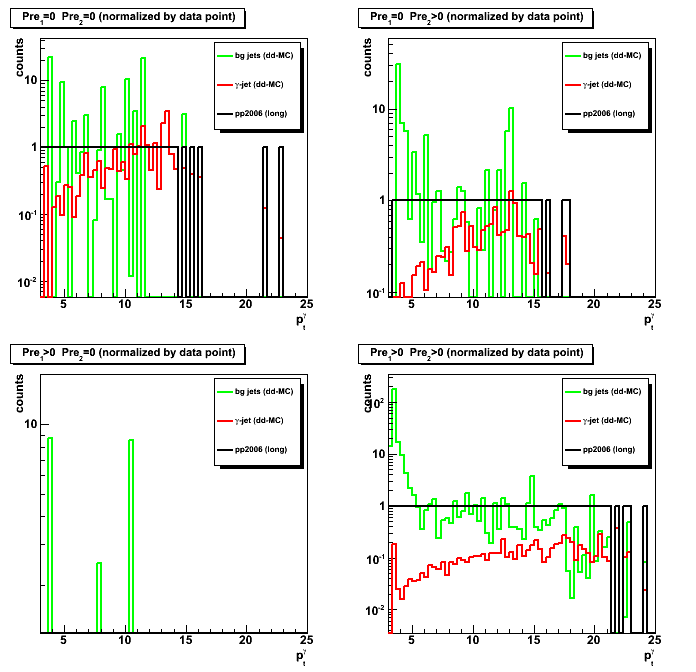
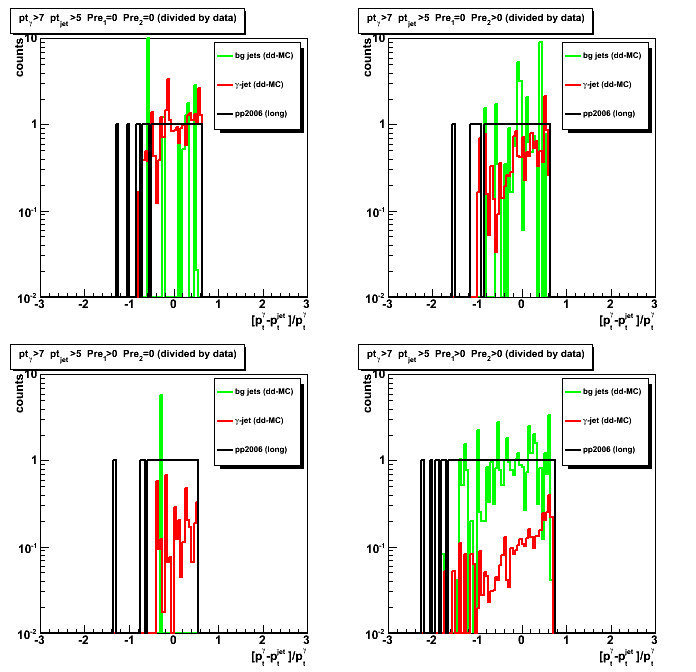
2008.05.05 pt-distributions, sided residual (data vs dd-MC g-jet and bg di-jet)
Ilya Selyuzhenkov May 05, 2008
Data samples:
- pp2006(long) - 2006 pp production longitudinal data after applying gamma-jet aisolation cuts
(jet-tree sample: 4.114pb^-1 from Jamie script, 3.164 pb^1 analyses). - gamma-jet - Pythia gamma-jet sample (~170K events). Partonic pt range 5-35 GeV
- bg jets - Pythia di-jet sample (~4M events). Partonic pt range 3-65 GeV
Figure 1:pt distribution. MC data are scaled to the same luminosity as data
(Normalization factor: Luminosity * sigma / N_events).
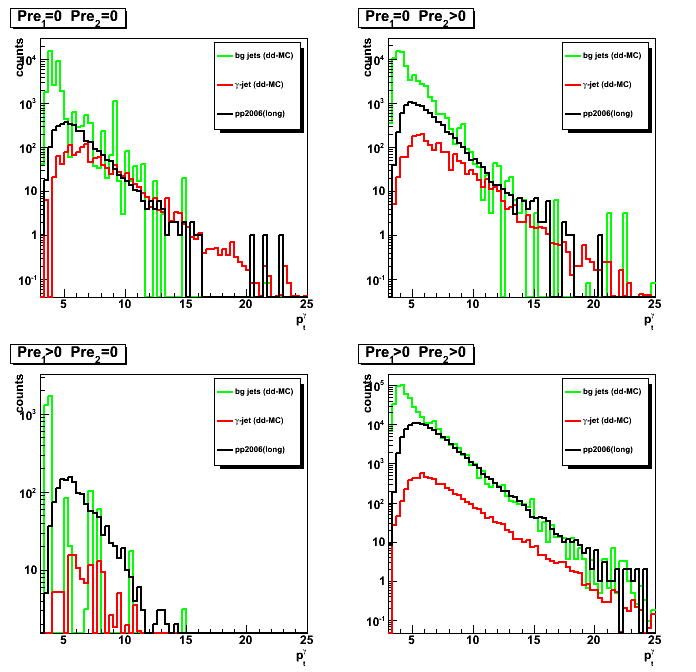
Figure 2:Integrated gamma yield vs pt.
For each pt bin yield is defined as the integral from this pt up to the maximum available pt.
MC data are scaled to the same luminosity as data.
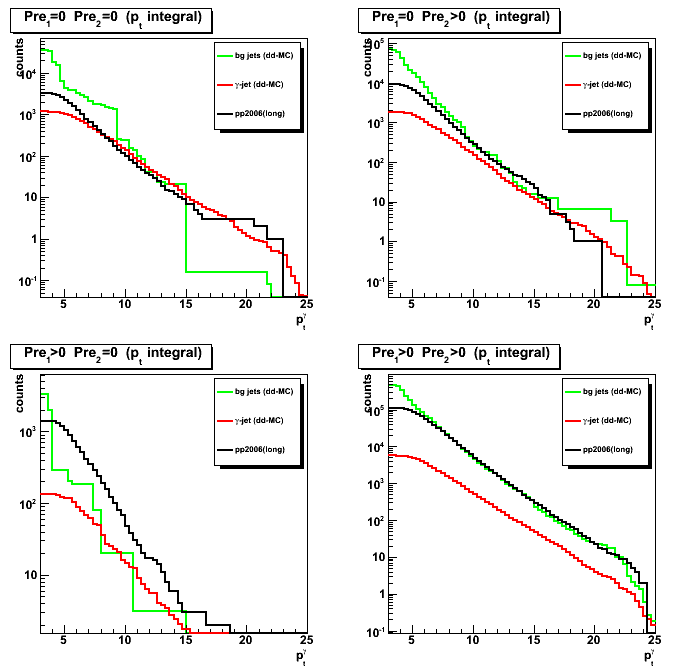
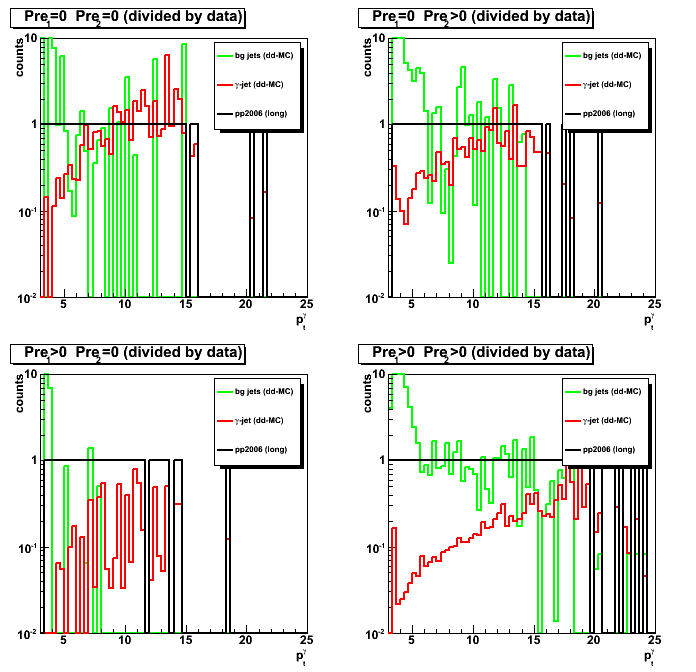
Figure 3:Signal to background ratio (all results divided by the data)
Sided residual: pp2006 data vs data-driven MC (gamma-jet and bg:jet-jet)
You can find sided residual 2-D plots here
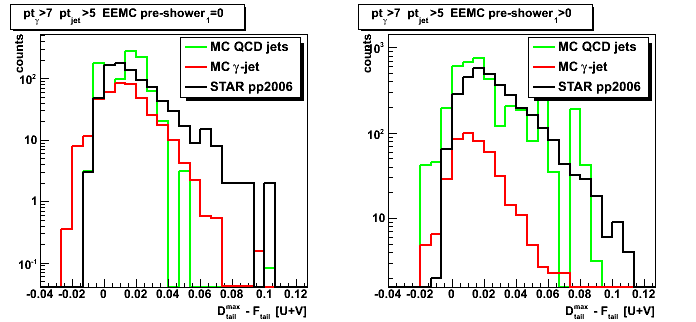
Figure 4:Maximum sided residual for pt_gamma>7GeV; pt_jet>7GeV
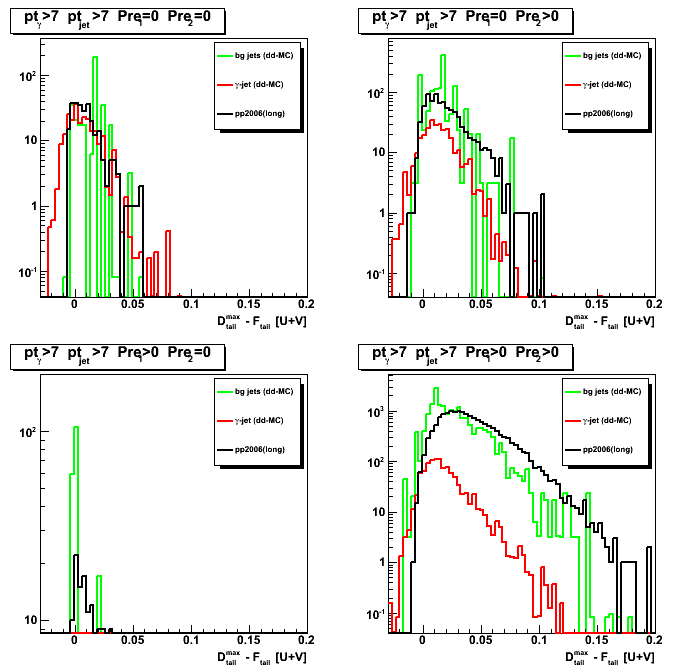
Figure 5:Fitted peak for pt_gamma>7GeV; pt_jet>7GeV
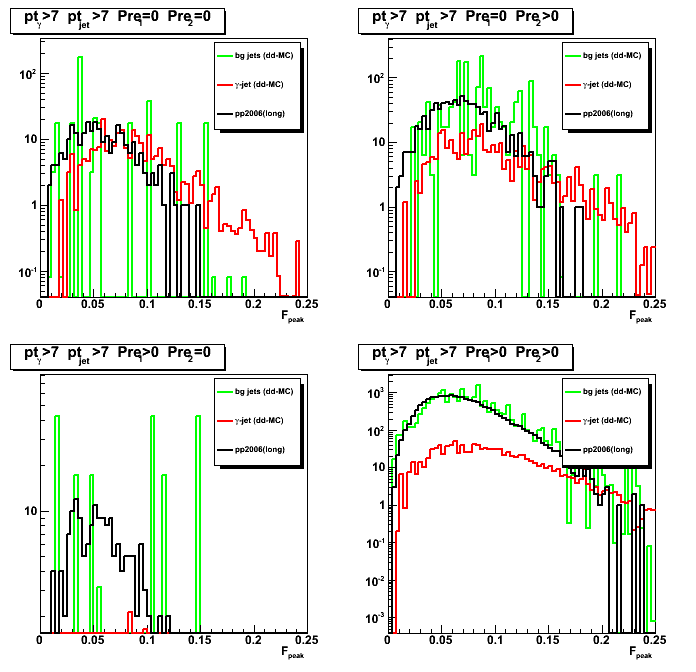
Figure 6:Max data tail for pt_gamma>7GeV; pt_jet>7GeV
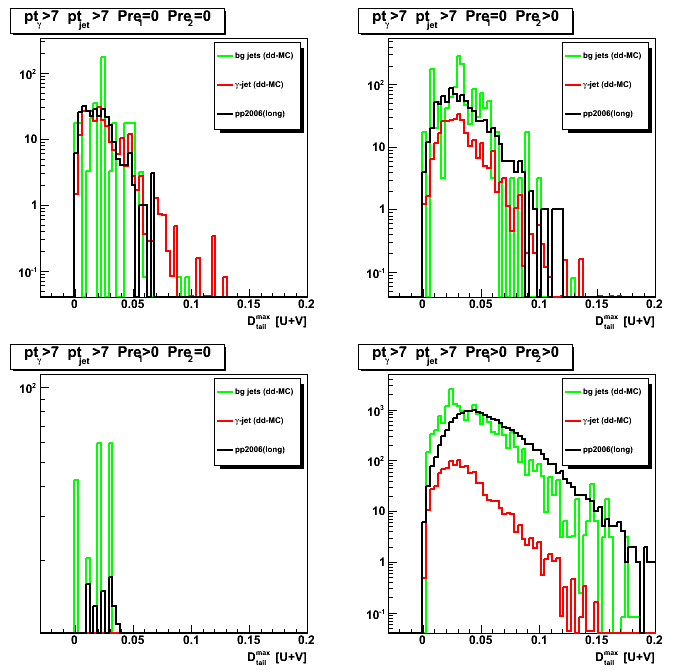
Figure 7:Max minus min data tails for pt_gamma>7GeV; pt_jet>7GeV
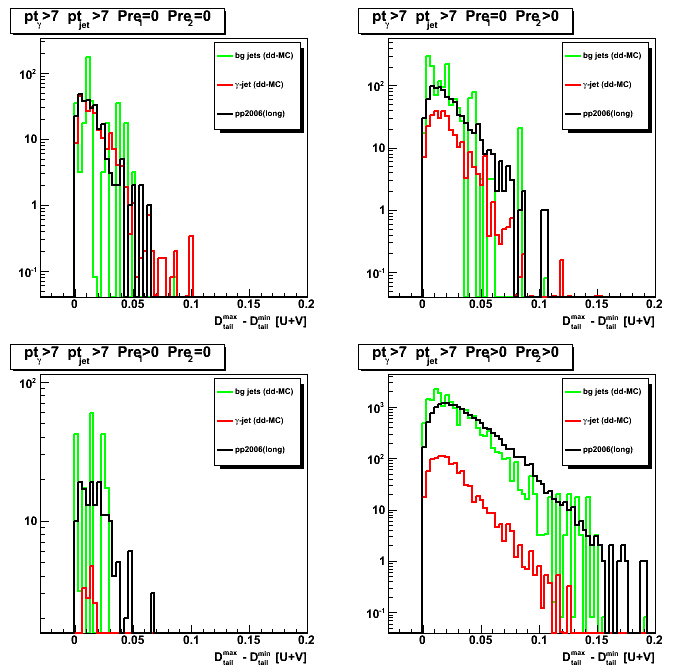
Figure 8:Shower shapes pt_gamma>7GeV; pt_jet>7GeV
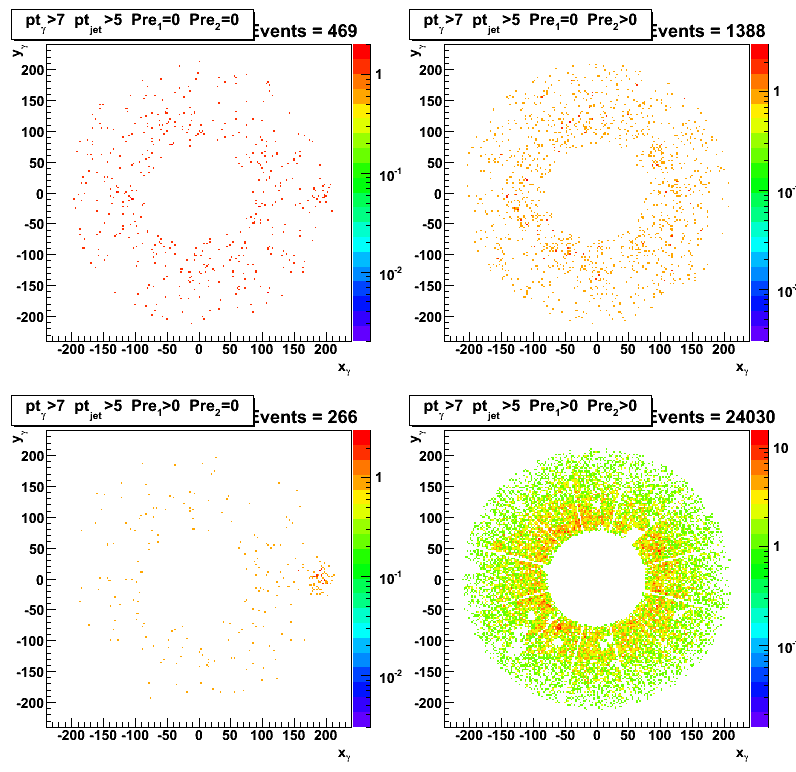
2008.05.08 y:x EEMC position for gamma-jet candidates
Ilya Selyuzhenkov May 08, 2008
y:x EEMC position for gamma-jet candidates
Figure 1:y:x EEMC position for gamma-jet candidates:
Pythia gamma-jet sample (~170K events). Partonic pt range 5-35 GeV.
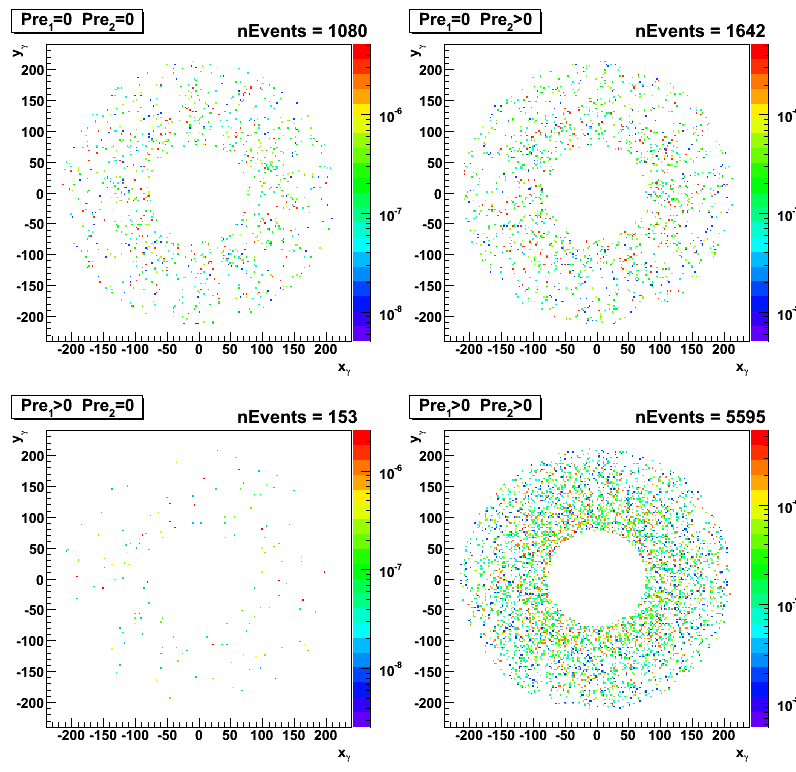
Figure 2:y:x EEMC position for gamma-jet candidates:
Pythia QCD bg sample (~4M events). Partonic pt range 3-65 GeV.
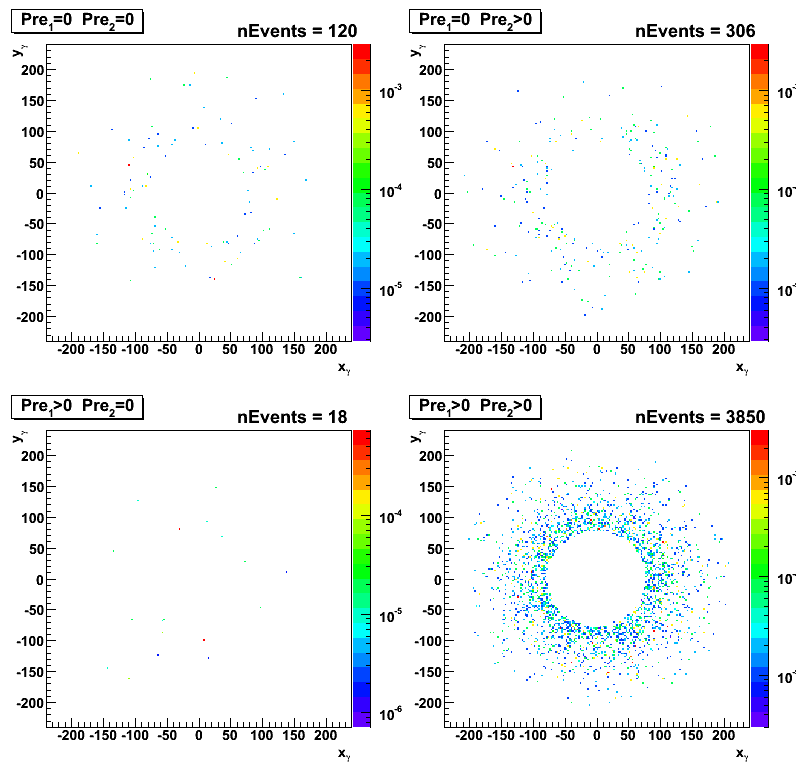
Figure 3:y:x EEMC position for gamma-jet candidates:
pp2006 (long) data [eemc-http-mb-l2gamma:137641 trigger]
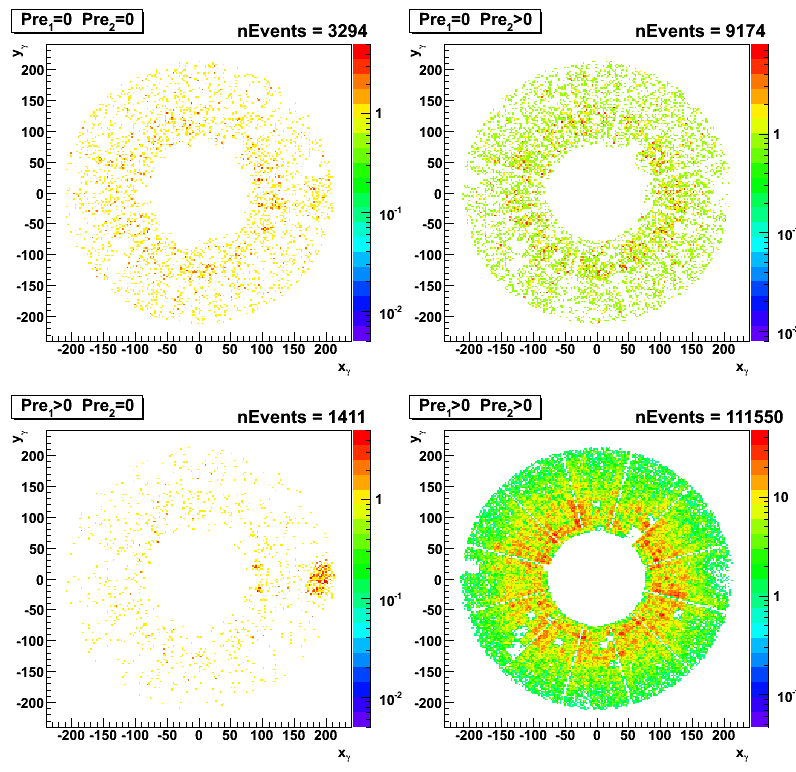
Figure 3b:y:x EEMC position for gamma-jet candidates:
pp2006 (long) data [eemc-http-mb-l2gamma:137641 trigger]
pt cut of 7 GeV for gamma and 5GeV for the away side jet has been applied.
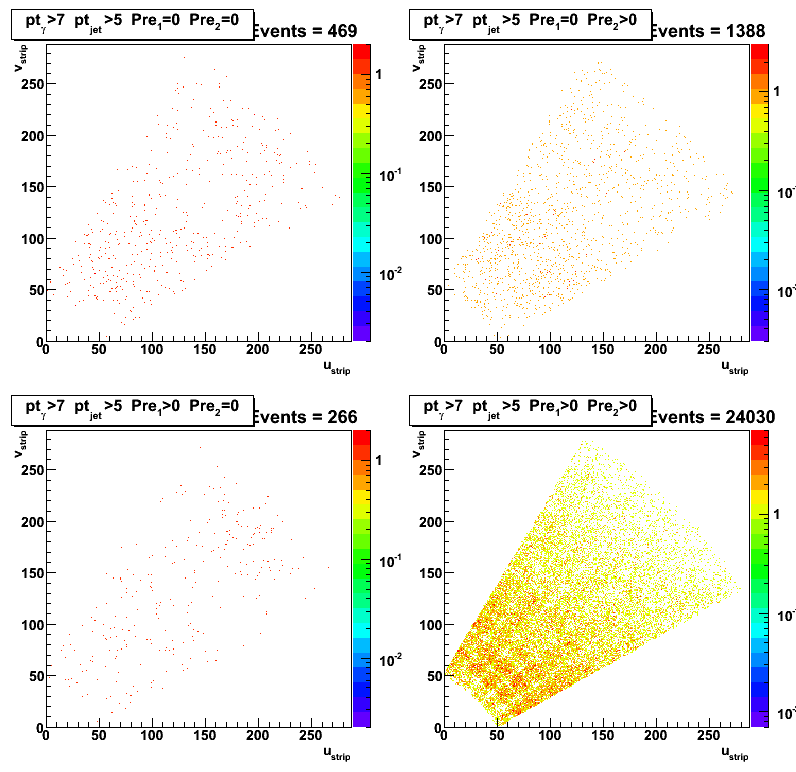
high u vs. v strip for gamma-jet candidates
Figure 4:High v-strip vs high u-strip.
Pythia gamma-jet sample (~170K events). Partonic pt range 5-35 GeV.
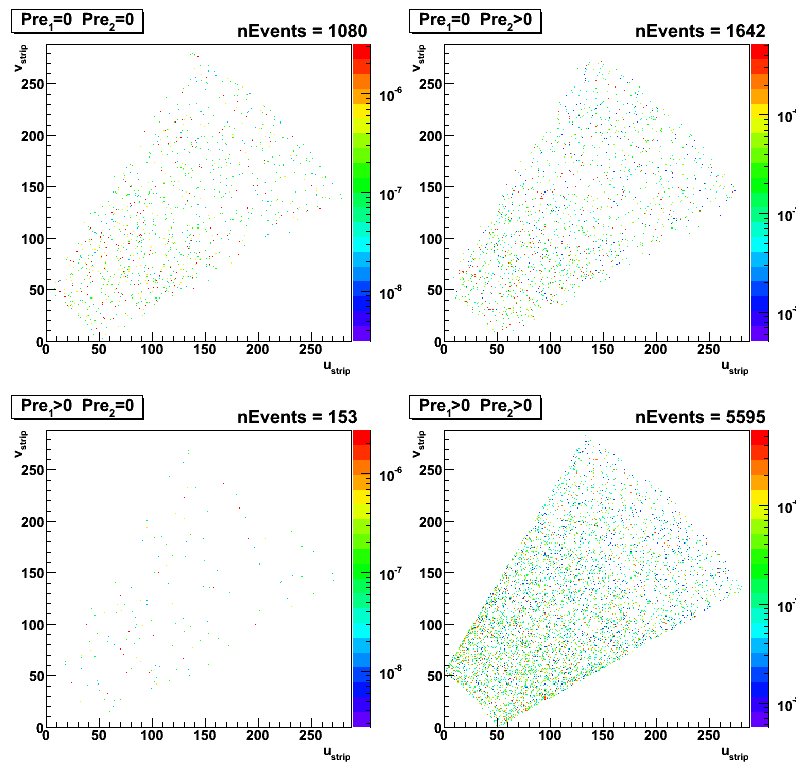
Figure 5:High v-strip vs high u-strip:
Pythia QCD bg sample (~4M events). Partonic pt range 3-65 GeV.
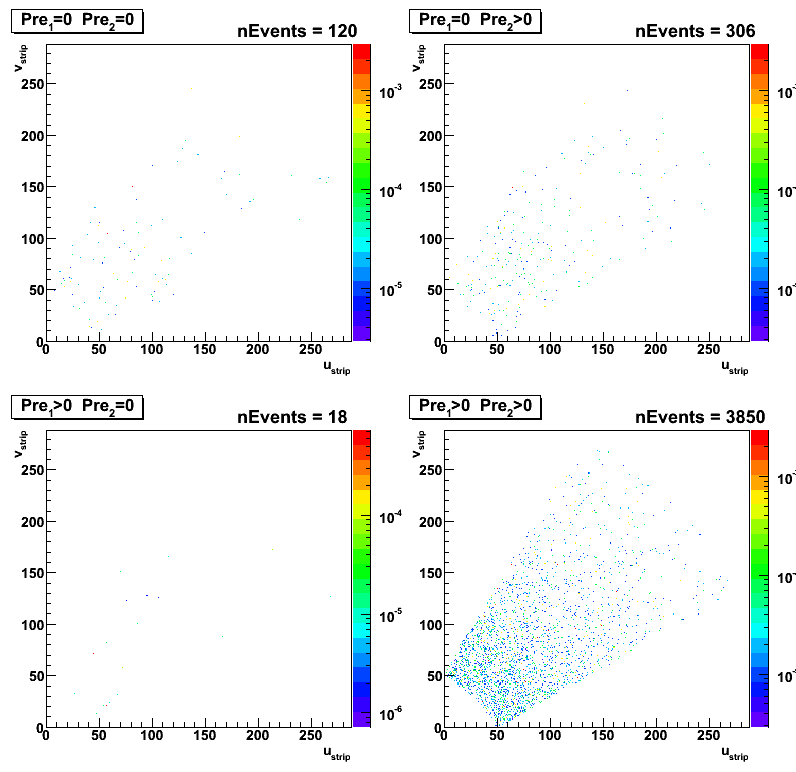
Figure 6:High v-strip vs high u-strip:
pp2006 (long) data [eemc-http-mb-l2gamma:137641 trigger]
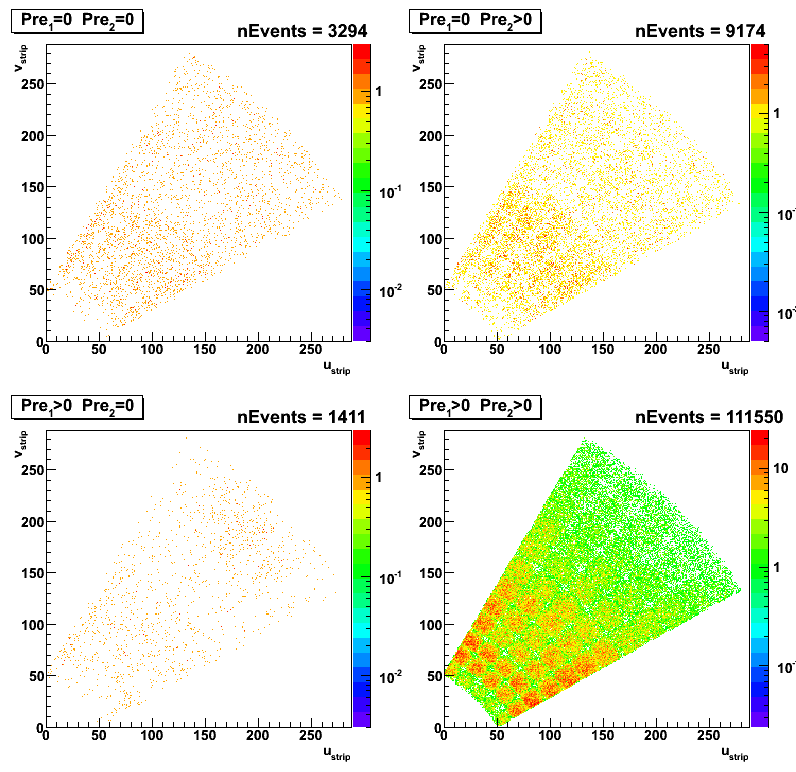
Figure 6b:High v-strip vs high u-strip:
pp2006 (long) data [eemc-http-mb-l2gamma:137641 trigger]
pt cut of 7 GeV for gamma and 5GeV for the away side jet has been applied.
2008.05.09 Gamma-jet candidates pt-distributions and TPC tracking
Ilya Selyuzhenkov May 09, 2008
Detector eta cut study (1< eta < 1.4):
-
For a three data samples (pp2006 [long], MC gamma-jet, and MC QCD background events)
the EEMC detector eta cut of 1< eta < 1.4 has been applied. -
Although a poor statistics available for MC background QCD sample,
the signal to background ratio (red to green line ratio)
getting closer to 1:3 (expected signal to background ratio from Les study).
Figure 1:Gamma pt distribution. MC data are scaled to the same luminosity as data
(Normalization factor: Luminosity * sigma / N_events).
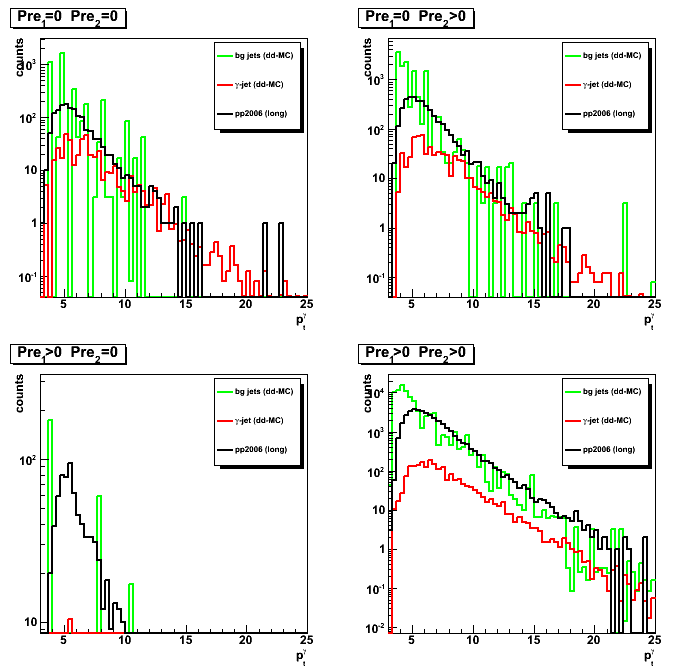
Figure 2:Gamma yield vs pt. MC data are scaled to the same luminosity as data.
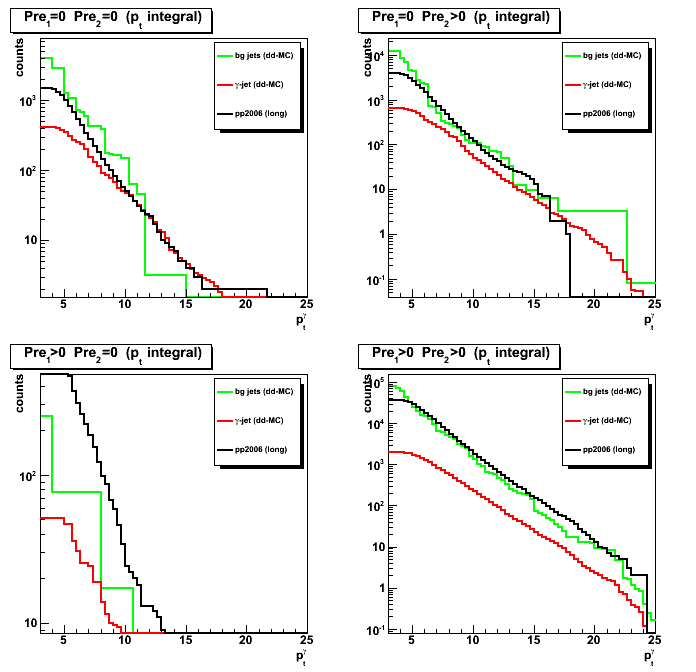
Figure 3:Signal to background ratio (MC results are normalized to the data)
2008.05.14 Gamma-cluster to jet energy ratio and away side jet pt matching
Ilya Selyuzhenkov May 14, 2008
Gamma-cluster to jet1 energy ratio
-
Correlation between gamma-candidate 3x3 cluster energy ratio (R_cluster) and
number of EEMC towers in a jet1 can be found here (Fig. 4). -
Gamma pt distribution, yield and signal to background ratio plots
for a cut of R_cluster >0.9 can be found here (Figs. 1-3). -
Gamma pt distribution, yield and signal to background ratio plots
for a cut of R_cluster >0.99 are shown below in Figs. 1-3.
One can see that by going from R_cluster>0.9 to R_cluster>0.99
improves signal to background ratio from ~ 1:10 to ~ 1:5 for gamma pt>10 GeV
Figure 1:Gamma pt distribution for R_cluster >0.99.
MC results scaled to the same luminosity as data
(Normalization factor: Luminosity * sigma / N_events).
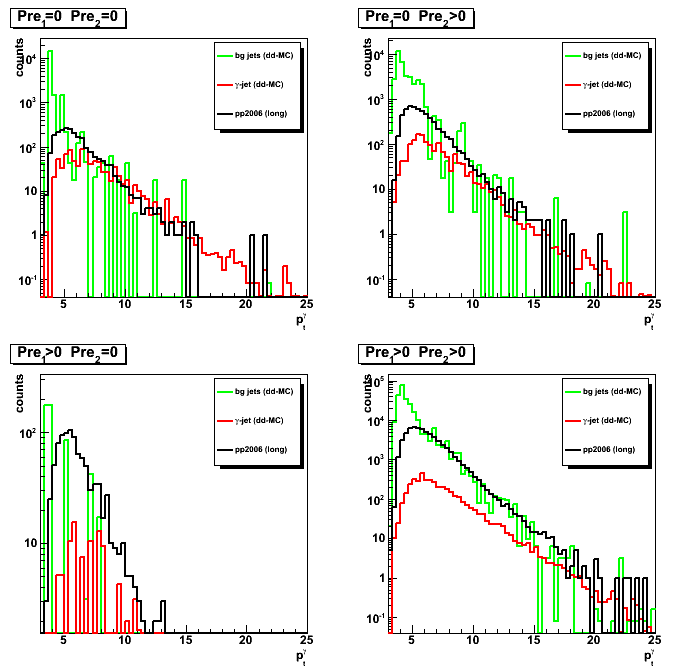
Figure 2:Integrated gamma yield vs pt for R_cluster >0.99
For each pt bin yield is defined as the integral from this pt up to the maximum available pt.
MC results scaled to the same luminosity as data.
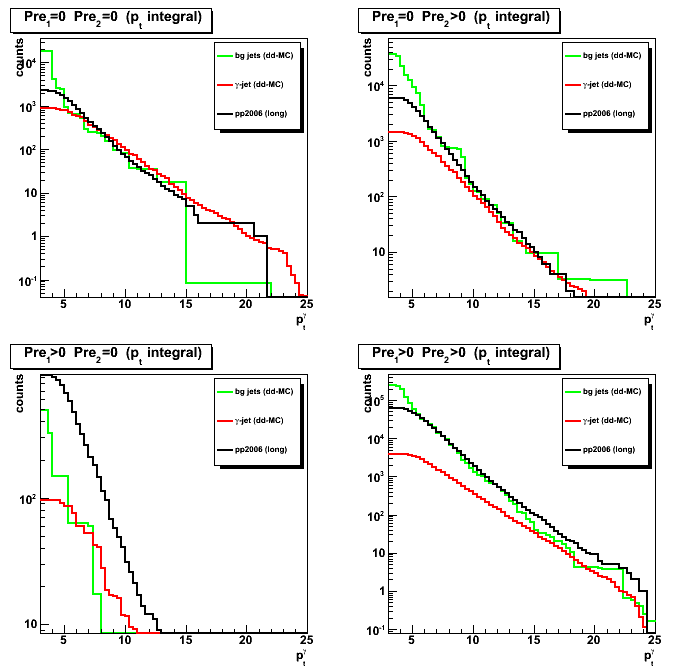
Figure 3:Signal to background ratio for R_cluster >0.99 (all results divided by the data)
Compare this figure with that for R_cluster>0.9 (Fig. 3 at this link)
Gamma and the away side jet pt matching
Figure 4: pt asymmetry between gamma and the away side jet (R_cluster >0.9)
for a three data samples (pp2006[long] data, gamma-jet MC, QCD jets background).
pt cut of 7 GeV for both gamma and jet has been applied.
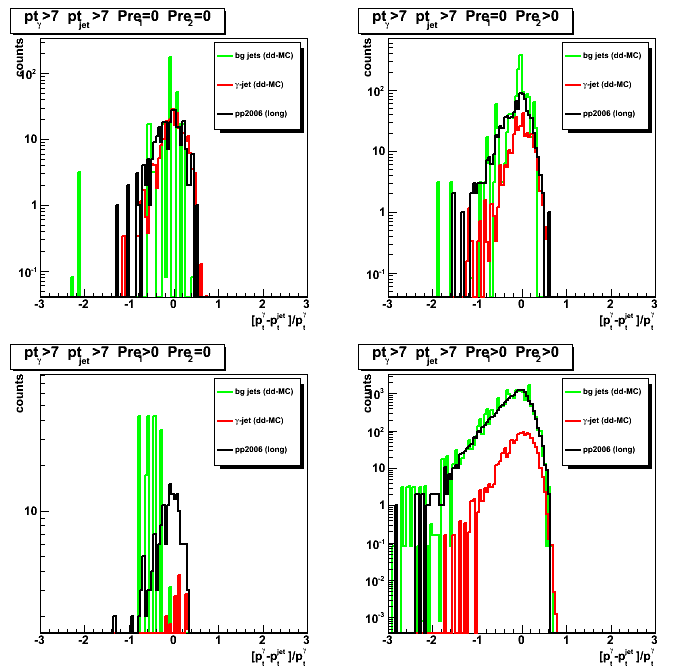
Figure 5: signal to background ratio (R_cluster >0.9)
as a function of pt asymmetry between gamma and the away side jet
pt cut of 7 GeV for both gamma and jet has been applied.
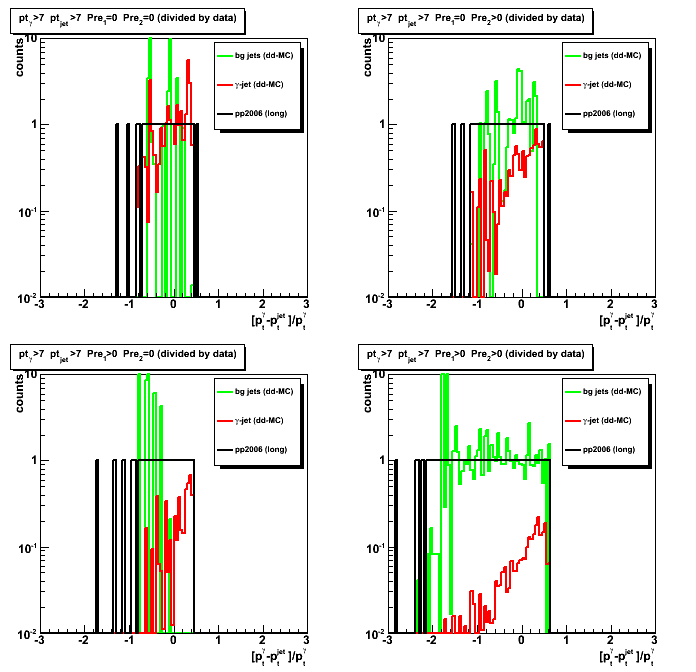
Figure 6: pt asymmetry between gamma and the away side jet (R_cluster >0.99)
for a three data samples (pp2006[long] data, gamma-jet MC, QCD jets background).
pt cut of 7 GeV for both gamma and jet has been applied.
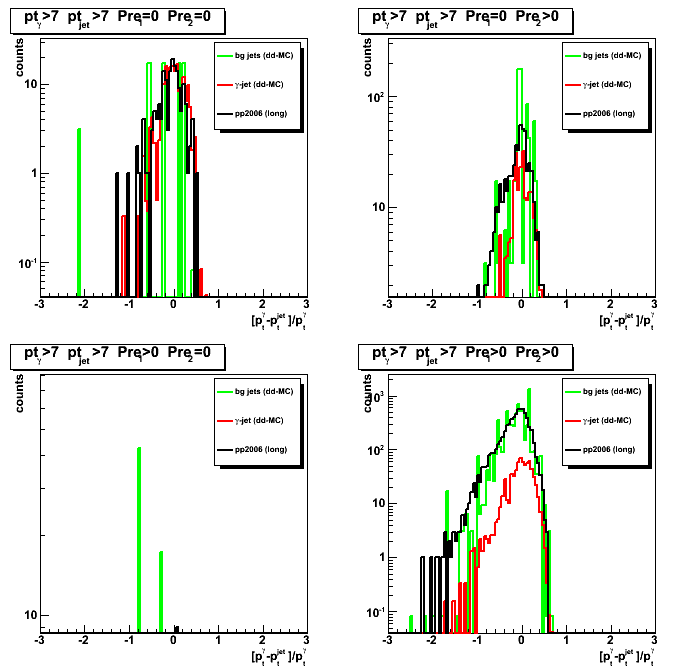
Figure 7: signal to background ratio
as a functio of pt asymmetry between gamma and the away side jet (R_cluster >0.99)
pt cut of 7 GeV for both gamma and jet has been applied.
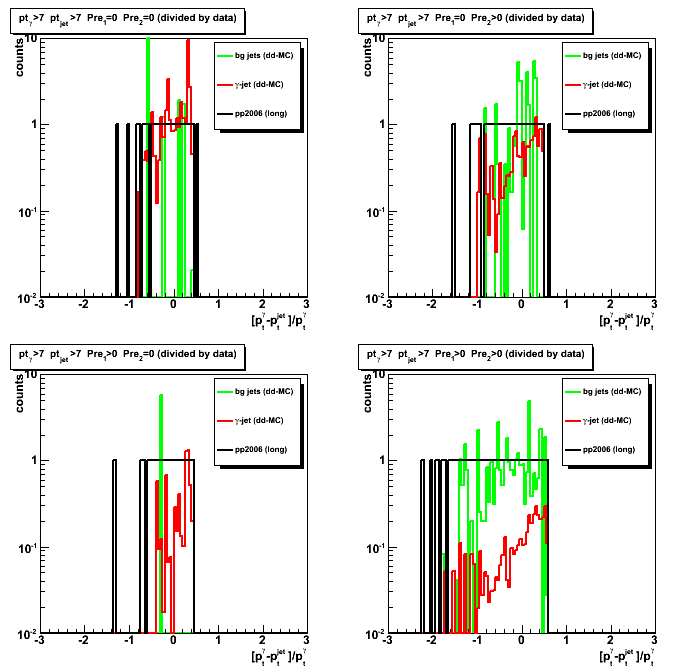
Figure 8: pt asymmetry between gamma and the away side jet (R_cluster >0.99)
for a three data samples (pp2006[long] data, gamma-jet MC, QCD jets background).
pt cut of 7 GeV for gamma and 5GeV for the away side jet has been applied.
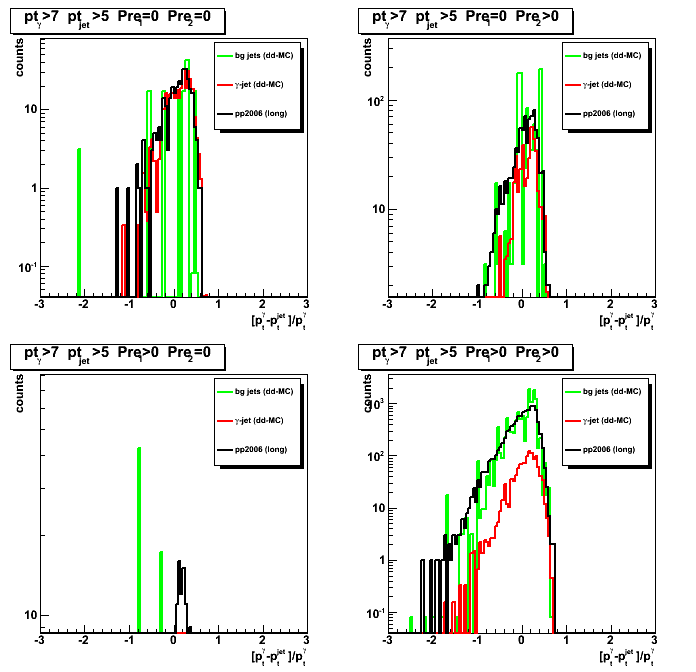
Figure 9: signal to background ratio
as a function of pt asymmetry between gamma and the away side jet (R_cluster >0.99)
pt cut of 7 GeV for gamma and 5GeV for the away side jet has been applied.
2008.05.15 Vertex z distribution for pp2006 data, MC gamma-jet and QCD jets events
Ilya Selyuzhenkov May 15, 2008
Figure 1:Vertex z distribution for pp2006 (long) data [eemc-http-mb-l2gamma:137641 trigger]
Note: In the upper right plot (pre1=0, pre2>0) one can see
a hole in the acceptance in the range bweeeen z_vertex -10 to 30 cm (probably due to SVT construction)
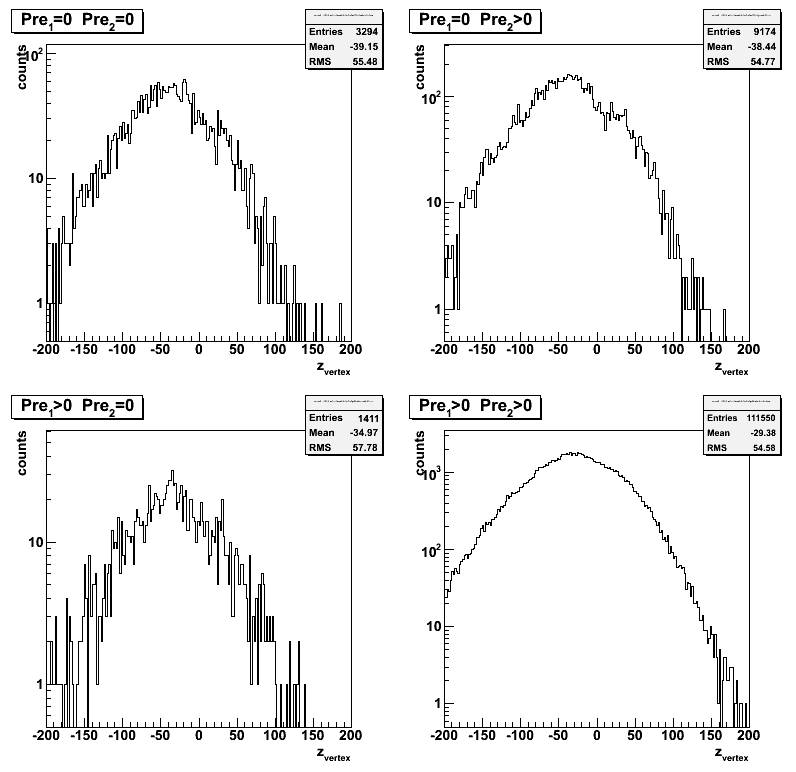
Figure 1b:Vertex z distribution for pp2006 (same as Fig. 1, but on a linear scale)
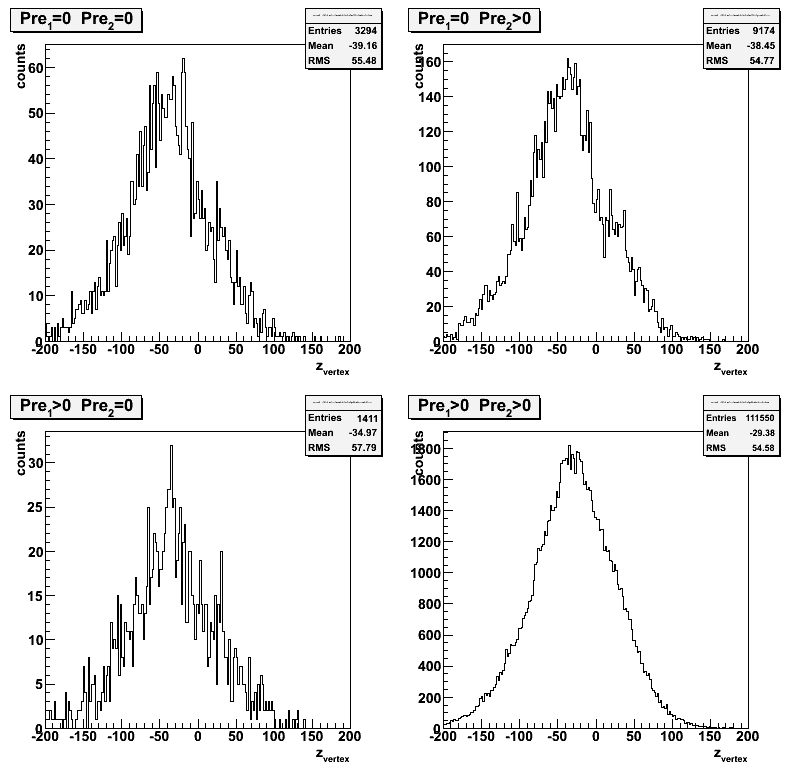
Figure 2:Vertex z distribution for three different data samples
MC results scaled to the same luminosity as data
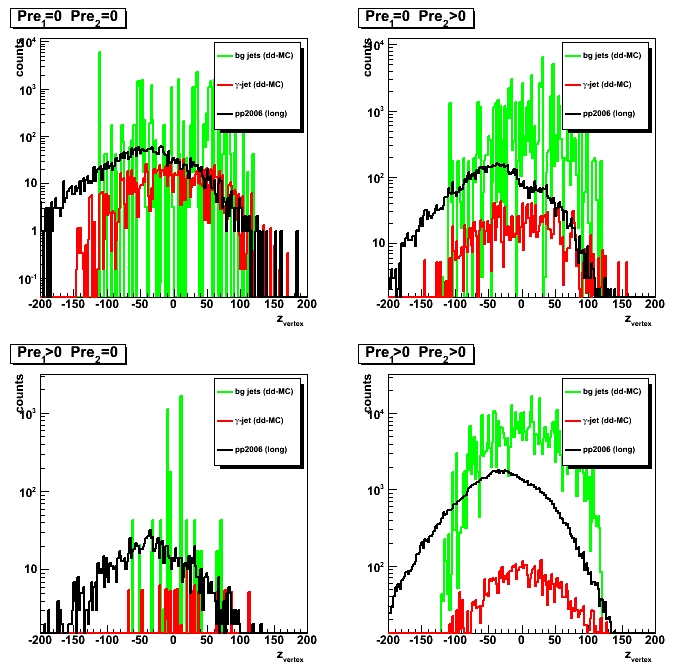
Figure 3:Vertex z distribution for three different data samples
pt cut of 7 GeV for gamma and 5GeV for the away side jet has been applied.

2008.05.20 Shower shapes sorted by pre-shower, z-vertex and gamma's eta, phi, pt
Ilya Selyuzhenkov May 20, 2008
Gamma-jet algorithm and isolation cuts:
-
Selecting only di-jet events identified by the STAR jet finder algorithm,
with jets pointing opposite in azimuth:
cos(phi_jet1 - phi_jet2) < -0.8 - Select jet1 with a maximum neutral energy fraction (R_EM1).
This is our gamma candidate, for which we further require:- No charge tracks associated with jet1 (default jet radius is 0.7):
nChargeTracks_jet1 = 0
Note, that this charge track veto only works
in the EEMC region where we do have TPC tracking - No barrel towers associated with jet1 (pure EEMC jet):
nBarrelTowers_jet1 = 0 - Ratio of the energy in the 3x3 EEMC high tower cluster
to the total jet energy to be:
R_cluster>0.99 (previous, softer, cut was 0.9)
- No charge tracks associated with jet1 (default jet radius is 0.7):
- For the second jet2 (away side jet) we require:
- That jet2 has at least ~10% of hadronic energy:
R_EM2<0.9
- That jet2 has at least ~10% of hadronic energy:
- Additional gamma candidate QA requirements:
- Matching between EEMC SMD uv-strip cluster with a 3x3 cluster of EEMC towers.
(in addition reject events for which we can not idetify uv-strip intersection) - Minimum number of strips in 5-strip EEMC SMD uv-plane clusters to be greater that 3.
- Matching between EEMC SMD uv-strip cluster with a 3x3 cluster of EEMC towers.
Data sample:
- pp2006(long) - 2006 pp production longitudinal data after applying gamma-jet isolation cuts
(note the new R_cluster>0.99 cut)
Shower shapes sorted by pre-shower, z-vertex and gamma's eta, phi, pt
Note, that all shapes are normalized at peak to unity
Figure 1:Shower shapes for different detector eta bins
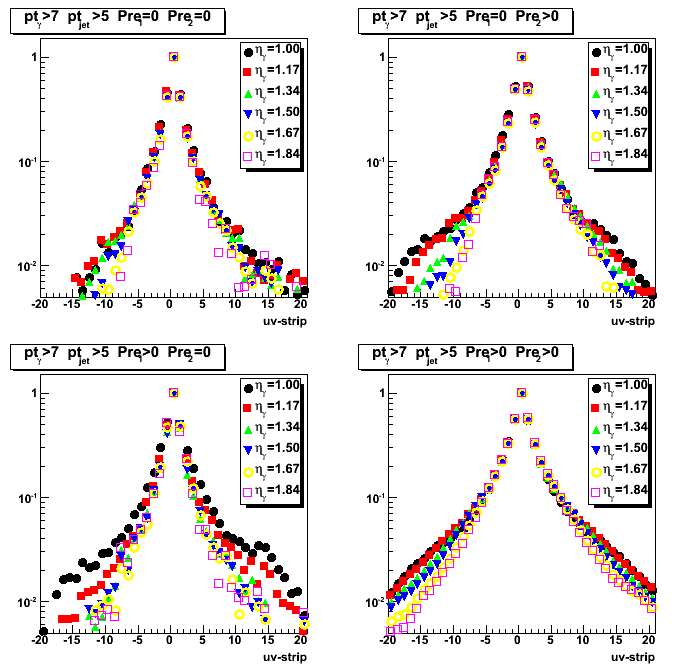
Figure 2:Shower shapes for different detector phi bins
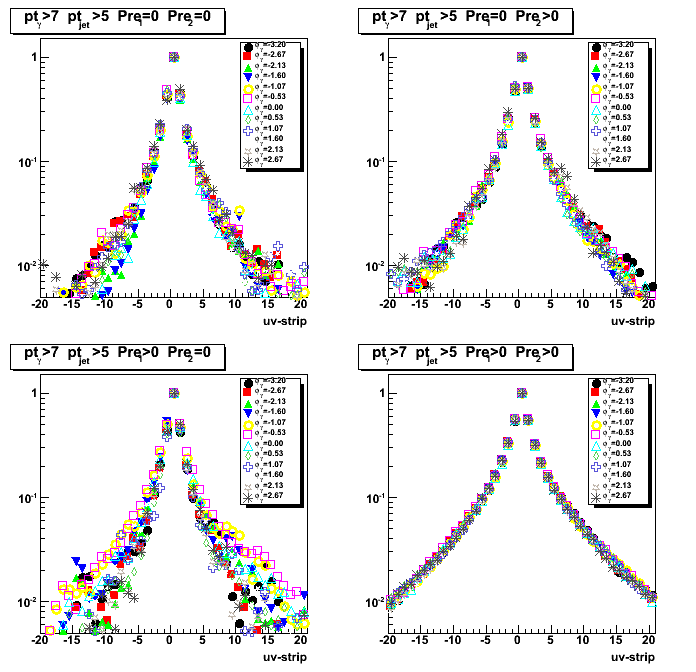
Figure 3:Shower shapes for different gamma pt bins
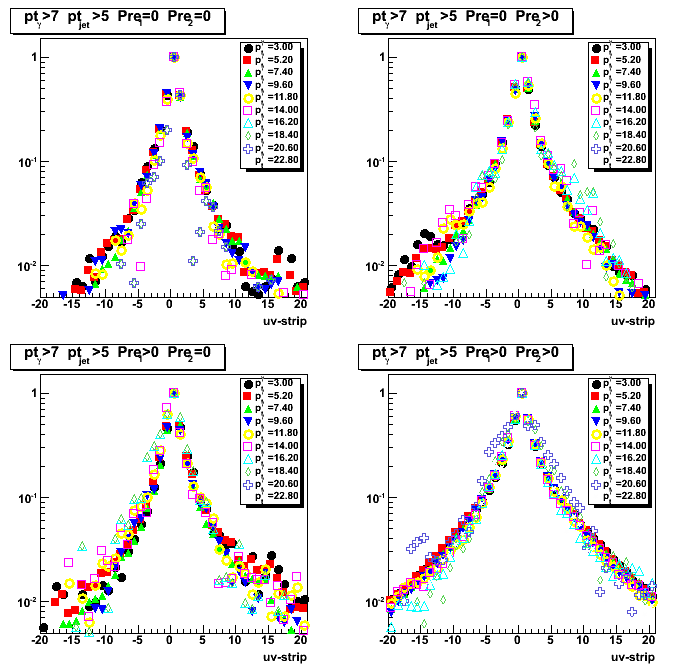
Figure 4:Shower shapes for different z-vertex bins
2008.05.21 EEMC SMD data-driven library: some eta-meson QA plots
Ilya Selyuzhenkov May 21, 2008
EEMC SMD data-driven library: some eta-meson QA plots
Data sample:
-
Subset of 441 eta-meson candidates from Will's analysis.
-
additional QA info (detector eta, pre1, pre2, etc)
has been added to pi0-tree reader script:
/star/institutions/iucf/wwjacobs/newEtas_fromPi0finder/ReadEtaTree.C -
pi0 trees from this RCF directory has been used to regenerate etas NTuple:
/star/institutions/iucf/wwjacobs/newEtas_fromPi0finder/out_23/
Some observations:
-
eta-meson purity within the invariant mass region [0.5, 0.65] is about 72%
-
Most of the eta-candidates has detector pseudorapidity less or about 1.4,
what may limits applicability of data-driven shower shapes
derived from these candidates for higher pseudo-rapidity region,
where we have most of the background for the gamma-jet
analysis due to lack of TPC tracking -
z-vertex distribution is very asymmetric, and peaked around -50cm.
Only a few candidates has a positive z-vertex values.
Figure 1: Eta-meson invariant mass with signal and background fits and ratio (upper left).
Pseudorapidity [detector and wrt vertex] distributions (right top and bottom plots),
vertex z distributions (bottom left)
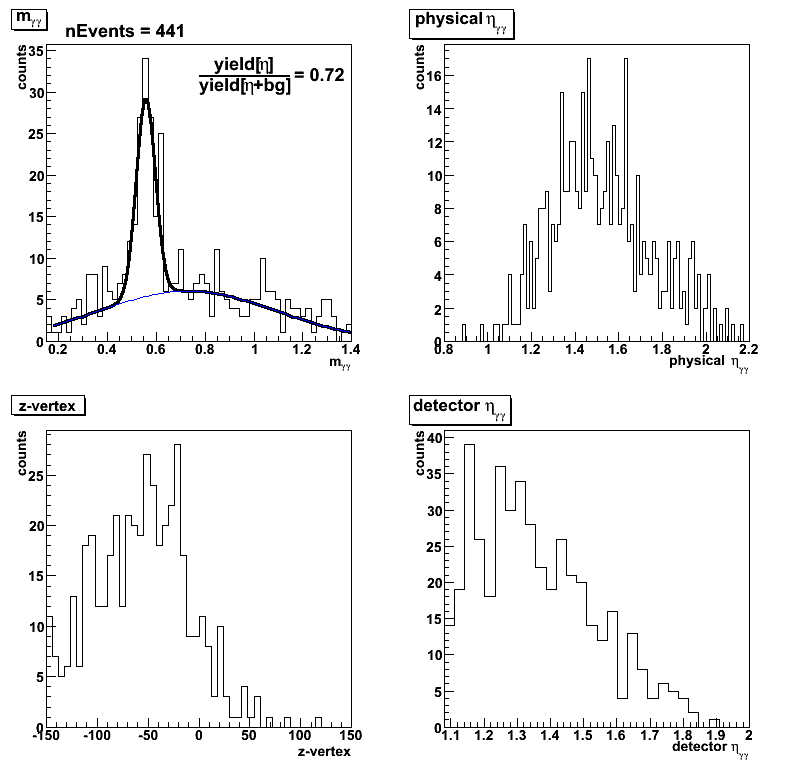
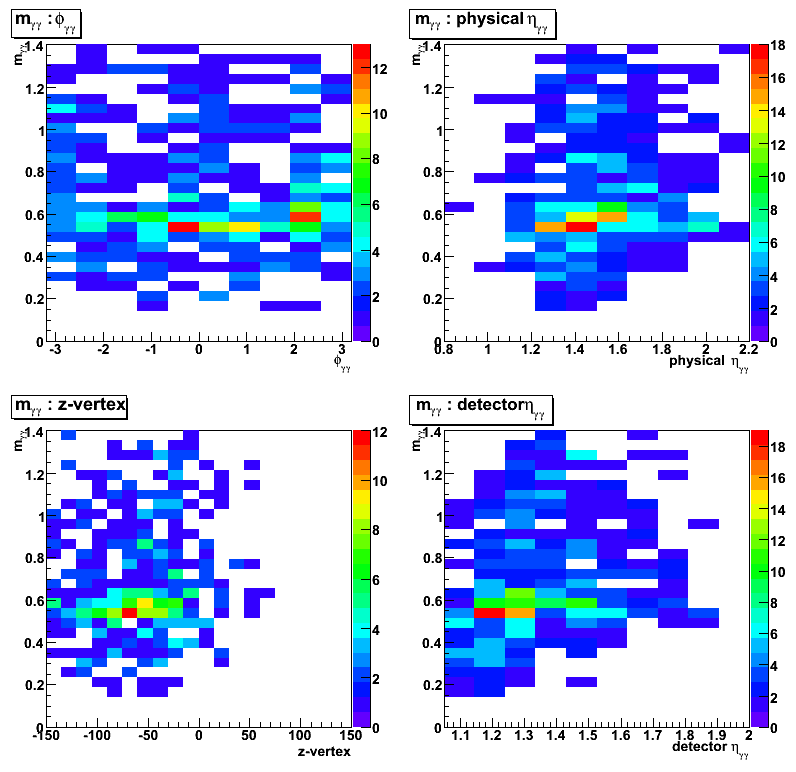
Figure 2:2D plots for the eta-meson invariant mass vs
azimuthal angle (upper left), pseudorapidity (upper right),
z-vertex (bottom right), and detector pseudorapidity (bottom right)
2008.05.27 Shower shapes: pp2006 data, MC gamma-jet and QCD jets, gammas from eta
Ilya Selyuzhenkov May 27, 2008
Shower shapes and triple Gaussian fits for gammas from eta-meson
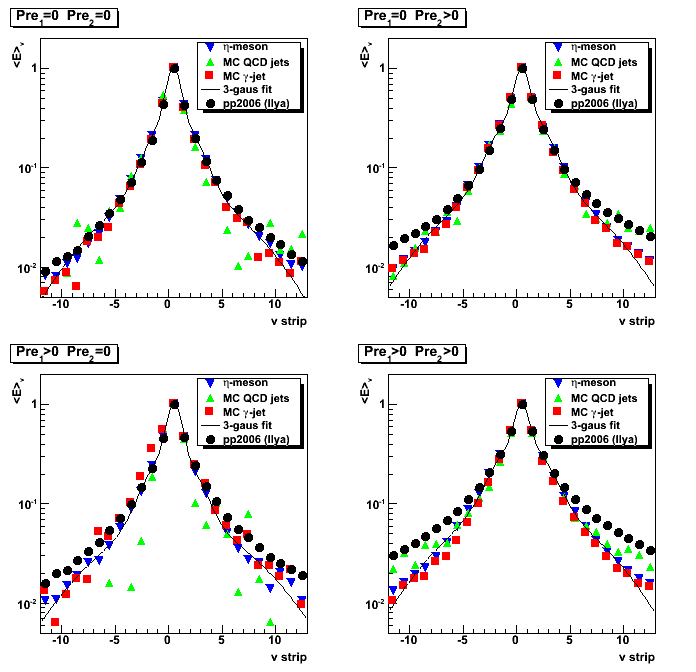
Figure 1: Shower shapes and triple Gaussian fits for photons from eta-meson
sorted by different conditions of EEMC 1st and 2nd pre-shower layers.
Note: All shapes have been normalized at peak to unity
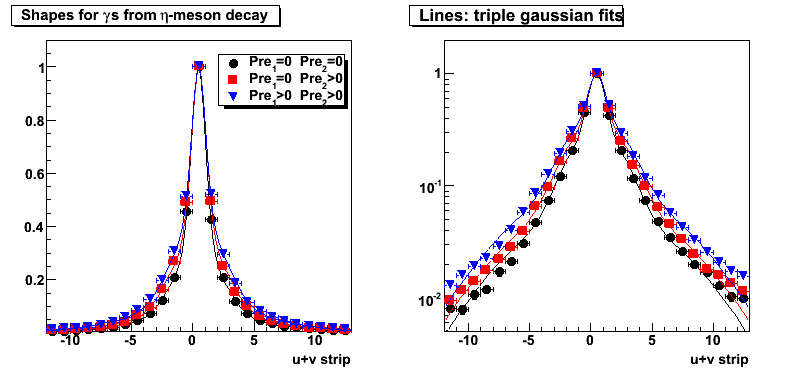
Triple Gaussian fit parameters:
Pre1=0 Pre2=0
0.669864*exp(-0.5*sq((x-0.46016)/0.574864))+0.272997*exp(-0.5*sq((x-0.46016)/-1.84608))+0.0585682*exp(-0.5*sq((x-0.46016)/5.49802))
Pre1=0 Pre2>0
0.0694729*exp(-0.5*sq((x-0.493468)/5.65413))+0.615724*exp(-0.5*sq((x-0.493468)/0.590723))+0.314777*exp(-0.5*sq((x-0.493468)/2.00192))
Pre1>0 Pre2>0
0.0955638*exp(-0.5*sq((x-0.481197)/5.59675))+0.558661*exp(-0.5*sq((x-0.481197)/0.567596))+0.345896*exp(-0.5*sq((x-0.481197)/1.9914))
Shower shapes: pp2006, MC gamma-jet and QCD jets, gammas from eta
Shower shapes comparison between different data sets:
- gammas from eta-meson decay. Obtained from Will's eta-meson analysis
- pp2006 - STAR 2006 pp longitudinal data (~ 3.164 pb^1) after applying gamma-jet isolation cuts.
- gamma-jet - data-driven Pythia gamma-jet sample (~170K events). Partonic pt range 5-35 GeV.
- QCD jets - data-driven Pythia QCD jets sample (~4M events). Partonic pt range 3-65 GeV.
Some observations:
-
Shapes for gammas from eta-meson decay
are in a good agreement with those from MC gamma-jet sample
(compare red squares with blue triangle in Fig. 2 and 3).MC gamma-jet shapes obtained by running a full gamma-jet reconstruction algorithm,
and this agreement indicates that we are able to reconstruct gamma shapes
which we put in with data-driven shower shape library. -
MC gamma-jet shapes match pp2006 data shapes
for pre1=0 condition, where we expect to be very efficient in background rejection
(compare red squares with black circles in upper plots of Fig. 2 and 3).This indicates that we are able to reproduce EEMC SMD of direct photons with data-driven Monte-Carlo.
-
There is no match between Monte-Carlo QCD background jets and pp2006 data
for the case when both pre-shower layer fired (pre1>0 and pre2>0).
(compare green triangles with black circes in bottom right plots of Fig.2 and 3).
This is the region where we know background dominates our gamma-jet candidates.This shows that we still do not reproduce SMD response for our background events
in our data-driven Monte-Carlo simulations
(note, that in Monte-Carlo we replace SMD response with real shapes for all background photons
the same way we do it for direct gammas).
Figure 2: Shower shapes comparison between different data sets.
Shapes for gamma-jet candidates obtained with the same gamma-jet reconstruction algorithm
for three different data samples (pp2006, gamma-jet and QCD jets MC).
pt cuts of 7GeV for the gamma and of 5 GeV for the away side jet have been applied.
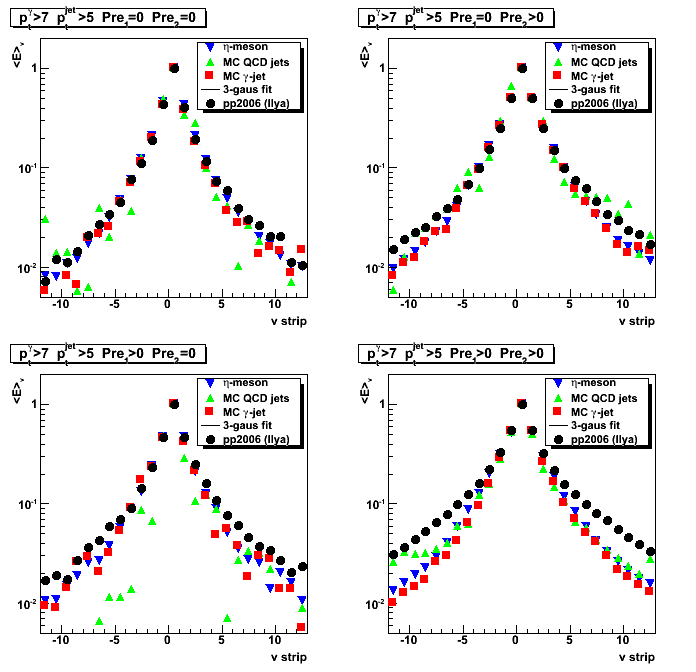
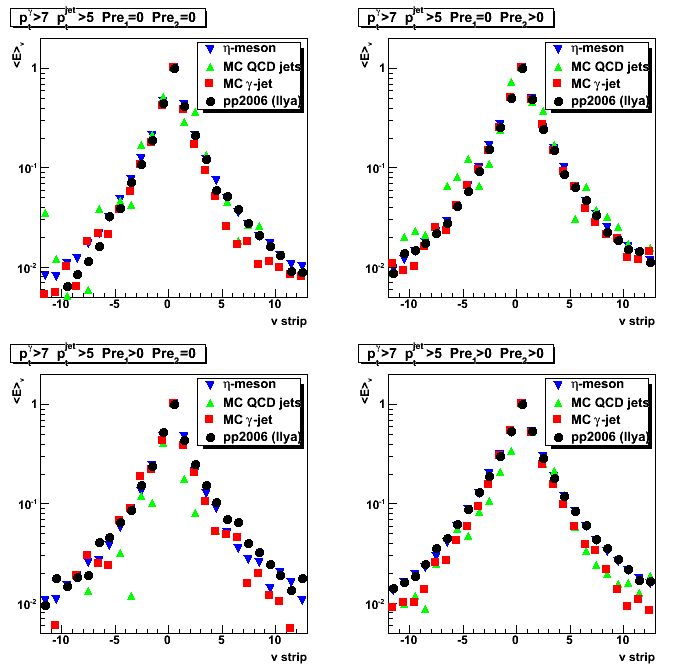
Figure 3:Same as Fig. 2, but with no cuts on gamma and jet pt.
All shapes are similar to those in Fig. 2 with an additional pt cuts.
Note, that blue triangles are the same as in Fig. 2.
2008.05.30 Eta, phi, and pt distributions for gamma and jet from MC and pp2006 data
Ilya Selyuzhenkov May 30, 2008
Three data sets:
- pp2006 - STAR 2006 pp longitudinal data (~ 3.164 pb^1) after applying gamma-jet isolation cuts.
- gamma-jet - data-driven Pythia gamma-jet sample (~170K events). Partonic pt range 5-35 GeV.
- QCD jets - data-driven Pythia QCD jets sample (~4M events). Partonic pt range 3-65 GeV.
Figure 1: Gamma eta distribution.
pt cuts of 7GeV for the gamma and of 5 GeV for the away side jet have been applied.
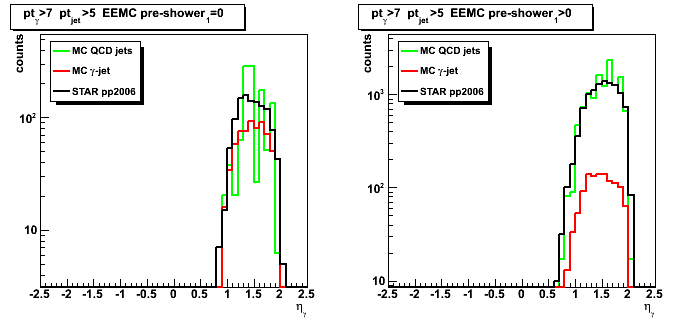
Figure 2: Gamma pt distribution.
pt cuts of 7GeV for the gamma and of 5 GeV for the away side jet have been applied.
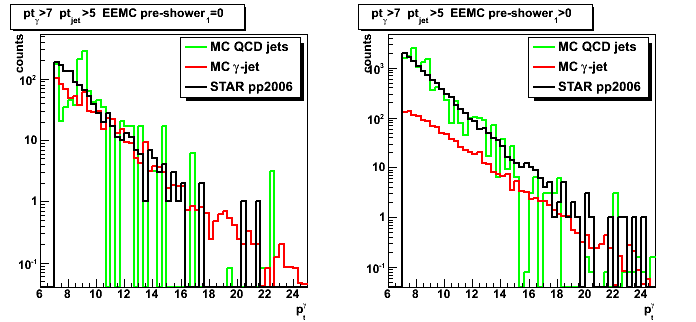
Figure 3: Gamma phi distribution.
pt cuts of 7GeV for the gamma and of 5 GeV for the away side jet have been applied.
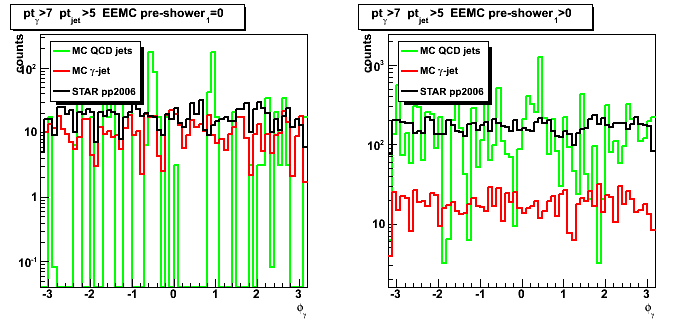
Figure 4: Away side jet eta distribution.
pt cuts of 7GeV for the gamma and of 5 GeV for the away side jet have been applied.
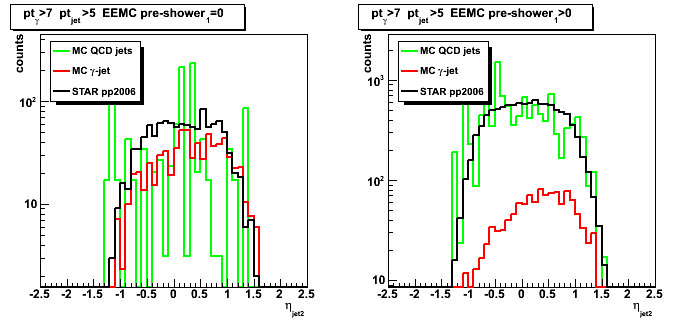
Figure 5: Away side jet pt distribution.
pt cuts of 7GeV for the gamma and of 5 GeV for the away side jet have been applied.
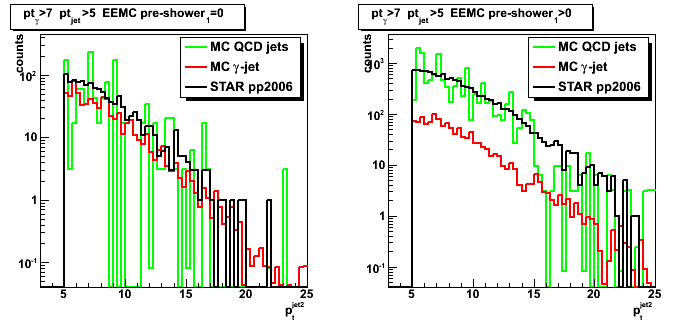
Figure 6: Gamma-jet delta pt distribution.
pt cuts of 7GeV for the gamma and of 5 GeV for the away side jet have been applied.
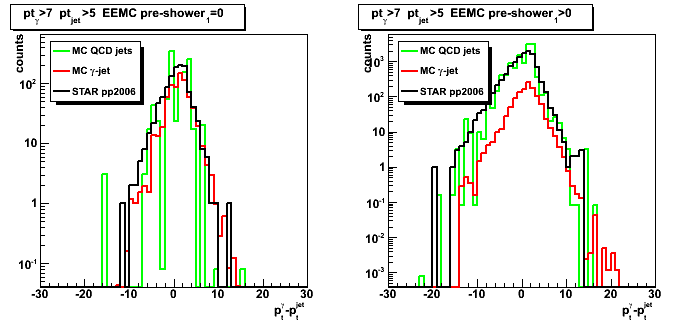
Figure 7: Gamma-jet delta eta distribution.
pt cuts of 7GeV for the gamma and of 5 GeV for the away side jet have been applied.
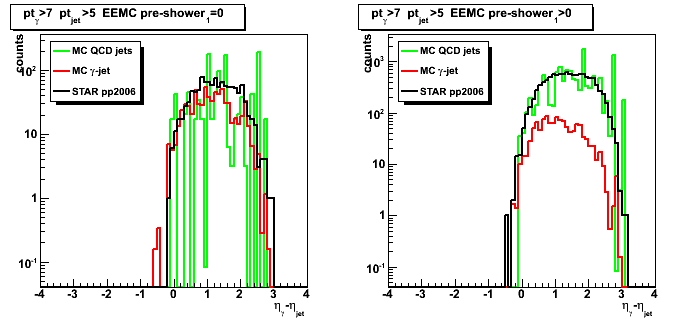
Figure 8: Gamma-jet delta phi distribution.
pt cuts of 7GeV for the gamma and of 5 GeV for the away side jet have been applied.

06 Jun
June 2008 posts
2008.06.04 Gamma cluster energy in various EEMC layers: data vs MC
Ilya Selyuzhenkov June 04, 2008
Gamma cluster energy in various EEMC layers: data vs MC
Three data sets:
- pp2006 - STAR 2006 pp longitudinal data (~ 3.164 pb^1) after applying gamma-jet isolation cuts.
- gamma-jet - data-driven Pythia gamma-jet sample (~170K events). Partonic pt range 5-35 GeV.
- QCD jets - data-driven Pythia QCD jets sample (~4M events). Partonic pt range 3-65 GeV.
Figure 1: Gamma candidate EEMC pre-shower 1 energy (3x3 cluster).
pt cuts of 7GeV for the gamma and of 5 GeV for the away side jet have been applied.
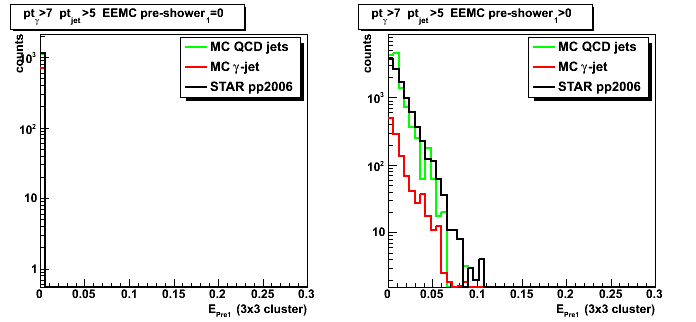
Figure 2: Gamma candidate EEMC pre-shower 2 energy (3x3 cluster).
pt cuts of 7GeV for the gamma and of 5 GeV for the away side jet have been applied.
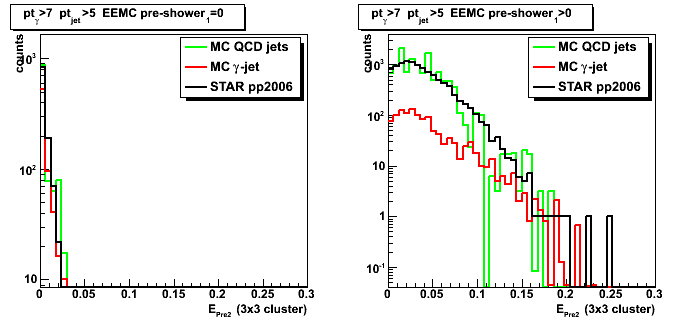
Figure 3: Gamma candidate EEMC tower energy (3x3 cluster).
pt cuts of 7GeV for the gamma and of 5 GeV for the away side jet have been applied.
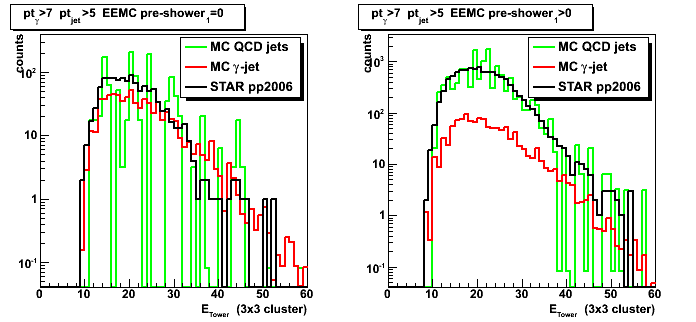
Figure 4: Gamma candidate EEMC post-shower energy (3x3 cluster).
pt cuts of 7GeV for the gamma and of 5 GeV for the away side jet have been applied.
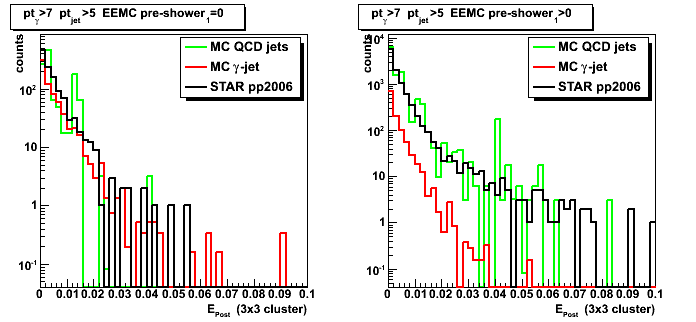
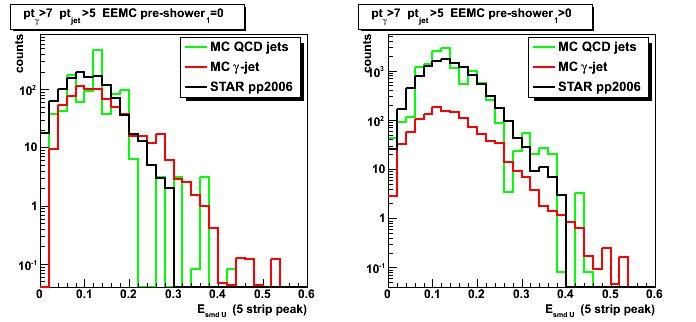
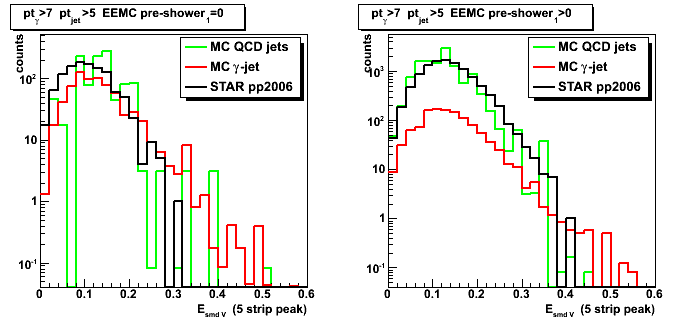
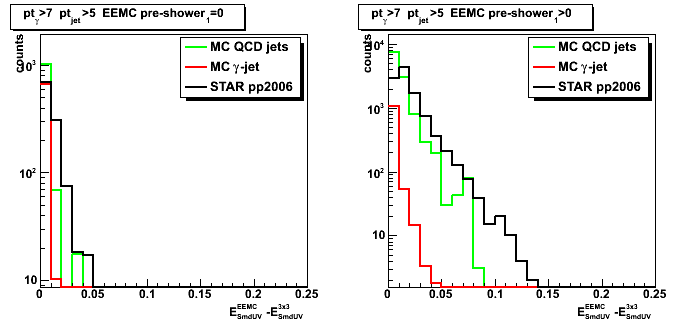
Figure 5: Gamma candidate EEMC SMD u-plane energy [5-strip cluster] (Figure for v-plane)
pt cuts of 7GeV for the gamma and of 5 GeV for the away side jet have been applied.
Difference between total and gamma candidate cluster energy for various EEMC layers
Figure 6: Total minus gamma candidate (3x3 cluster) energy in EEMC pre-shower 1 layer
pt cuts of 7GeV for the gamma and of 5 GeV for the away side jet have been applied.
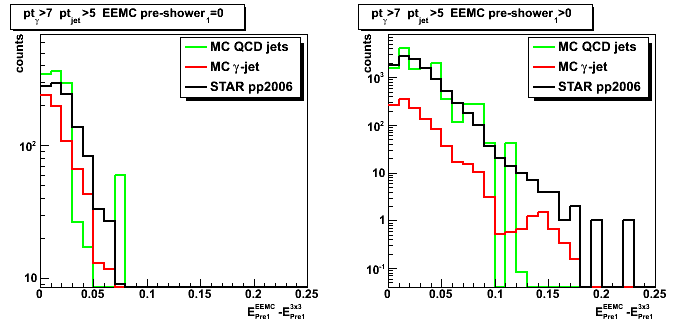
Figure 7: Total minus gamma candidate (3x3 cluster) energy in EEMC pre-shower 2 layer
pt cuts of 7GeV for the gamma and of 5 GeV for the away side jet have been applied.
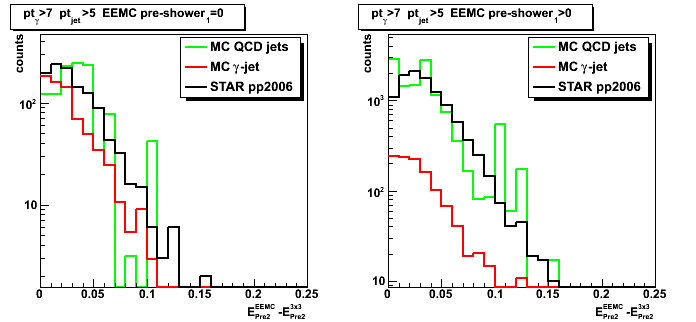
Figure 8: Total minus gamma candidate (3x3 cluster) energy in EEMC tower
pt cuts of 7GeV for the gamma and of 5 GeV for the away side jet have been applied.
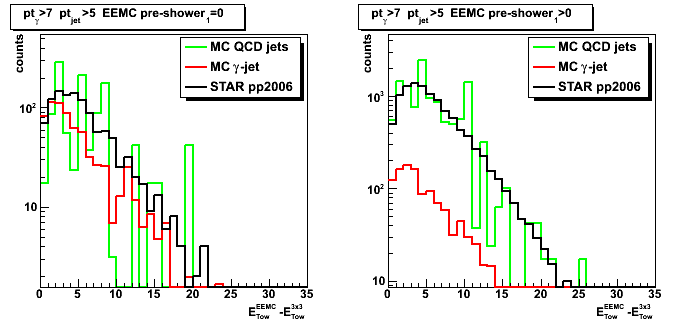
Figure 9: Total minus gamma candidate (3x3 cluster) energy in EEMC post-shower layer
pt cuts of 7GeV for the gamma and of 5 GeV for the away side jet have been applied.
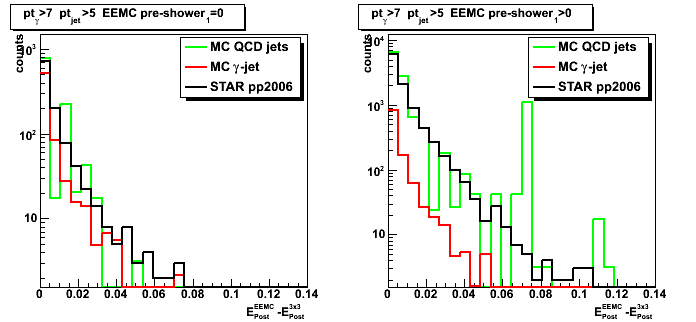
Figure 10: Total (sector) energy minus gamma candidate (5-strip cluster) energy in EEMC SMD[u-v] layer
pt cuts of 7GeV for the gamma and of 5 GeV for the away side jet have been applied.
2008.06.09 STAR White paper plots (pt distribution: R_cluster 0.99 and 0.9 cuts)
Ilya Selyuzhenkov June 09, 2008
Gamma pt distribution: data vs MC (R_cluster 0.99 and 0.9 cuts)
Three data sets:
- pp2006 - STAR 2006 pp longitudinal data (~ 3.164 pb^1) after applying gamma-jet isolation cuts.
- gamma-jet - data-driven Pythia gamma-jet sample (~170K events). Partonic pt range 5-35 GeV.
- QCD jets - data-driven Pythia QCD jets sample (~4M events). Partonic pt range 3-65 GeV.
Numerical values for different pt-bins from Fig. 1-2
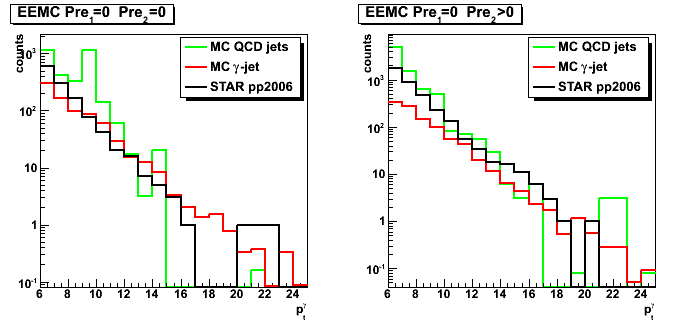
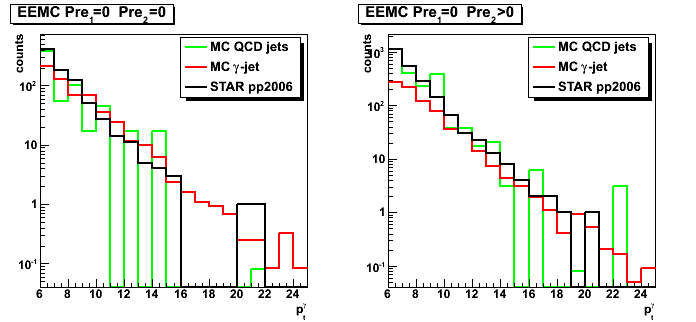
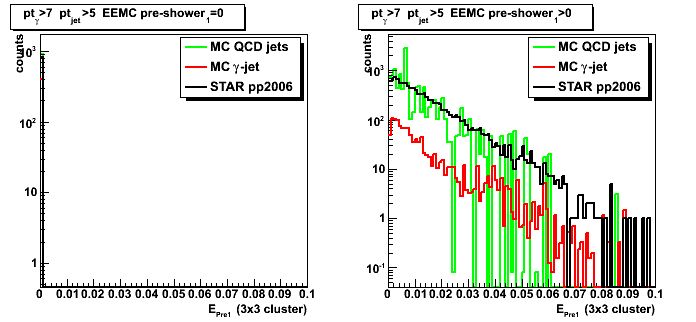
Figure 1: Gamma pt distribution for R_cluster >0.9.
No energy in both pre-shower layer (left plot), and
No energy in pre-shower1 and non-zero energy in pre-shower2 (right plot)
Same figure for R_cluster>0.99 can be found here
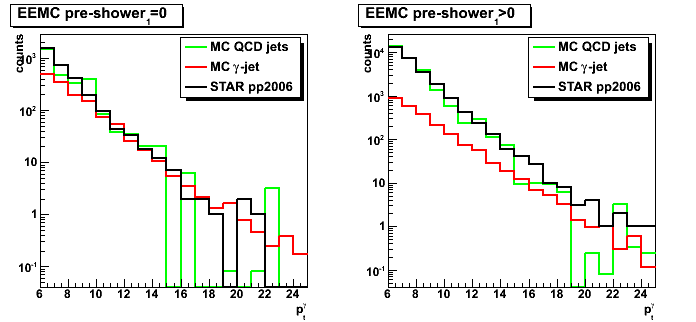
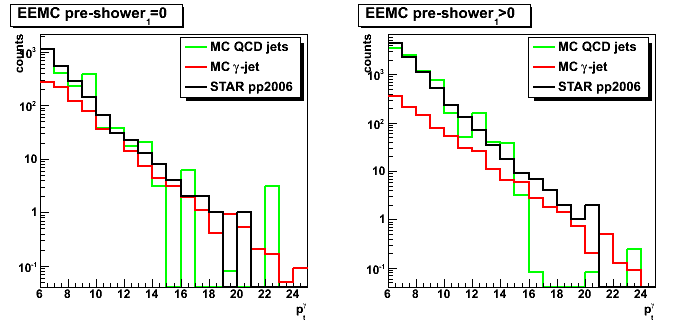
Figure 2: Gamma pt distribution for R_cluster >0.9.
No energy in first EEMC pre-shower1 layer (left plot), and
non-zero energy in pre-shower1 (right plot)
For more details (yield, ratios, all pre12 four conditions, etc) see figures 1-3 here.
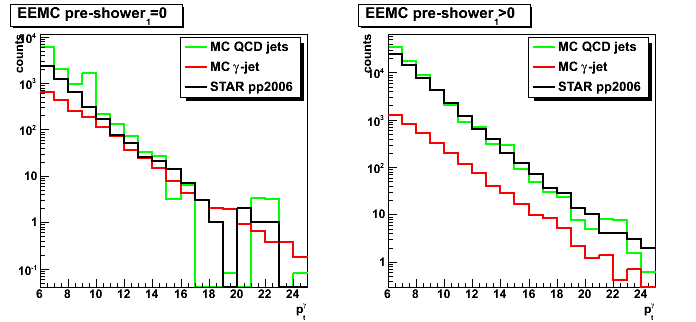
Figure 3: Gamma pt distribution for R_cluster >0.99.
For more details (yield, ratios, all pre12 four conditions, etc) see figures 1-3 here.
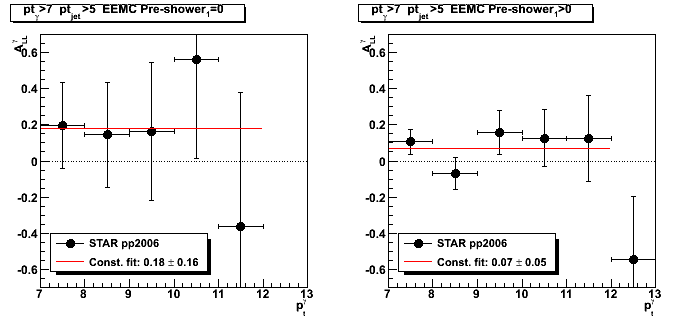
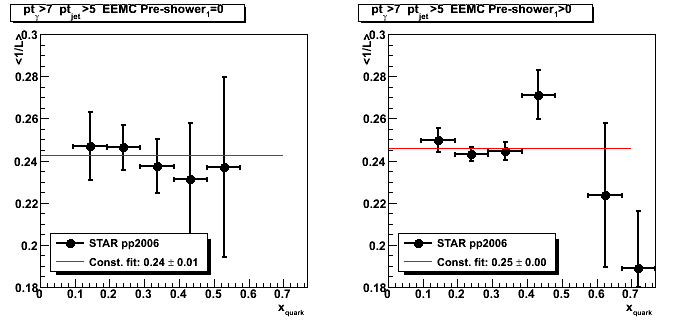
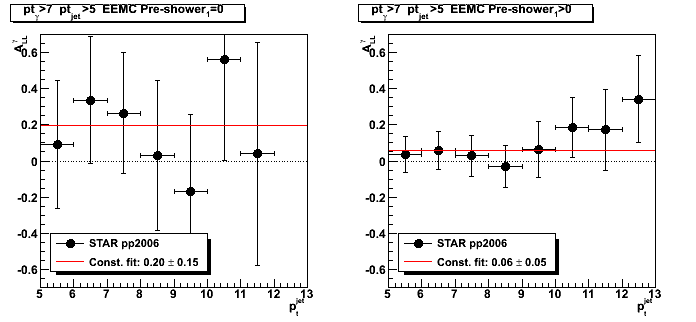
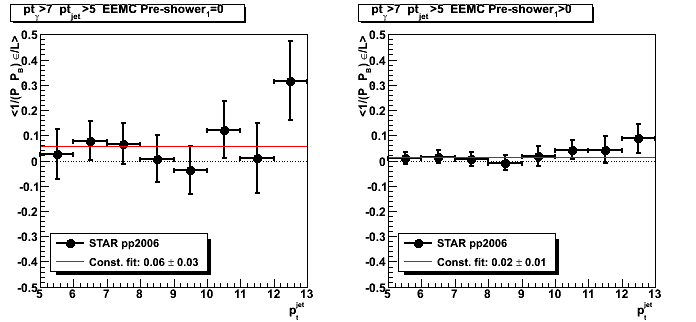
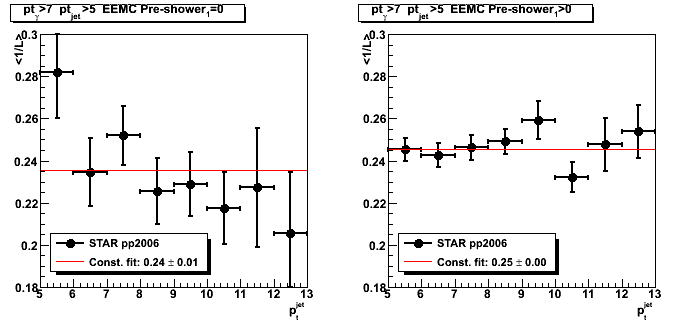
2008.06.10 Gamma-jet candidate longitudinal double spin asymmetry
Ilya Selyuzhenkov June 10, 2008
Note: No background subtraction has been done yet
The case of pre-shower1=0 (left plots) roughly has 1:1 signal to background ratio,
while pre-shower1>0 (right plots) have 1:10 ratio (See MC to data comparison for details).
Data sets:
- pp2006 - STAR 2006 pp longitudinal data (~ 3.164 pb^1) after applying gamma-jet isolation cuts,
plus two additional vertex QA cuts:
a) |z_vertex| < 100 and
b) 180 < bbcTimeBin < 300 - Polarization fill by fill: blue and yellow
- Relative luminosity by polarization fills and runs: relLumi06_070614.txt.gz
- Equations used to calculate A_LL from the data: pdf file
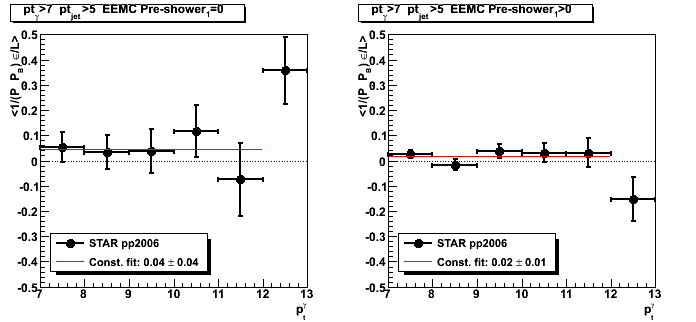
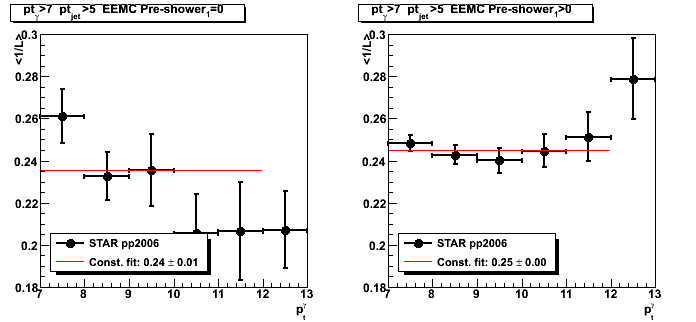
Figure 1: Gamma-jet candidate A_LL vs gamma pt.
Figures for related epsilon_LL and 1/Lum scaled by a factor 10^7
(see pdf/html links above for epsilon_LL and 1/Lum definitions)
Figure 2: Gamma-jet candidate A_LL vs x_gluon.
Figures for related epsilon_LL and 1/Lum scaled by a factor 10^7
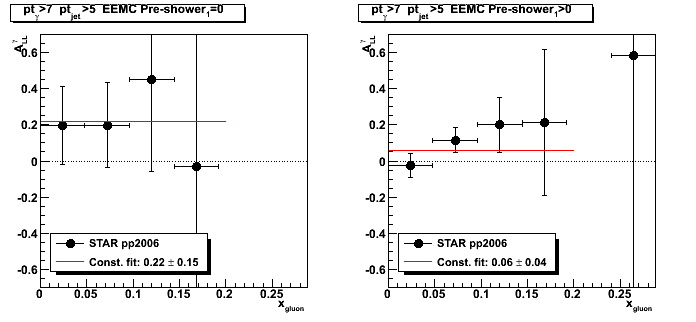
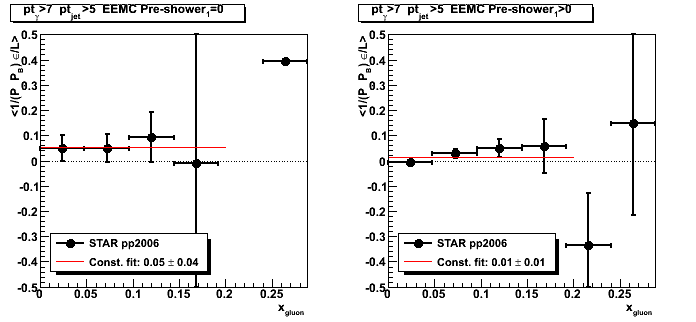
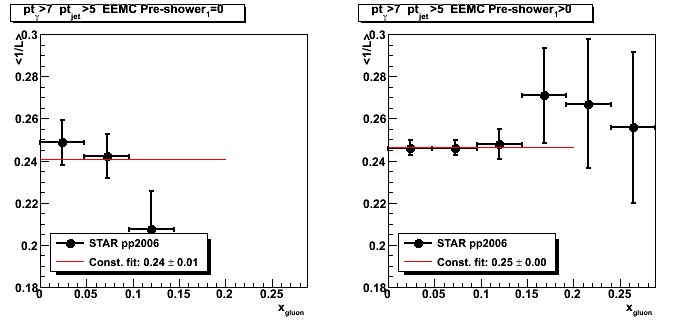
Figure 3: Gamma-jet candidate A_LL vs x_quark.
Figures for related epsilon_LL and 1/Lum scaled by a factor 10^7
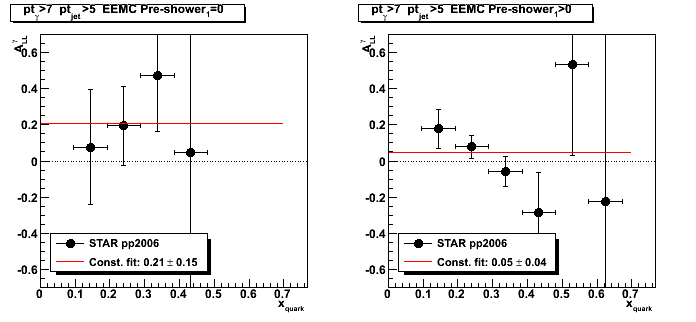
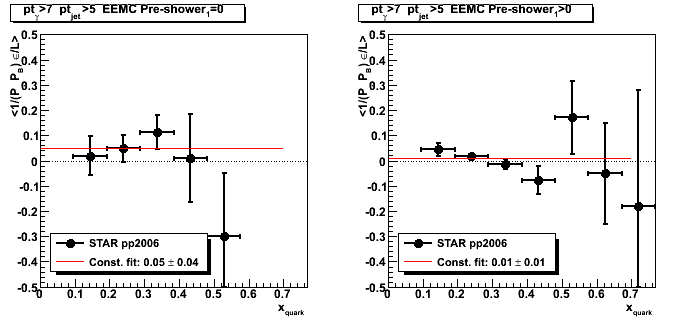
Figure 4: Gamma-jet candidate A_LL vs away side jet pt.
Figures for related epsilon_LL and 1/Lum scaled by a factor 10^7
2008.06.18 Photon-jet reconstruction with the EEMC detector (talk at the STAR Collaboration meeting)
Ilya Selyuzhenkov June 18, 2008
Slides
Photon-jet reconstruction with the EEMC detector - Part 1: pdf or odp
Talk outline (preliminary)
- Introduction and motivation
-
Data samples (pp2006, MC gJet, MC QCD bg)
and gamma-jet reconstruction algorithm: -
Comparing pp2006 with Monte-Carlo simulations scaled to the same luminosity
(EEMC pre-shower sorting): -
EEMC SMD shower shapes from different data samples
(pp2006 and data-driven Monte-Carlo): -
Sided residual plots: pp2006 vs data-driven Monte-Carlo
(gammas from eta meson: 3 gaussian fits) -
Various cuts study:
- R_cluster cut of 0.99 and 0.9 comparison
(Cluster energy distribution vs number of EEMC towers fired: Fig.4) - Charge particle veto and TPC tracking
- Away side jet pt matching
- R_cluster cut of 0.99 and 0.9 comparison
-
Some QA plots:
-
A_LL reconstruction technique:
-
Work in progress... To do list:
- Understading MC background and pp2006 data shower shapes discrepancy
- Implementing sided residual technique with shapes sorted by pre1&2 (eta, sector, etc?)
- Tuning analysis cuts
- Quantifying signal to background ratio
- Background subtraction for A_LL, ...
- What else?
- Talk summary
07 Jul
July 2008 posts
2008.07.07 Pre-shower1 < 5MeV cut study
Ilya Selyuzhenkov July 07, 2008
Data sets:
- pp2006 - STAR 2006 pp longitudinal data (~ 3.164 pb^1) after applying gamma-jet isolation cuts.
- gamma-jet - data-driven Pythia gamma-jet sample (~170K events). Partonic pt range 5-35 GeV.
- QCD jets - data-driven Pythia QCD jets sample (~4M events). Partonic pt range 3-65 GeV.
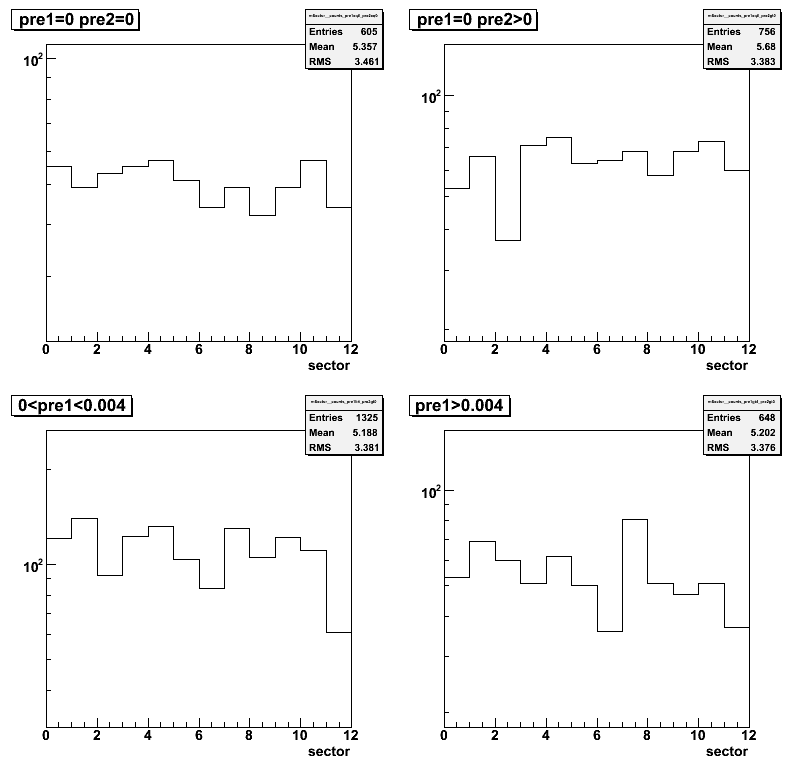
Figure 1: Correlation between 3x3 cluster energy in pre-shower2 vs. pre-shower1 layers
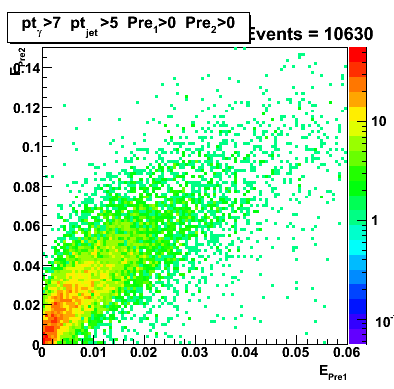
Figure 1a: Distribution of the 3x3 cluster energy in pre-shower1 layer (zoom in for Epre1<0.03 region)
(pp2006 data vs. MC gamma-jet and QCD events)
Figure 2: Shower shapes after pre-shower1 < 5MeV cut.
Shapes are narrower than those without pre1 cut (see Fig. 2)

Figure 3: Gamma pt distribution with pre-shower1 < 5MeV cut.
Compare with distribution withoud pre-shower1 (Fig. 3)
Sided residual (before and after pre-shower1 < 5MeV cut)
Figure 4: Fitted peak vs. maximum sided residual (no pre-shower1 cuts)
Only points for pp2006 data are shown.
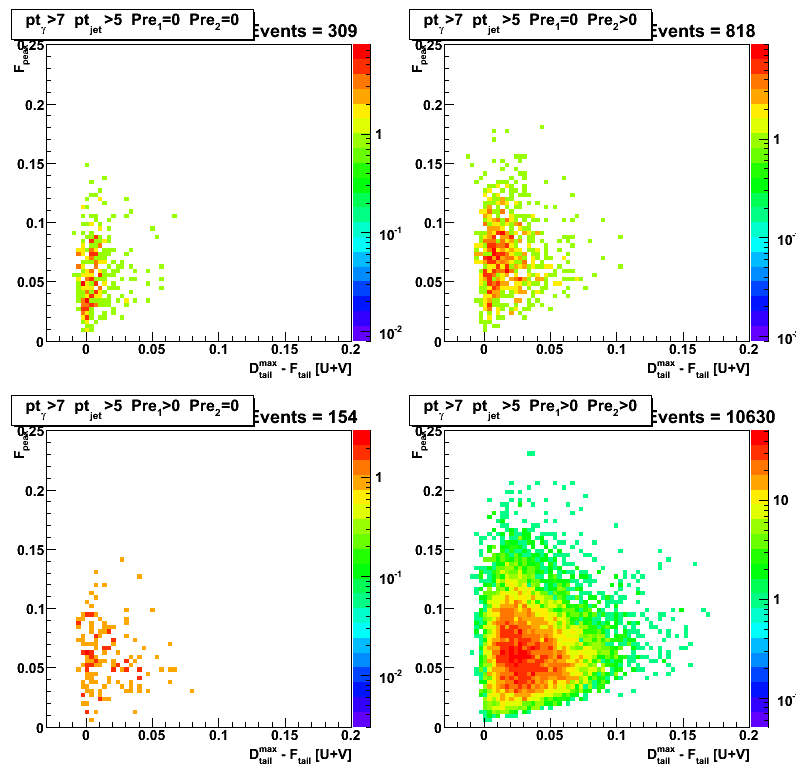
Figure 5: Fitted peak vs. maximum sided residual (after pre-shower1 < 5MeV cut).
Only points for pp2006 data are shown.
Note that distribution for pre1>0,pre2>0 case are narrower
compared to that in Fig.4 (without pre-shower1 cuts).
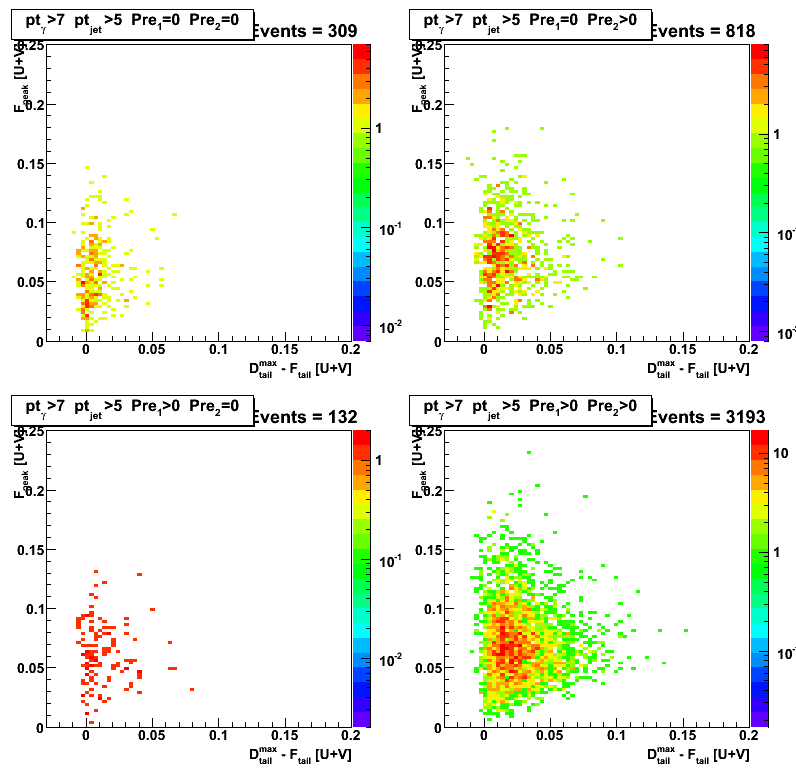
Figure 6: Distribution of maximum sided residual with pre-shower1 < 5MeV cut.
2008.07.16 Gamma-gamma invariant mass cut study
Ilya Selyuzhenkov July 16, 2008
Three data sets:
- pp2006 - STAR 2006 pp longitudinal data (~ 3.164 pb^1) after applying gamma-jet isolation cuts.
- gamma-jet - data-driven Pythia gamma-jet sample (~170K events). Partonic pt range 5-35 GeV.
- QCD jets - data-driven Pythia QCD jets sample (~4M events). Partonic pt range 3-65 GeV.
My simple gamma-gamma finder is trying to
find a second peaks (clusters) in each SMD u and v planes,
match u and v plane high strip intersections,
and calculate the invaraint mass from associated tower energies (3x3 cluster)
according to the energy sharing between SMD clusters.
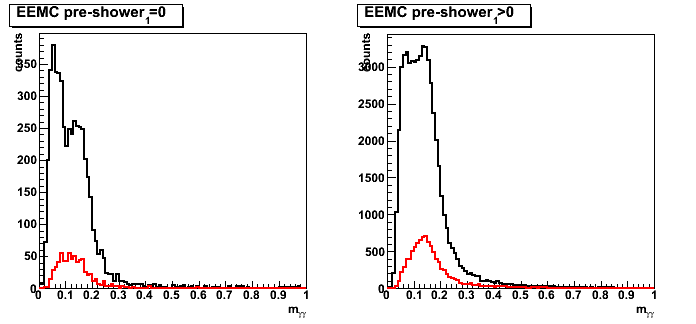
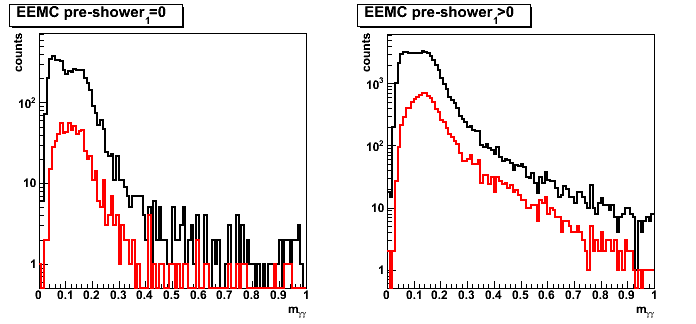
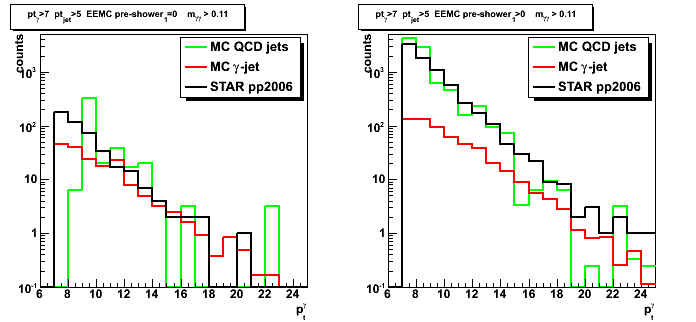
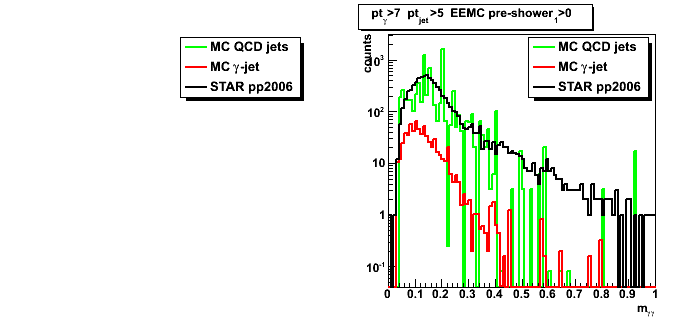
Figure 1: Gamma-gamma invariant mass plot.
Only pp2006 data are shown: black: no pt cuts, red: gamma pt>7GeV and jet pt>5 GeV.
Clear pi0 peak in the [0.1,0.2] invariant mass region.
Same data on the log scale
Gamma pt distributions
Figure 2: Gamma pt distribution (no inv mass cuts).
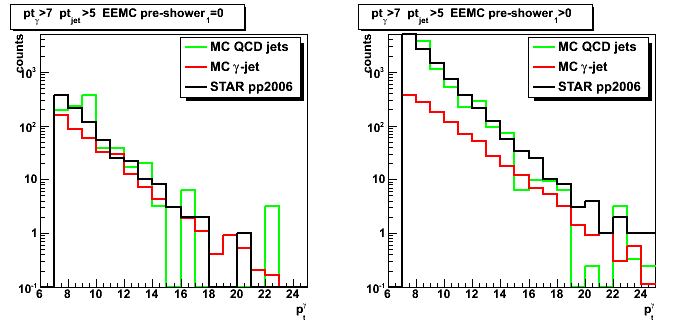
Figure 3: Gamma pt distribution (m_invMass<0.11 or no second peak found).
This cut improves signal to background ratio.
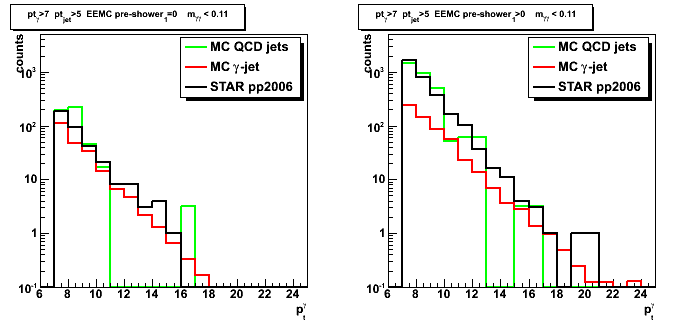
Figure 4: Gamma pt distribution (m_invMass>0.11).
Mostly background events.
Shower shapes
Figure 5: Shower shapes (no pre1 and no invMass cuts).
Good match between shapes in case of no energy in pre-shower1 layer (pre1=0 case).
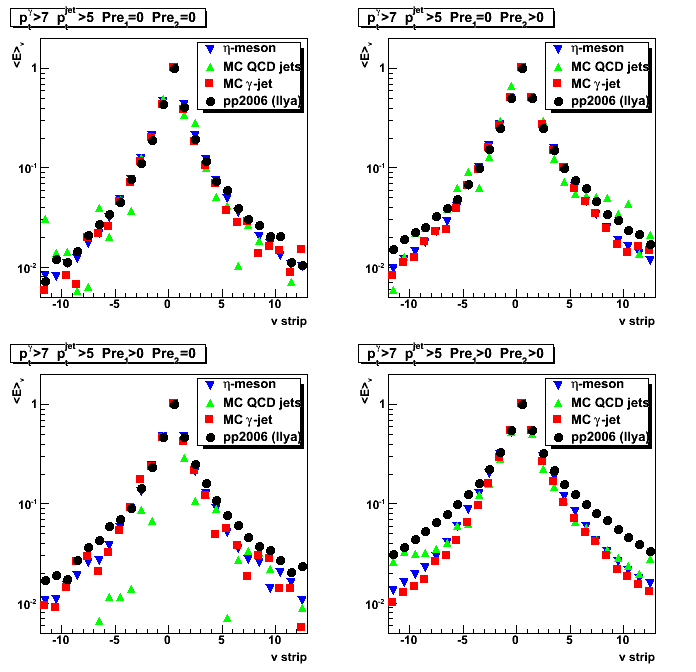
Figure 6: Shower shapes (pre1<5MeV, no invMass cuts).
For pre1&2>0 case shapes getting closer to ech other, but still do not match.
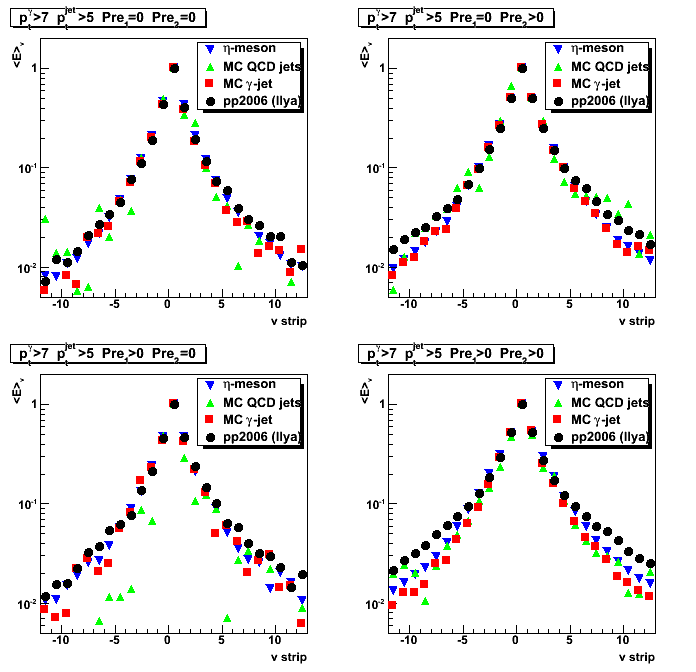
Figure 7: Shower shapes (cuts: pre1<5MeV, invMass<0.11 or no second peak found).
Note, the surprising agreement between eta-meson shapes (blue) and data (black).
Gamma-gamma invariant mass plots
Figure 8: Invariant mass distribution (MC vs. pp2006 data): no pre1 cut
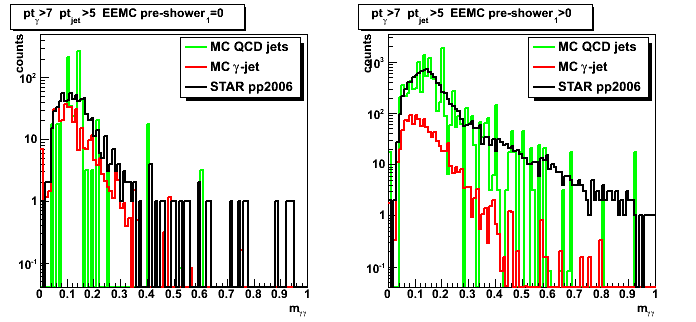
Figure 9: Invariant mass distribution (MC vs. pp2006 data): pre1<5MeV
Left side is the same as in Figure 8
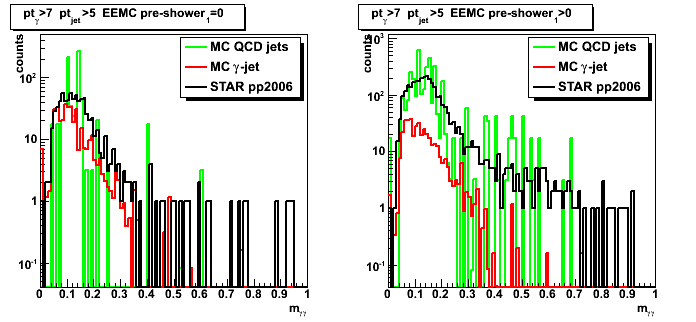
Figure 10: Invariant mass distribution (MC vs. pp2006 data): pre1>5MeV
Left side plot is empty, since there is no events with [pre1=0 and pre1>5MeV]
2008.07.22 Photons from eta-meson: library QA
Ilya Selyuzhenkov July 22, 2008
Shower shapes
Figure 1: Shower shapes: no energy cuts, only 12 strips from peak (left u-plane, right v-plane).
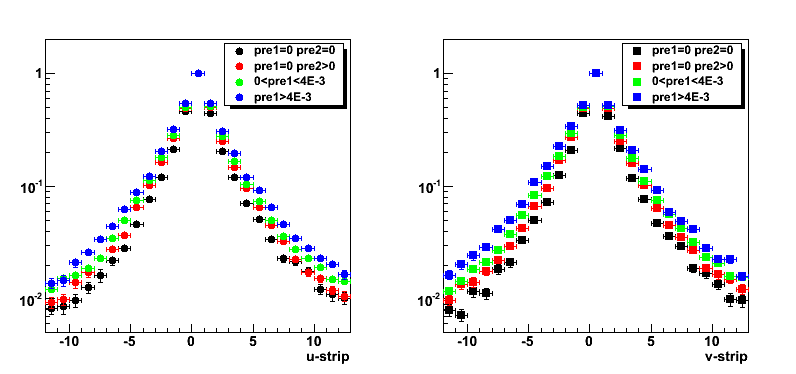
Figure 1a: Shower shapes: no energy cuts, 150 strips from peak (left u-plane, right v-plane).
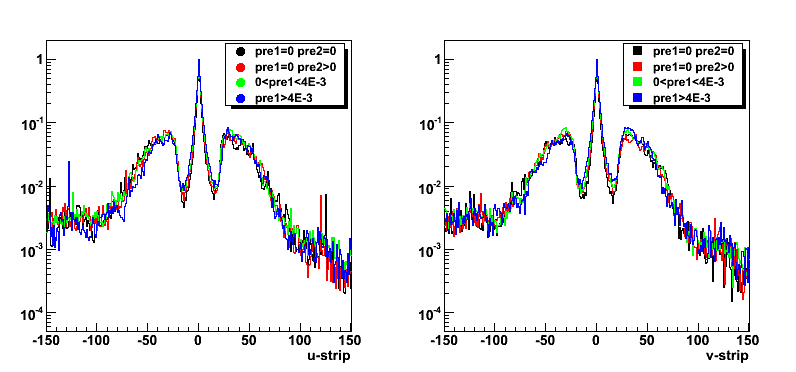
Figure 2: Shower shapes Energy>8GeV (left u-plane, right v-plane).
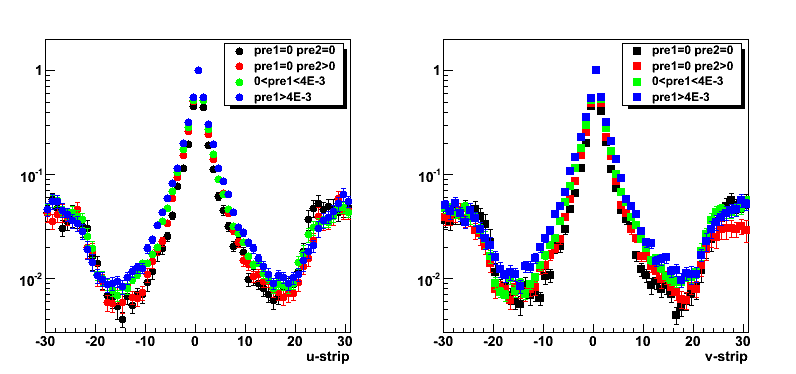
Figure 3: Shower shapes Energy<=8GeV (left u-plane, right v-plane).
One dimensional distributions
Figure 4: Tower energy.
Figure 5: Post-shower energy.
Figure 6: Pre-shower1 energy.
Figure 7: Pre-shower2 energy.
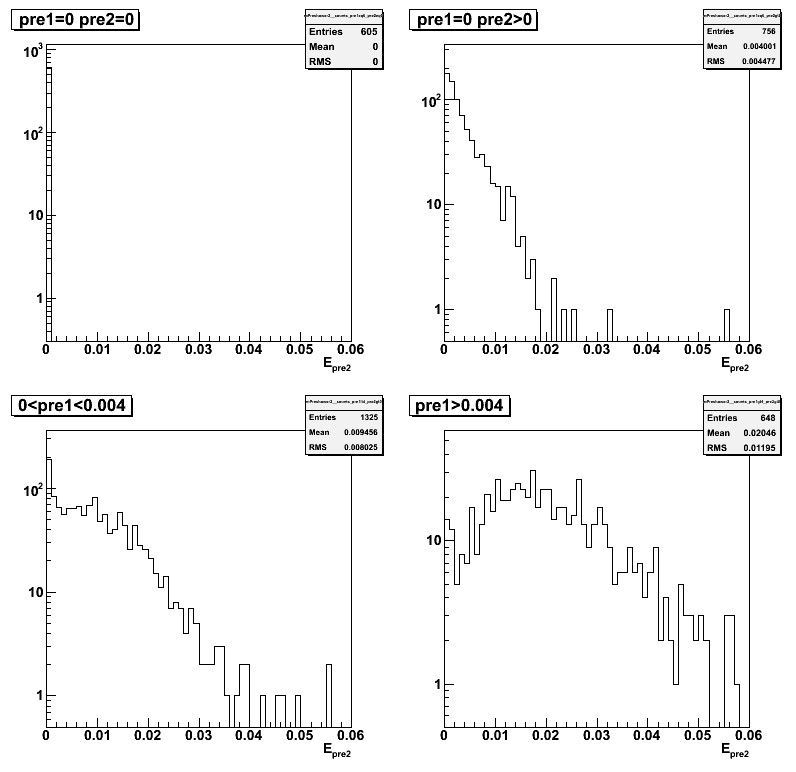
Figure 8: Number of library candidates per sector.
Correlation plots
Figure 9: Transverse momentum vs. energy.
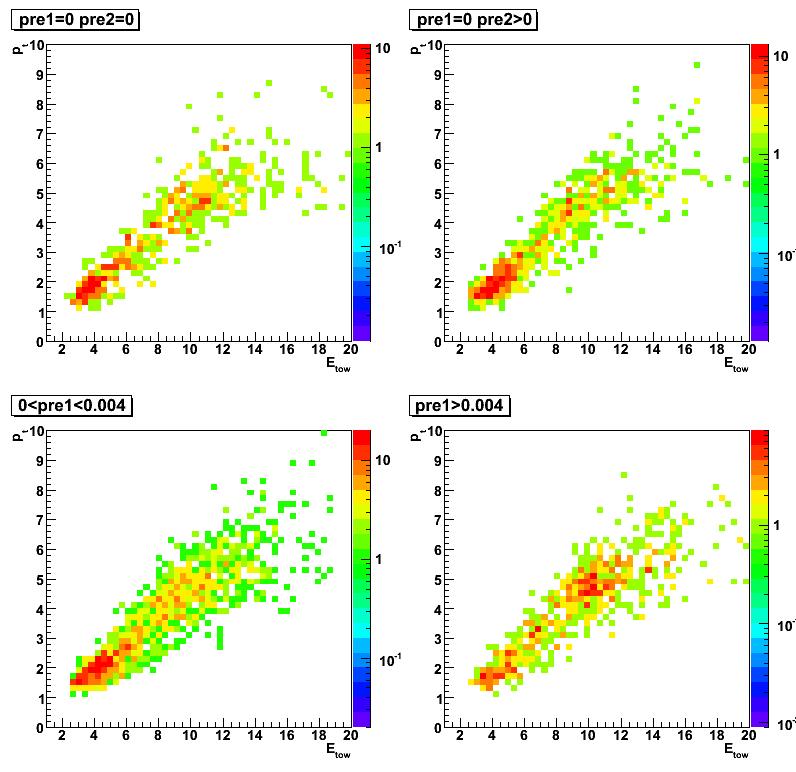
Figure 10: Distance from center of the detector vs. energy.
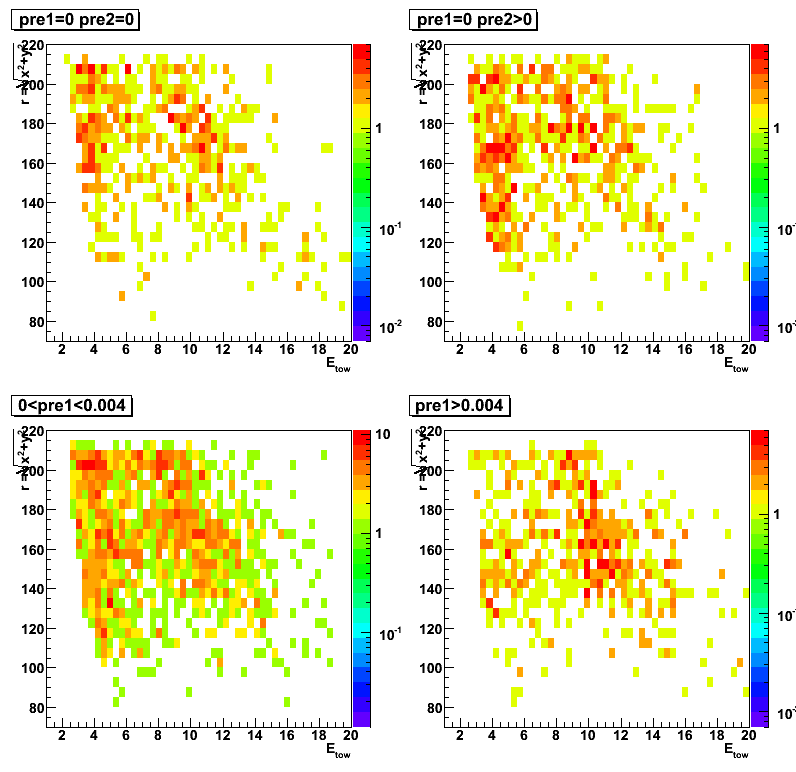
Figure 11: x:y position.
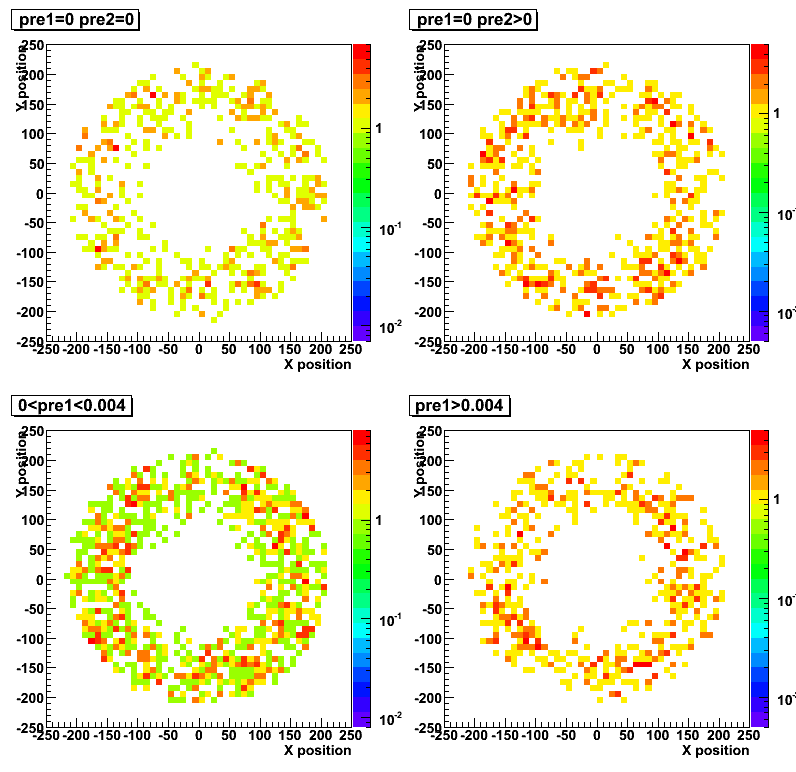
Figure 12: u- vs. v-plane position.
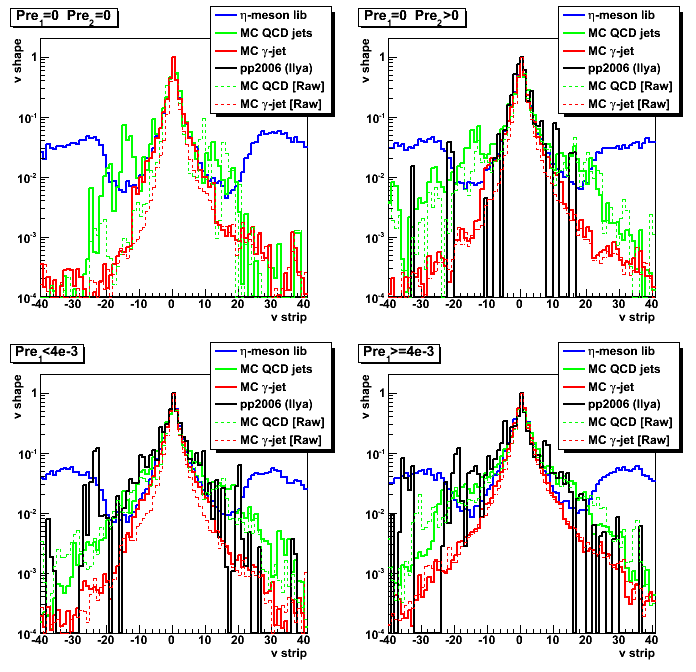
2008.07.29 Shower shape comparison with new dd-library bins
Ilya Selyuzhenkov July 29, 2008
Data sets:
- pp2006 - STAR 2006 pp longitudinal data (~ 3.164 pb^1) after applying gamma-jet isolation cuts.
- gamma-jet - data-driven Pythia gamma-jet sample (~170K events). Partonic pt range 5-35 GeV.
- QCD jets - data-driven Pythia QCD jets sample (~4M events). Partonic pt range 3-65 GeV.
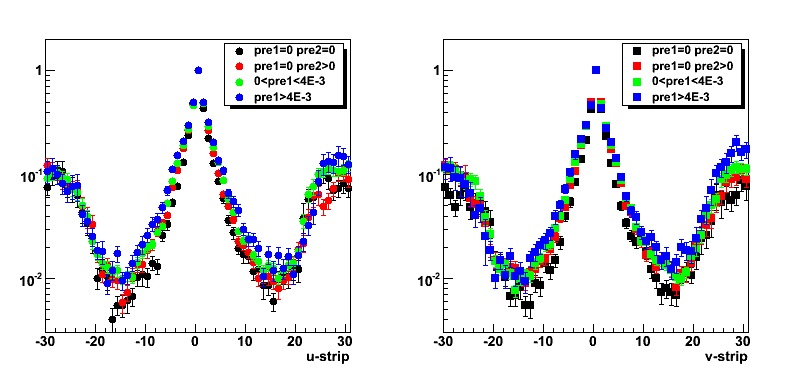
Latest data-driven shower shape replacement library:
- Four pre-shower bins: pre1,2=0, pre1=0,pre2>0 pre1<4MeV, pre1>=4MeV
- plus two energy bins (E<8GeV, E>=8GeV)
Figure 1: Shower shapes for u-plane [12 strips]
Shower shapes for the library are for the E>8GeV bin.
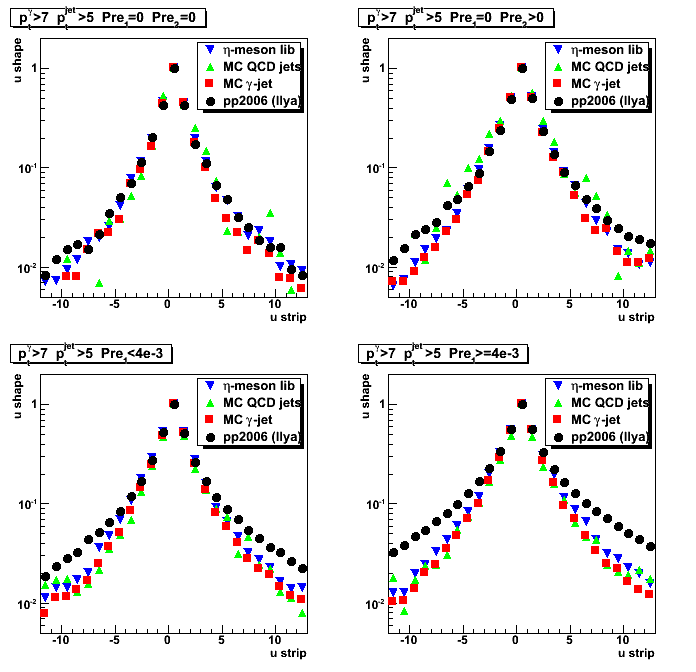
Figure 2: Shower shapes for v-plane [12 strips]
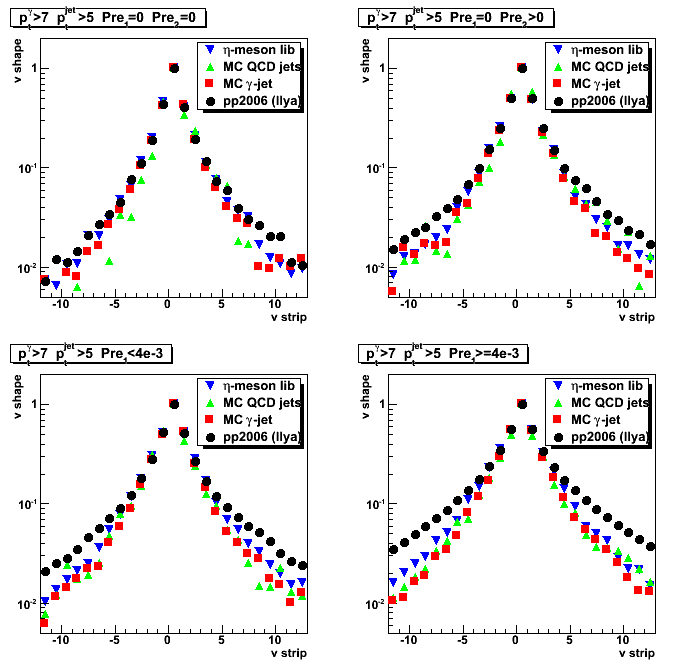
Figure 3: Shower shapes for u-plane [expanded to 40 strips]
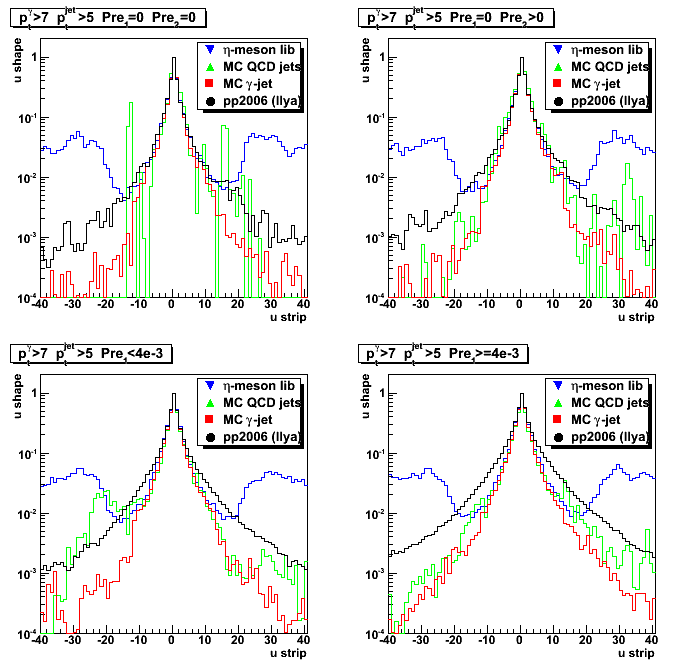
Figure 4: Shower shapes for v-plane [expanded to 40 strips]
08 Aug
August 2008 posts
2008.08.14 Shower shape with bug fixed dd-library
Ilya Selyuzhenkov August 14, 2008
Data sets:
- pp2006 - STAR 2006 pp longitudinal data (~ 3.164 pb^1) after applying gamma-jet isolation cuts.
- gamma-jet - data-driven Pythia gamma-jet sample (~170K events). Partonic pt range 5-35 GeV.
- QCD jets - data-driven Pythia QCD jets sample (~4M events). Partonic pt range 3-65 GeV.
Data-driven maker with bug fixed multi-shape replacement:
- Four pre-shower bins: pre1,2=0, pre1=0,pre2>0 pre1<4MeV, pre1>=4MeV
- plus two energy bins (E<8GeV, E>=8GeV)
Figure 1: Shower shapes for u-plane [12 strips]
Shower shapes for the library are for the E>8GeV bin.
Open squares and triangles represents raw [without dd-maker]
MC gamma-jet and QCD background shower shapes respectively
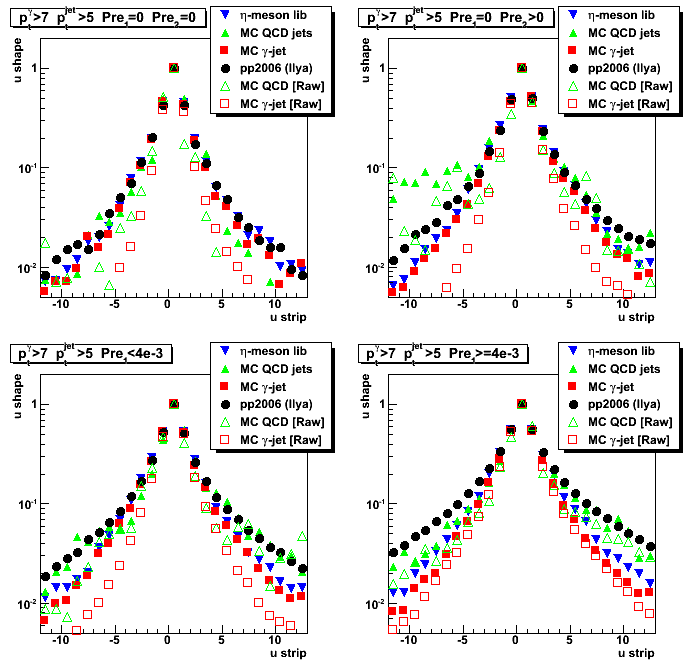
Figure 2: Shower shapes for v-plane [12 strips]
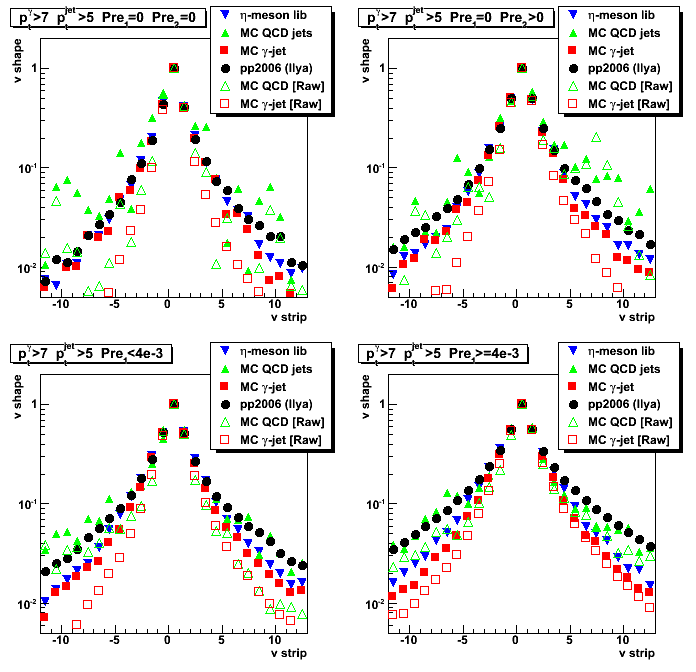
Figure 3: Shower shapes for u-plane [expanded to 40 strips]
Dashed red and green lines represents raw [without dd-maker]
MC gamma-jet and QCD background shower shapes respectively
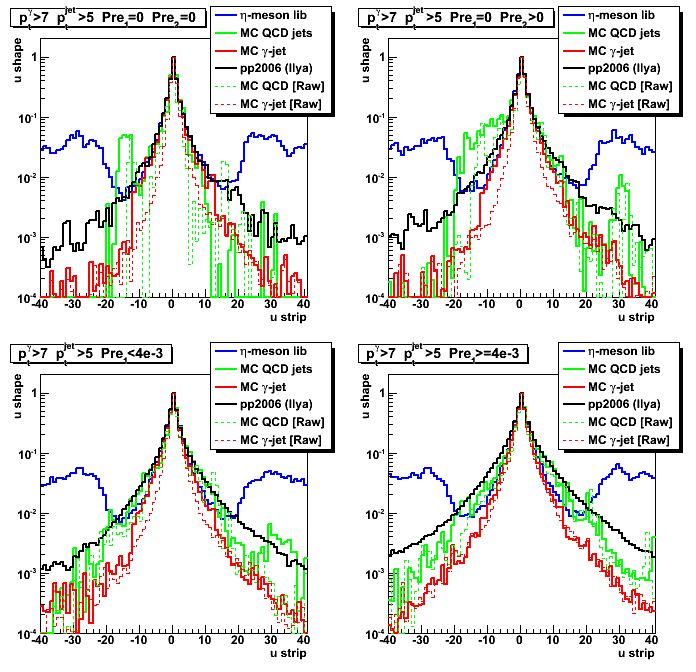
Figure 4: Shower shapes for v-plane [expanded to 40 strips]
2008.08.19 Shower shape from pp2008 vs pp2006 data
Ilya Selyuzhenkov August 19, 2008
Data sets:
- pp2006 - STAR 2006 ppProductionLong data (~ 3.164 pb^1)
"eemc-http-mb-l2gamma" trigger after applying gamma-jet isolation cuts. - pp2008 - STAR ppProduction2008 (~ 5.9M events)
"fmsslow" trigger after applying gamma-jet isolation cuts.
[Only ~13 candidates has been selected before pt-cuts] - gamma-jet - data-driven Pythia gamma-jet sample (~170K events). Partonic pt range 5-35 GeV.
- QCD jets - data-driven Pythia QCD jets sample (~4M events). Partonic pt range 3-65 GeV.
Note: Due to lack of statistics for 2008 data, no pt cuts applied on gamma-jet candidates for both 2006 and 2008 date.
Figure 1: Shower shapes for u-plane [pp2006 data: eemc-http-mb-l2gamma trigger]
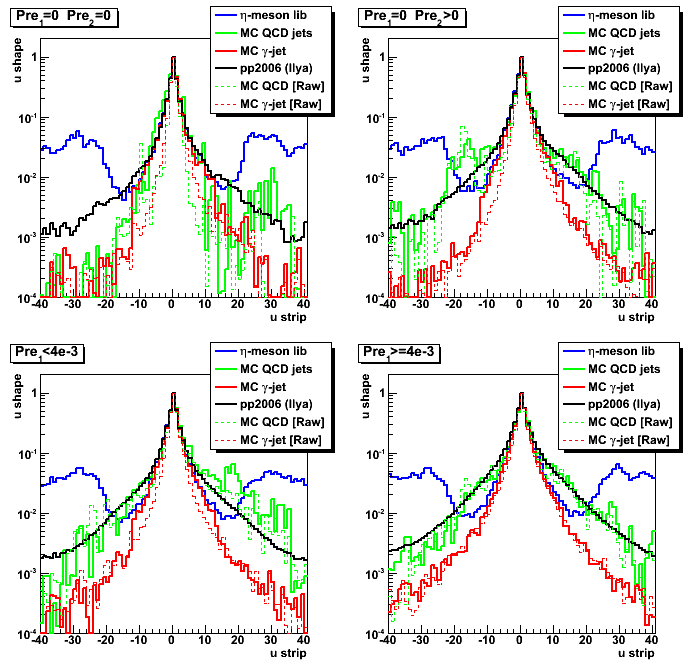
Figure 2: Shower shapes for v-plane [pp2006 data: eemc-http-mb-l2gamma trigger]
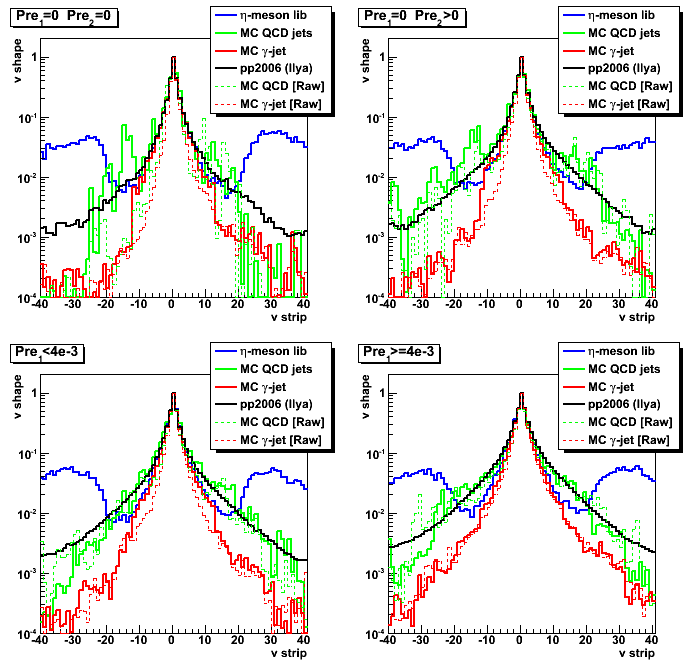
Figure 3: Shower shapes for u-plane [pp2008 data: fmsslow trigger]
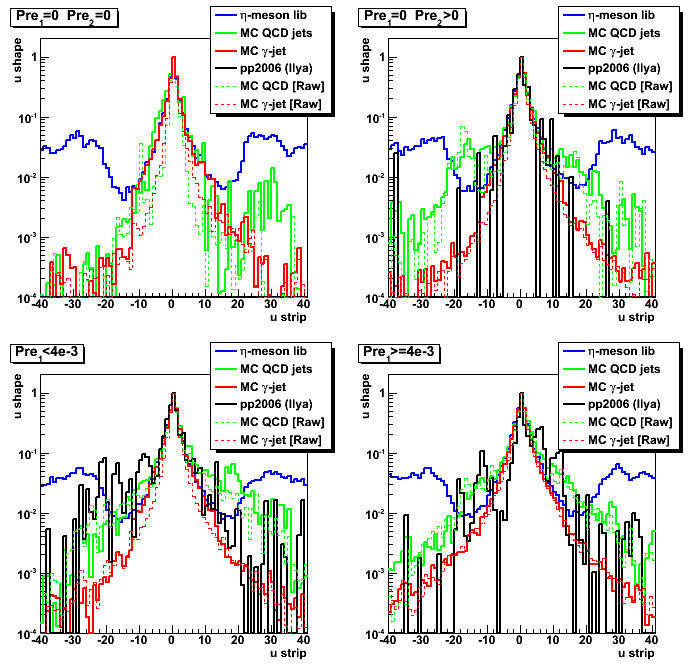
Figure 4: Shower shapes for v-plane [pp2008 data: fmsslow trigger]
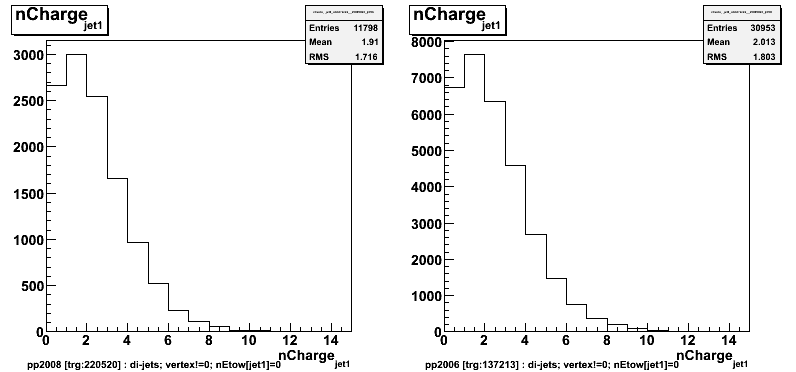
2008.08.25 di-jets from pp2008 vs pp2006 data
Ilya Selyuzhenkov August 25, 2008
Data sets:
- pp2006 - ppProductionLong [triggerId:137213] (day 136 only)
- pp2008 - ppProduction2008 [triggerId:220520] (Jan's set of MuDst from day 047)
Event selection:
- Run jet finder and select only di-jet events [adopt jet-finder script from Murad's analysis]
- Define jet1 as the jet with largest neutral energy fraction (NEF), and jet2 - the jet with a smaller NEF
- Require no EEMC towers associated with jet1
- Select trigger (see above) and require vertex to be found
Figure 1: Vertex z distribution (left: pp2008; right: 2006 data)
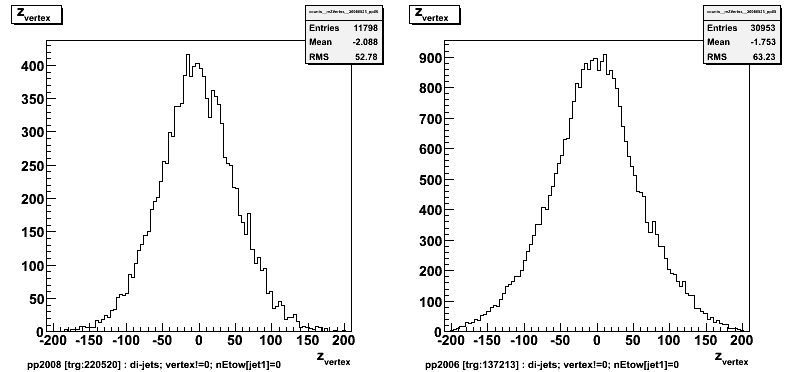
Figure 2: eta vs. phi distribution for the jet1 (jet with largest NEF) .
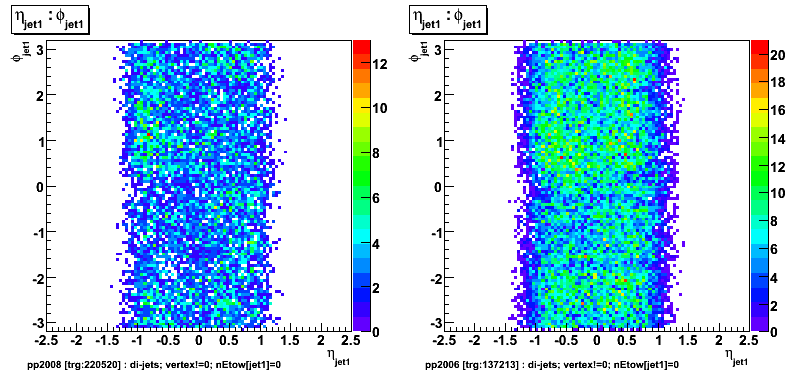
Figure 3: eta vs. z-vertex distribution for the jet1 (jet with largest NEF) .
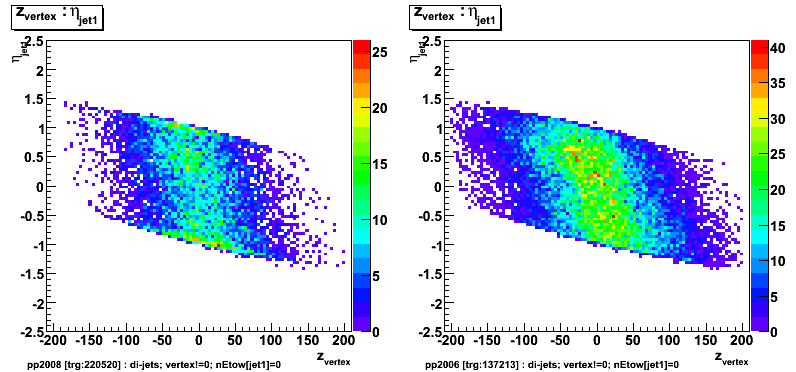
Figure 4: eta vs. z-vertex distribution for the second jet.
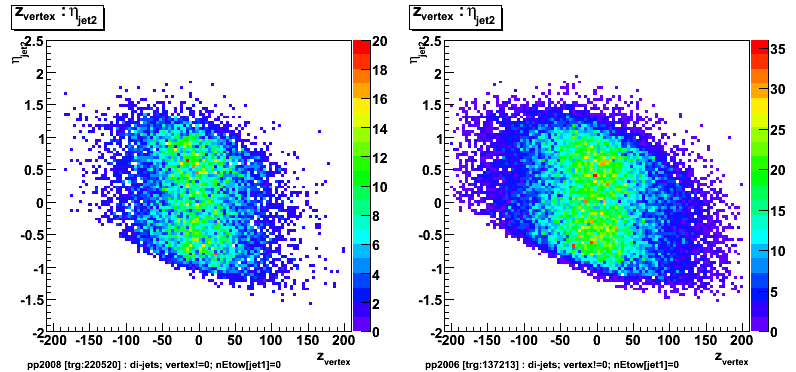
Figure 5: Transverse momentum distribution for jet1.
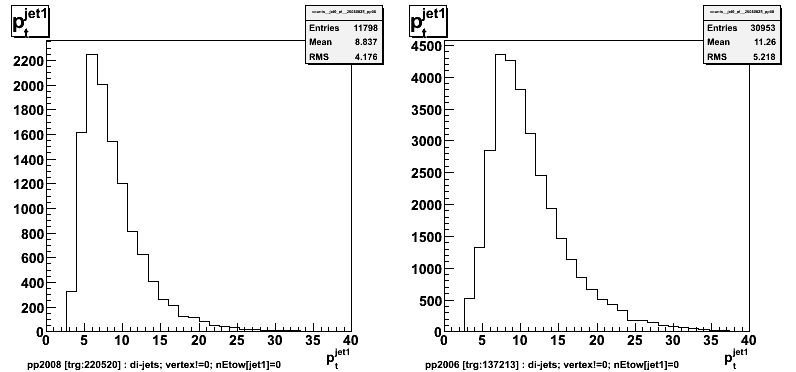
Figure 6: Number of barrel towers associated with jet1.
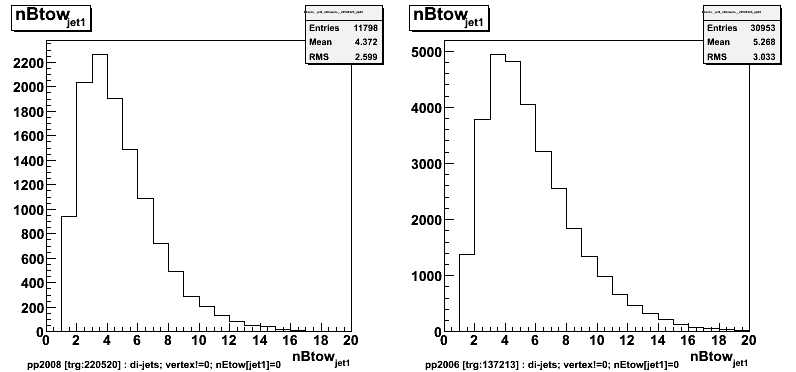
Figure 7: Number of charge tracks associated with jet1.
2008.08.26 Shower shape: more constrains for pre1>4E-3 bin
Ilya Selyuzhenkov August 26, 2008
Data sets:
- pp2006 - STAR 2006 pp longitudinal data (~ 3.164 pb^1) after applying gamma-jet isolation cuts.
- gamma-jet - data-driven Pythia gamma-jet sample (~170K events). Partonic pt range 5-35 GeV.
- QCD jets - data-driven Pythia QCD jets sample (~4M events). Partonic pt range 3-65 GeV.
Data-driven library:
- Four pre-shower bins: pre1,2=0, pre1=0,pre2>0 pre1<4MeV, pre1>=4MeV
- plus two energy bins (E<8GeV, E>=8GeV)
Figure 1: Pre-shower1 energy distribution for Pre1>4 MeV:
Eta meson library for E>8GeV bin [left] and data vs. MC results [right].
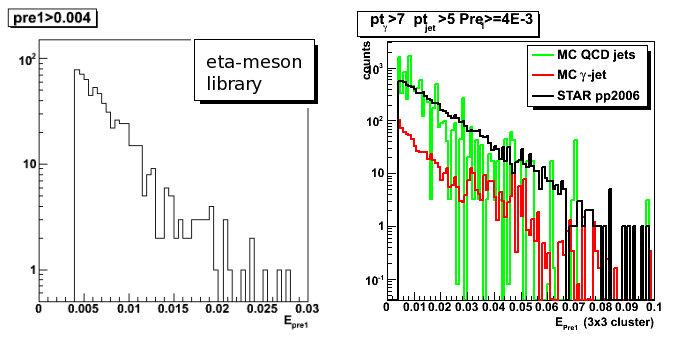
Figure 2: Shower shapes for v-plane [Pre1<10MeV cut]
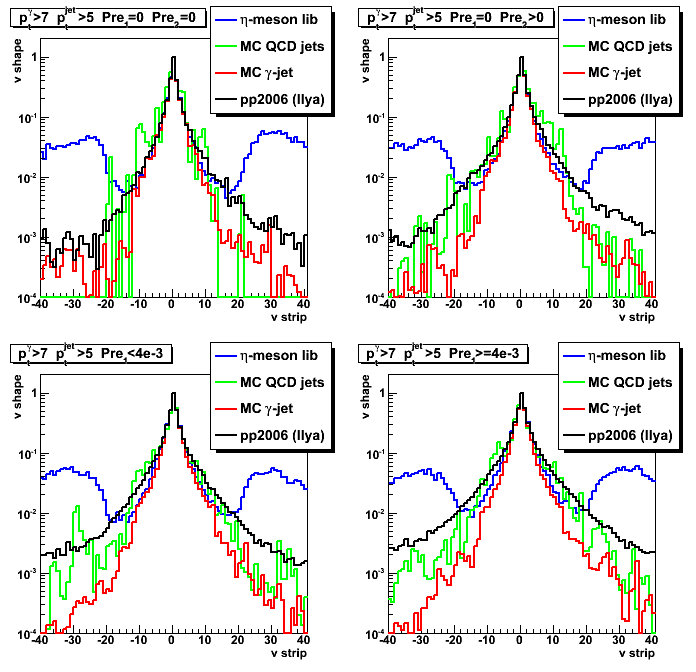
Figure 3: Shower shapes for u-plane [Pre1<10MeV cut]
Maximum side residual plots
Definitions for side residual plot (F_peak, F_tal, D_tail) can be found here
For a moment same 3-gaussian shape is used to fit SMD response for all pre-shower bins.
Algo needs to be updated with a new shapes sorted by pre-shower bins.
Figure 4: Sided residual plot for pp2006 data only [Pre1<10MeV cut]
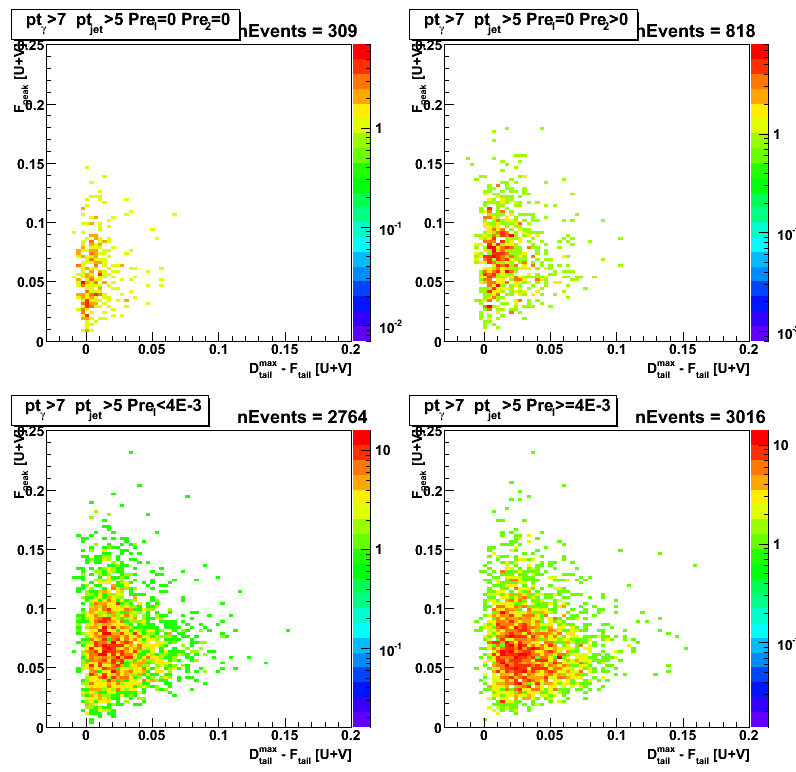
Figure 5: Sided residual projection on "Fitted Peak" axis [Pre1<10MeV cut]
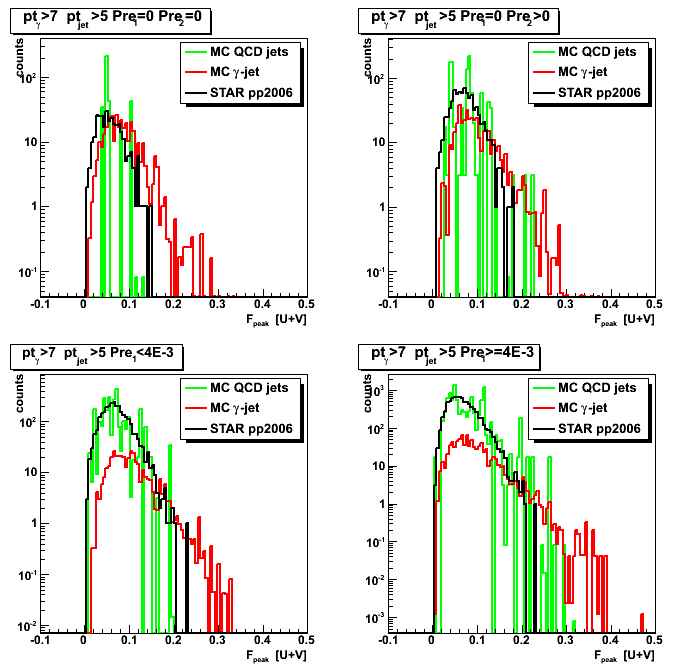
Figure 6: Sided residual projection on "tail difference" axis [Pre1<10MeV cut]
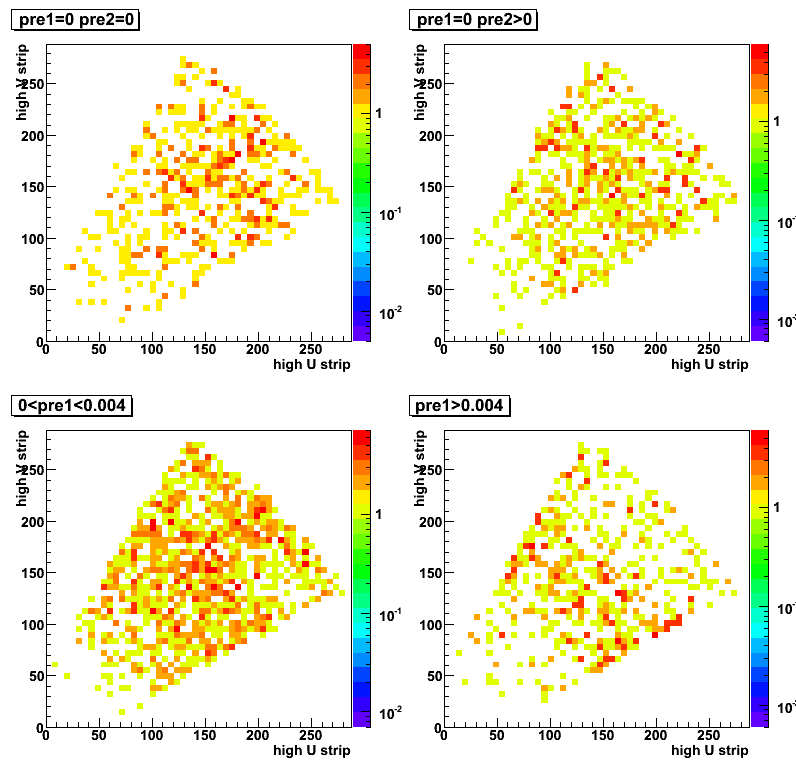
2008.08.27 Gamma-jet candidates detector position for different pre-shower conditions
Ilya Selyuzhenkov August 27, 2008
Data sets:
- pp2006 - STAR 2006 pp longitudinal data (~ 3.164 pb^1) after applying gamma-jet isolation cuts.
- gamma-jet - data-driven Pythia gamma-jet sample (~170K events). Partonic pt range 5-35 GeV.
- QCD jets - data-driven Pythia QCD jets sample (~4M events). Partonic pt range 3-65 GeV.
Figure 1: High u vs. v strip id distribution for different pre-shower conditions.
Left column: QCD jets, middle column: gamma-jet, right columnt: pp2006 data
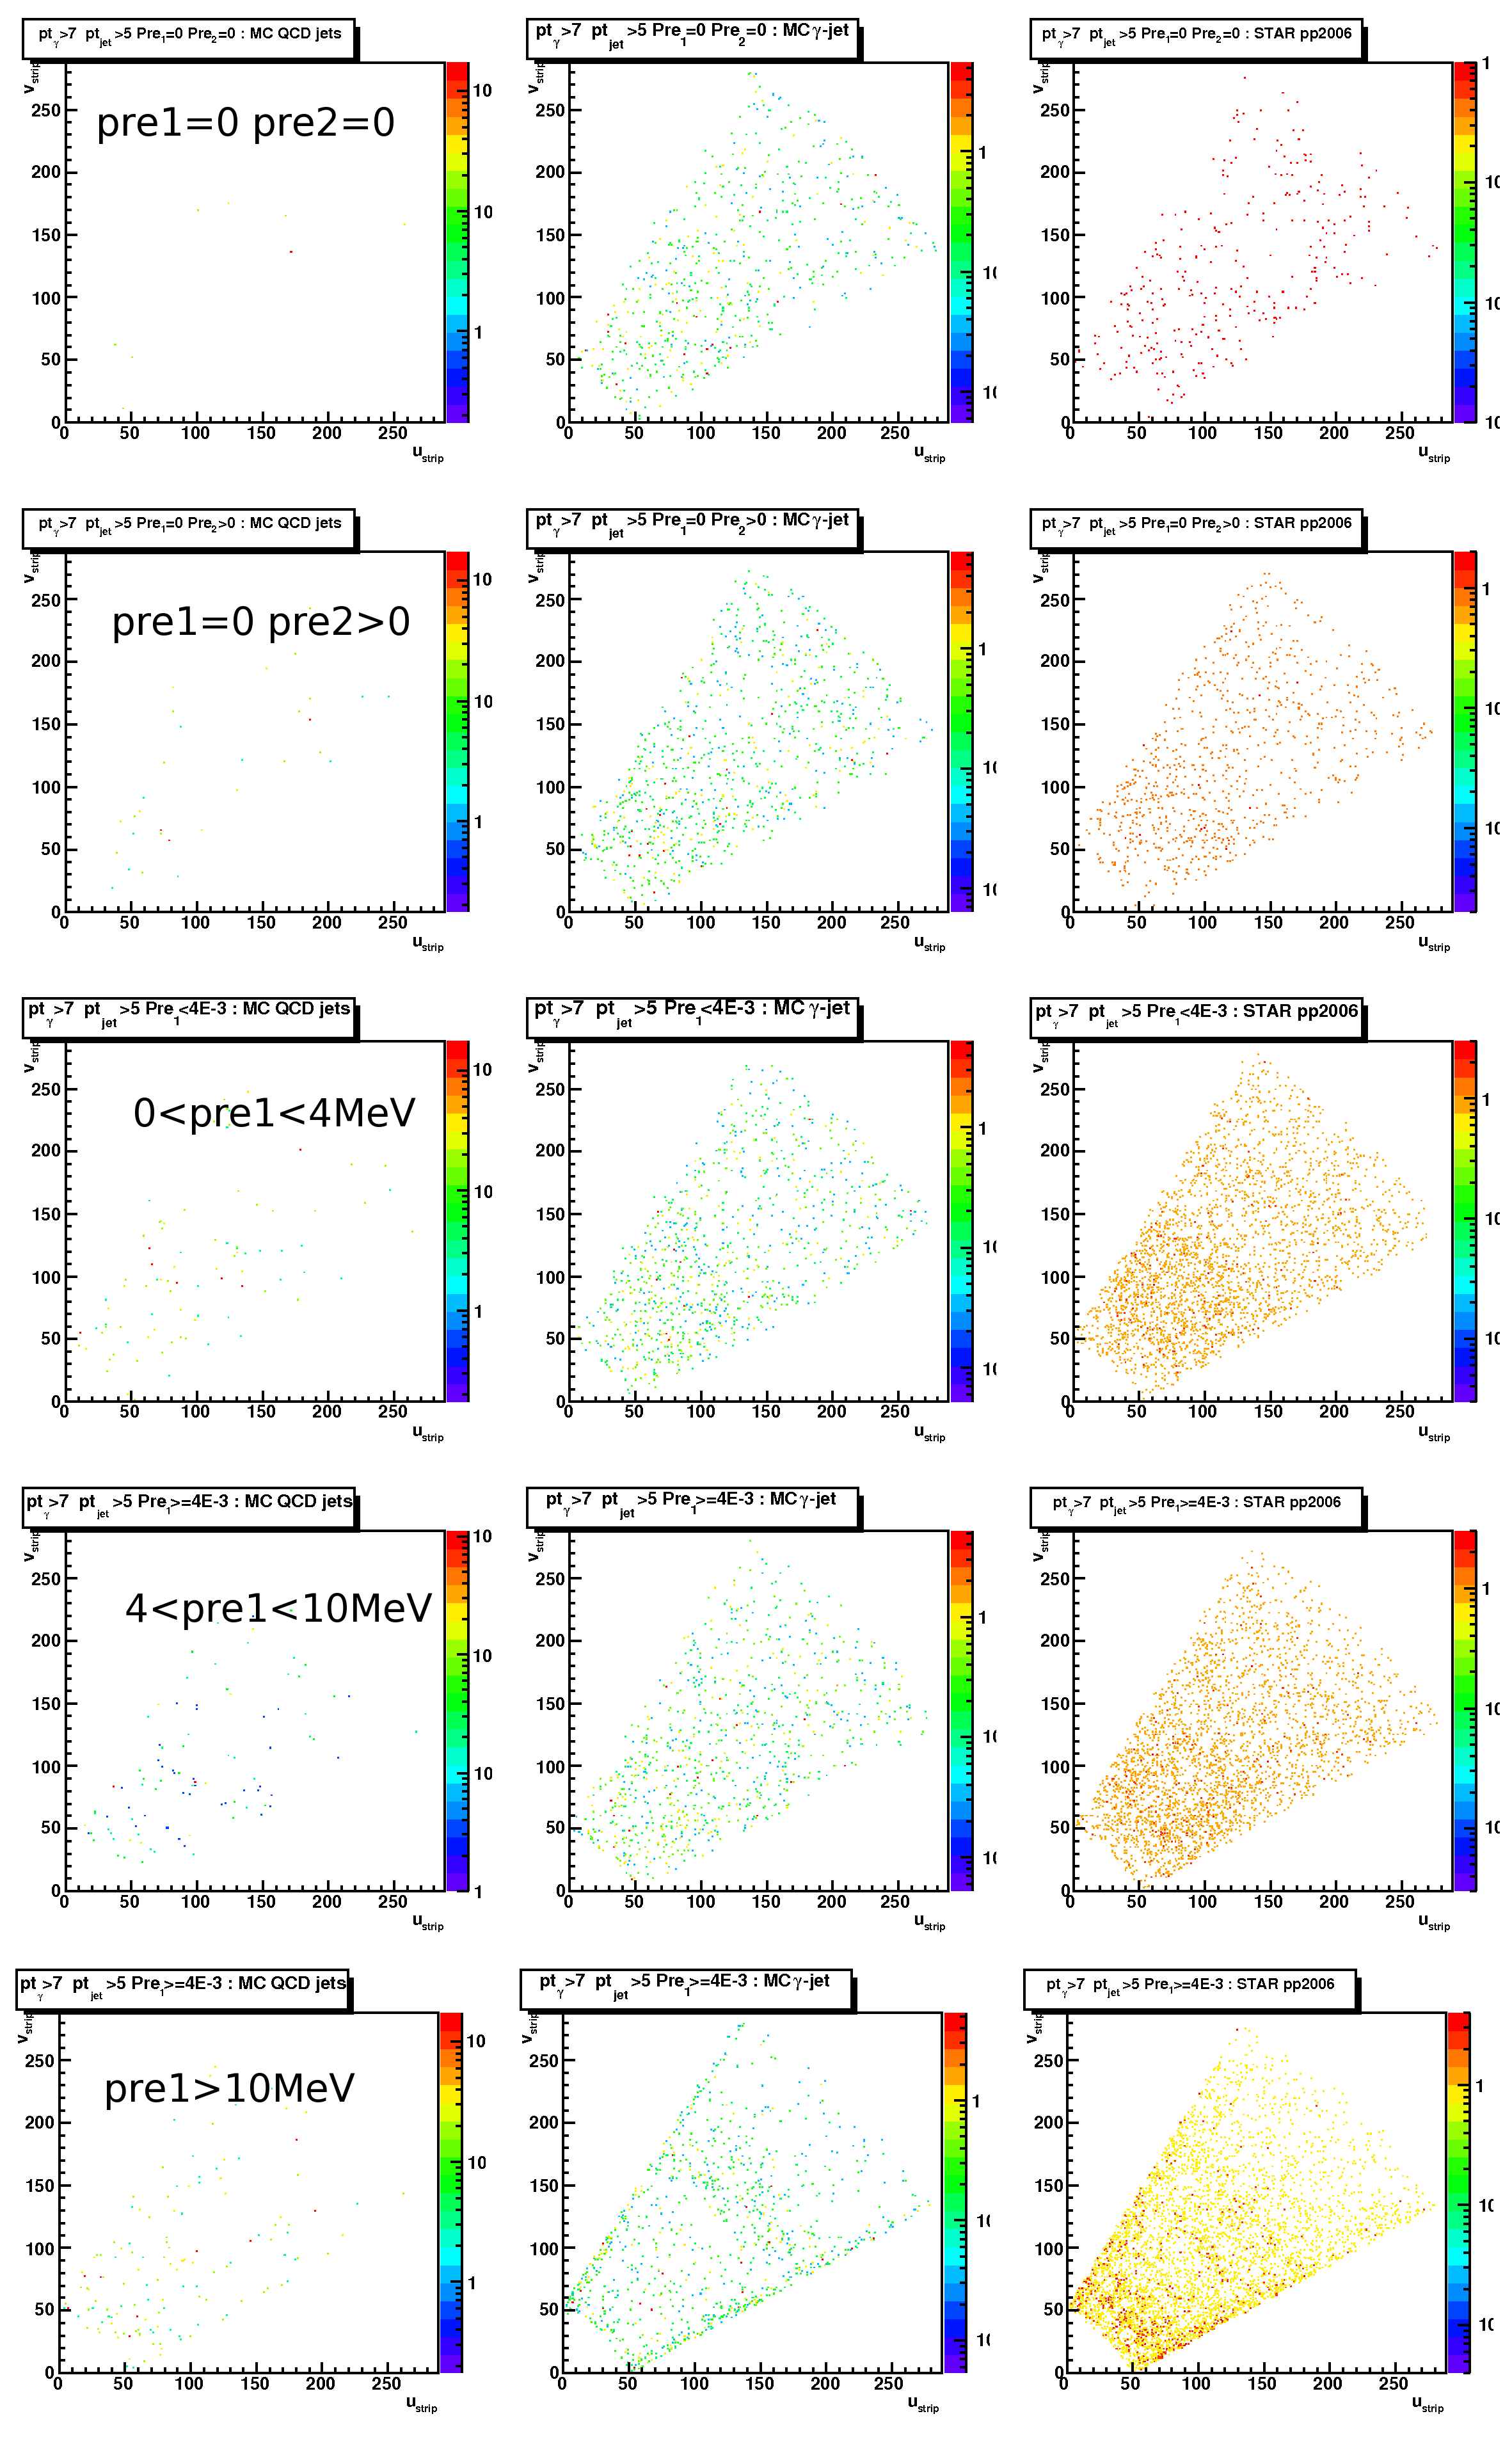
Figure 2: x vs. y position of the gamma-candidate within EEMC detector
for different pre-shower conditions.
Left column: QCD jets, middle column: gamma-jet, right columnt: pp2006 data
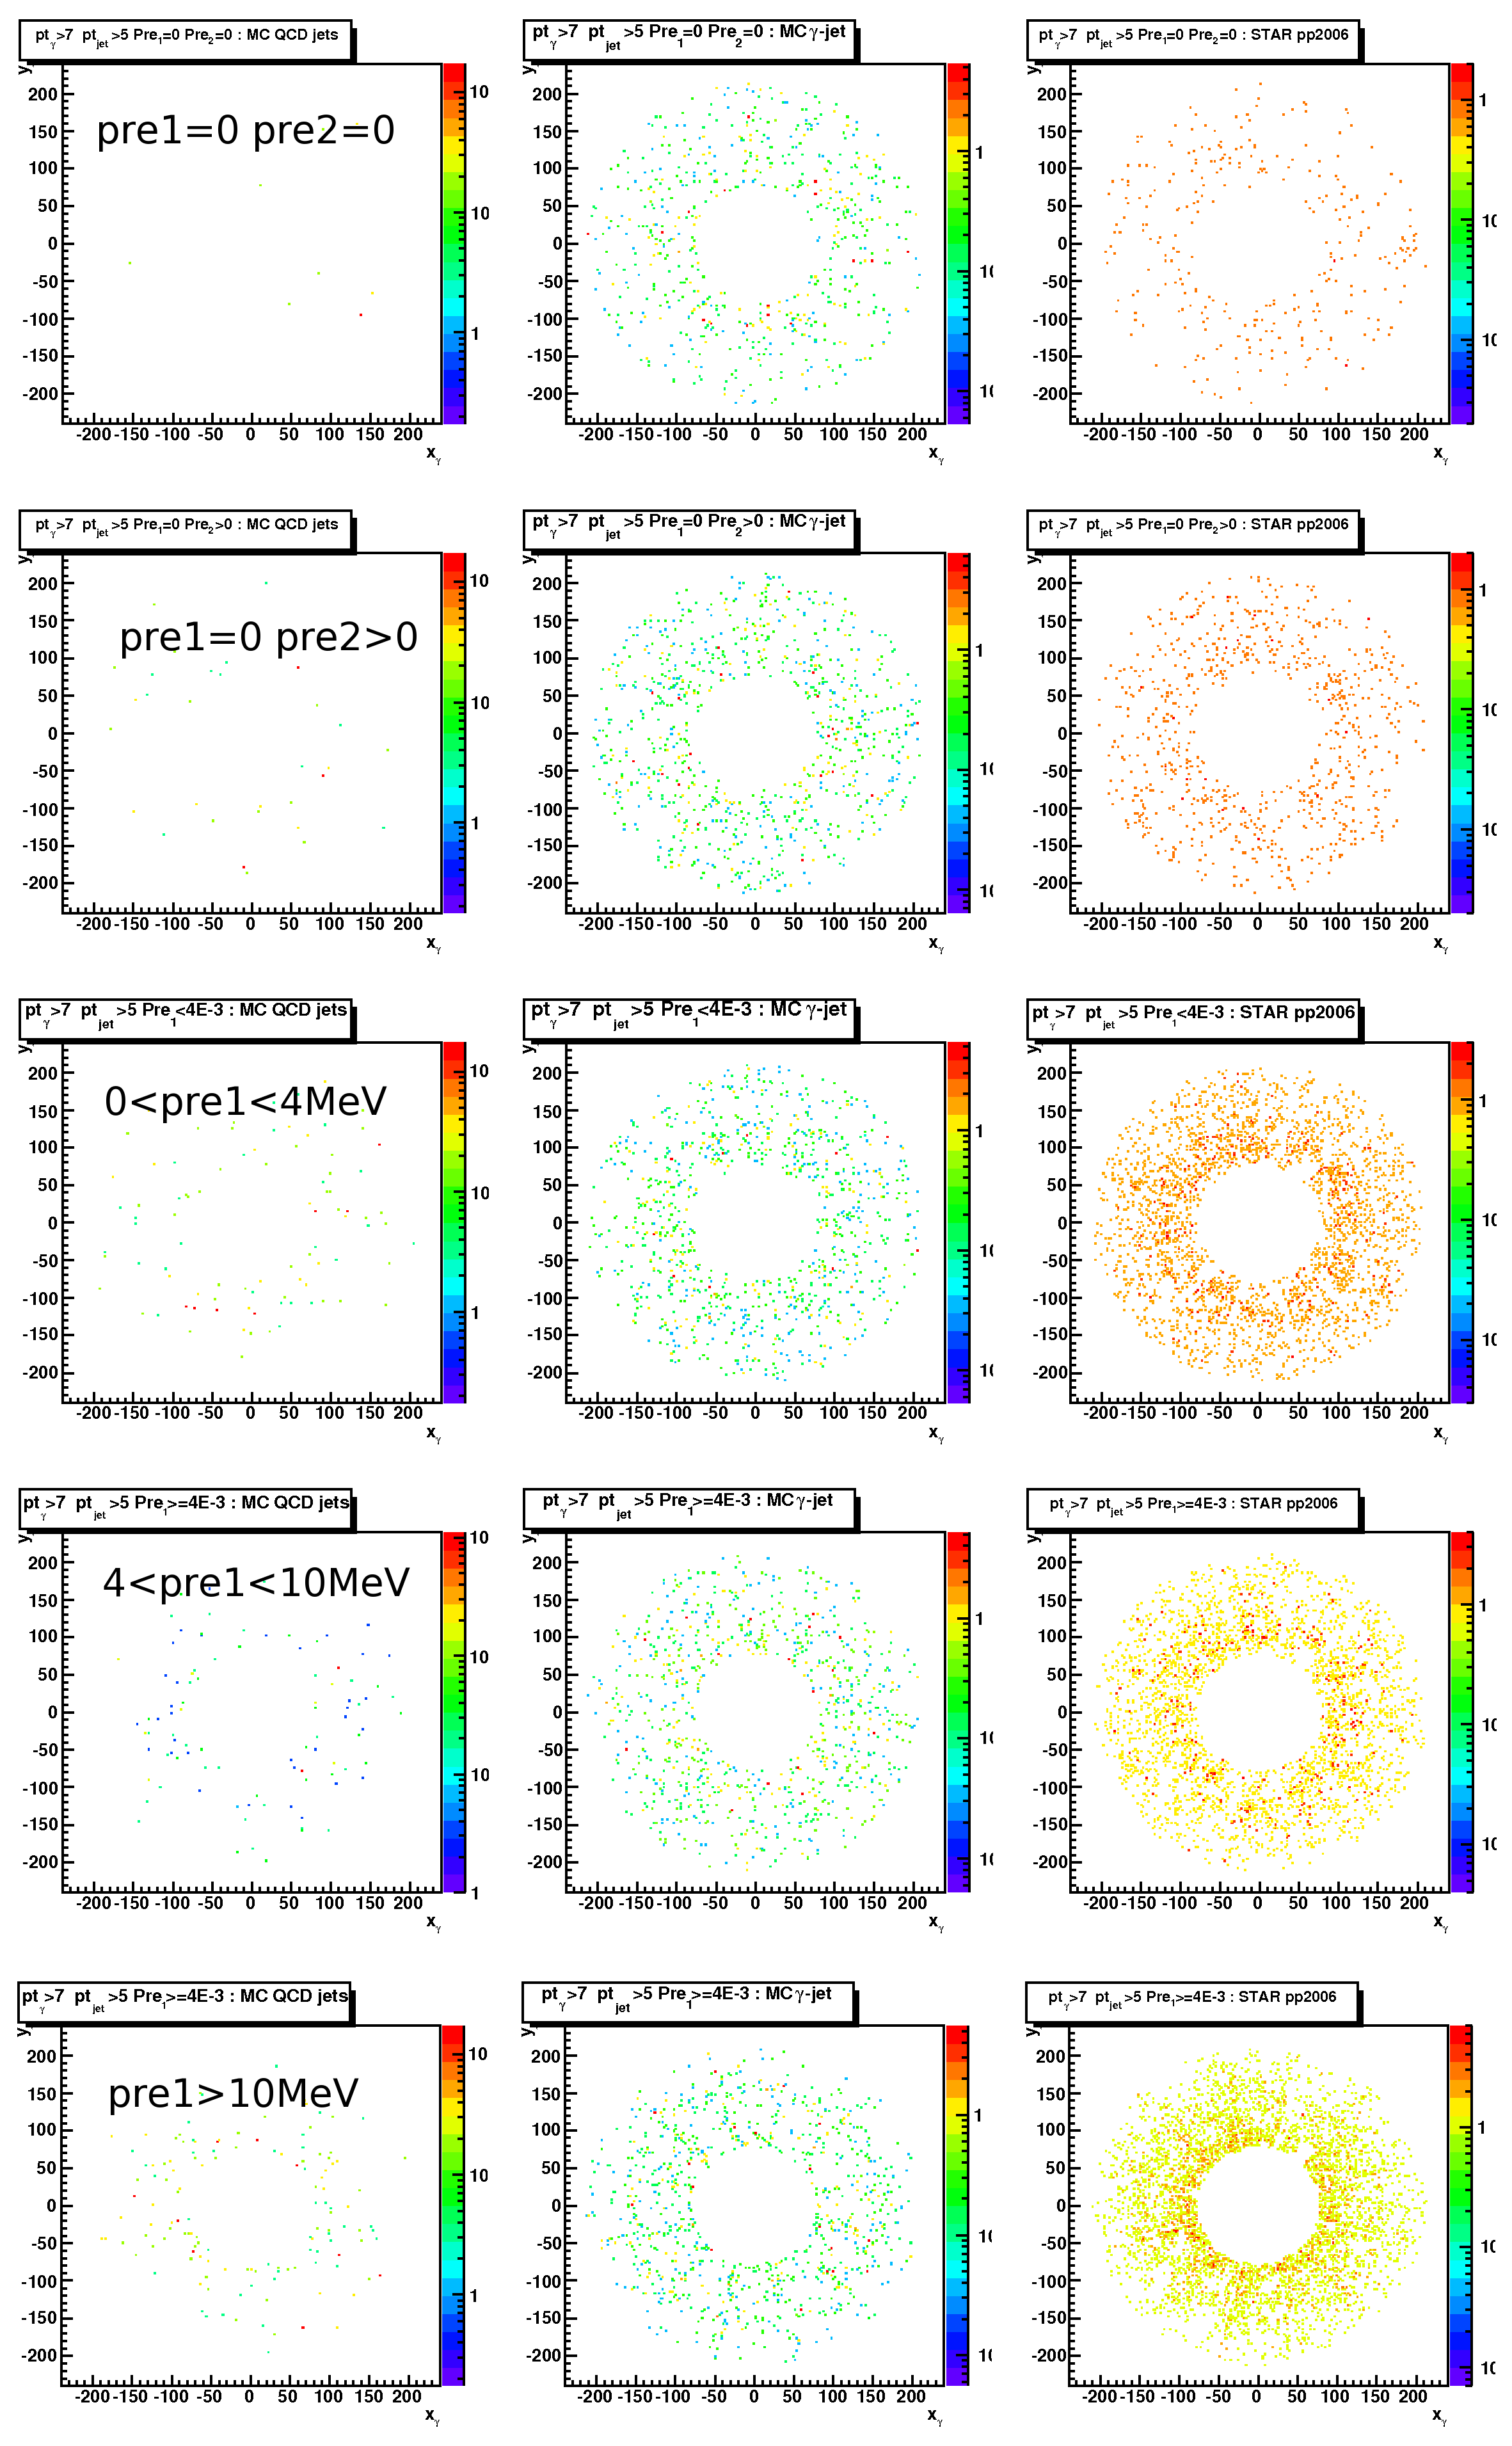
Figure 3:Reconstructed vs. generated (from geant record) gamma pt for the MC gamma-jet sample.
Pre-shower1<10MeV cut applied.
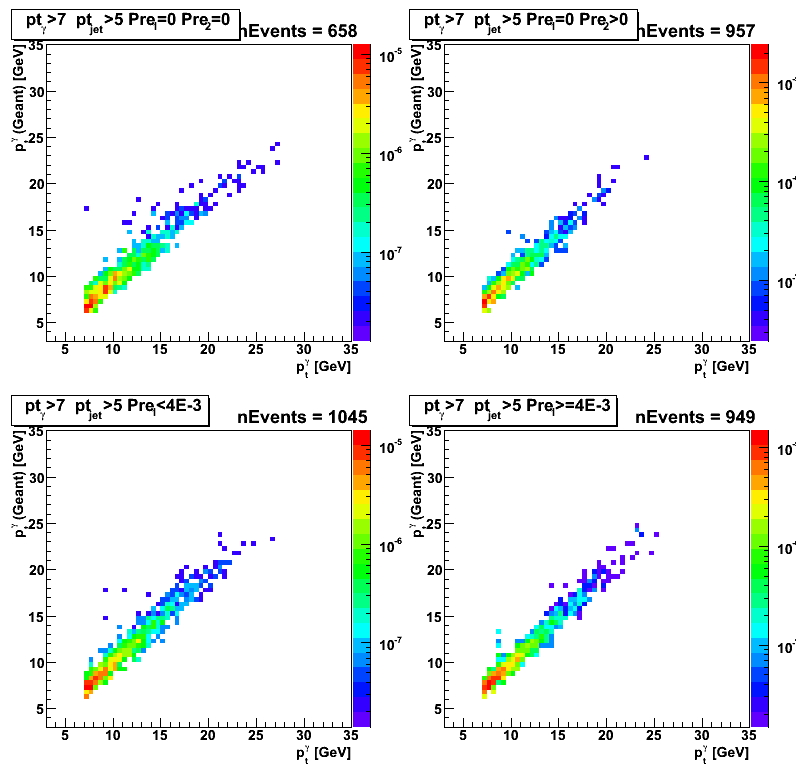
Figure 4:Reconstructed vs. generated (from geant record) gamma eta for the MC gamma-jet sample.
Pre-shower1<10MeV cut applied.
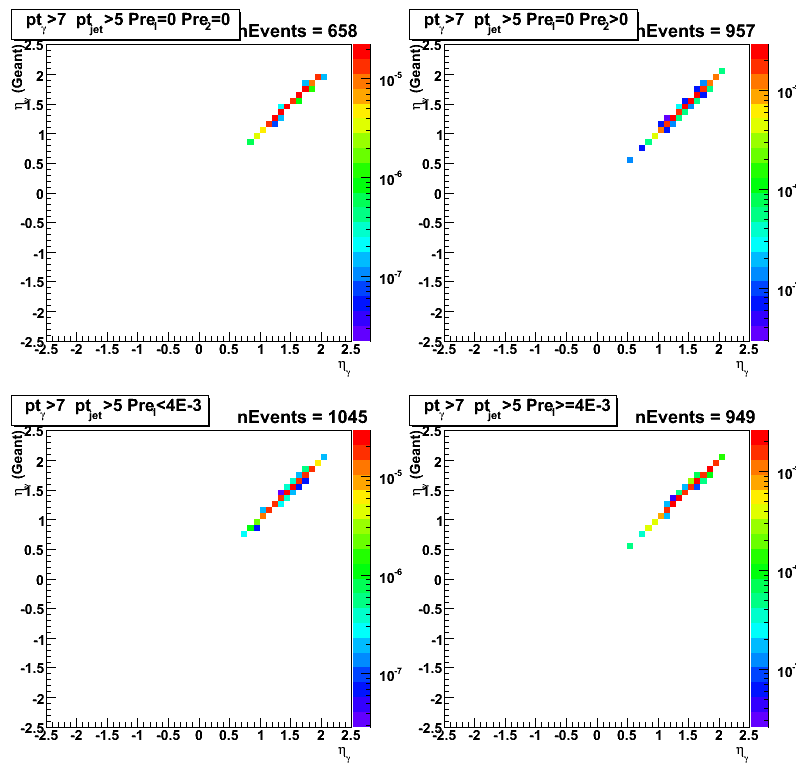
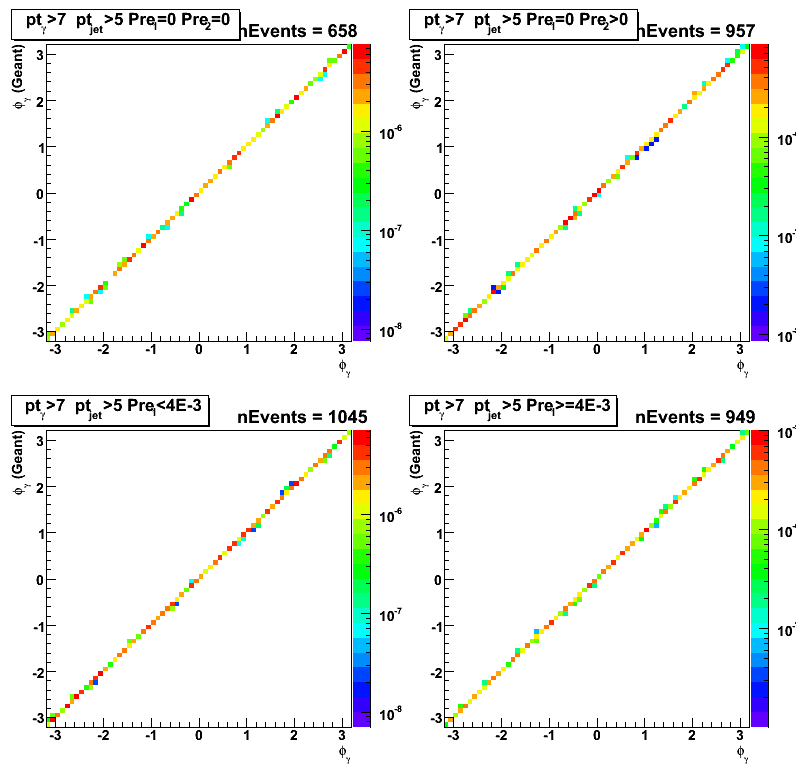
Figure 5:Reconstructed vs. generated (from geant record) gamma phi for the MC gamma-jet sample.
Pre-shower1<10MeV cut applied.
09 Sep
September 2008 posts
2008.09.02 Shower shape fits
Ilya Selyuzhenkov September 02, 2008
Data sets:
- pp2006 - STAR 2006 pp longitudinal data (~ 3.164 pb^1) after applying gamma-jet isolation cuts.
- gamma-jet - data-driven Pythia gamma-jet sample (~170K events). Partonic pt range 5-35 GeV.
- QCD jets - data-driven Pythia QCD jets sample (~4M events). Partonic pt range 3-65 GeV.
Shower shape fitting procedure:
- Fit with single Gaussian shape using 3 highest strips
- Fit with double Gaussian using 5 strips from each side of the peak [11 strips total]
First Gaussian parameters are fixed from the step above - Re-fit with double Gaussian with initial parameters from step 2 above
- Fit with triple Gaussian [fit range varies from 9 to 15 strips, default is 12 strips, see below]
Initial parameters for the first two Gaussian are fixed from step 3 above - Fit with triple Gaussian with initial parameters from step 4 above
(releasing all parameters except mean values)
Fitting function "[0]*(exp ( -0.5*((x-[1])/[2])**2 )+[3]*exp ( -0.5*((x-[4])/[5])**2 )+[6]*exp ( -0.5*((x-[7])/[8])**2 ))"
Fit results for MC gamma-jet data sample
Figure 1: MC gamma-jet shower shapes and fits for u-plane
Results from single, double and triple Gaussian fits (using from 9 to 15 strips) are shown.
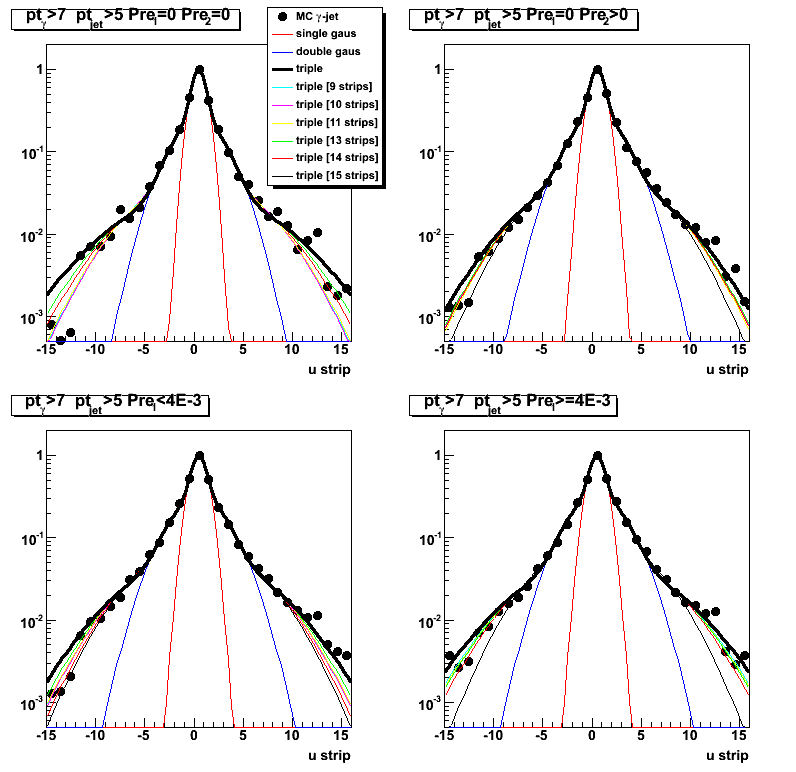
Figure 2: Same as figure 1. but from v-plane
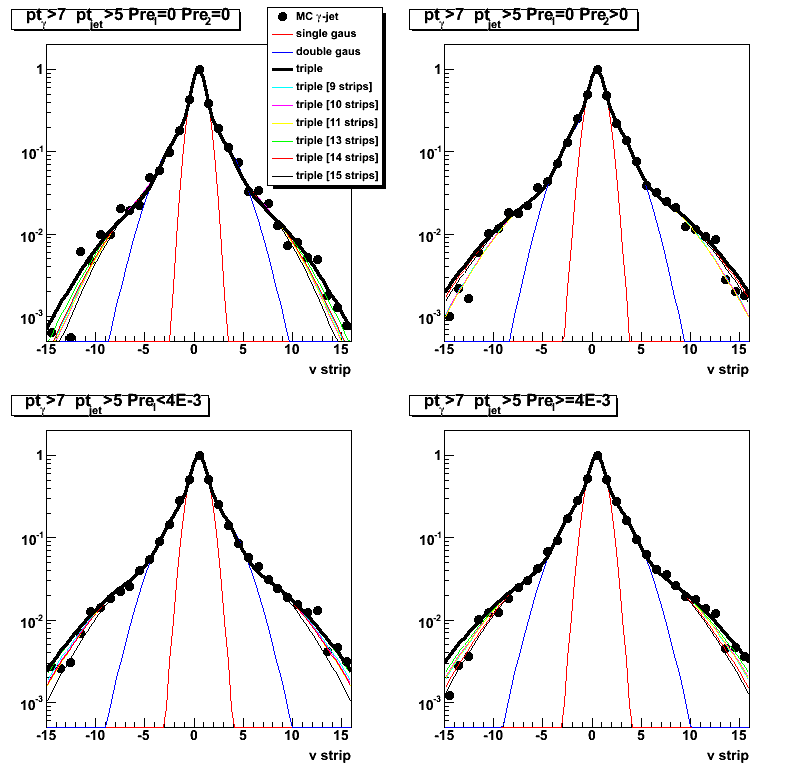
Figure 3: MC gamma-jet results using triple Gaussian fits within 12 strips from a peak.
Left: u-plane. Right: v-plane
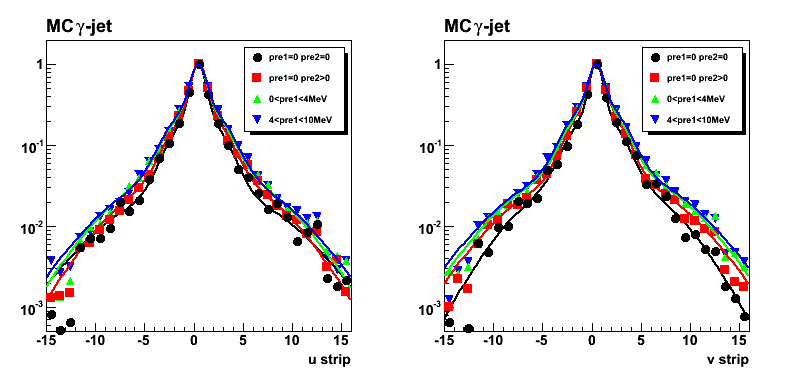
Figure 4: Combined fit results from MC gamma-jet sample
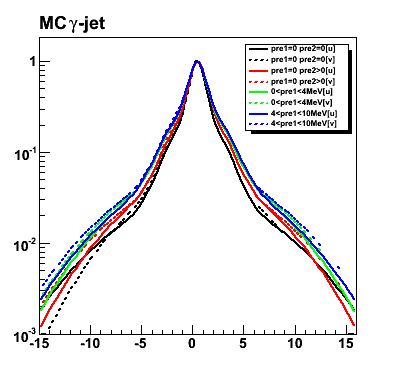
Figure 5: Fitting parameters [see equation for the fit function above].
Note, that parameters 1, 4, and 7 (peak position) has the same value.
Numerical fit results:
- pre1=0 pre2=0 [u]: 0.602039*((exp(-0.5*sq((x-0.491324)/0.605927))+(0.578161*exp(-0.5*sq((x-0.491324)/2.05454))))+(0.0937517*exp(-0.5*sq((x-0.491324)/6.37656))))
- pre1=0 pre2=0 [v]: 0.729744*((exp(-0.5*sq((x-0.480945)/0.621631))+(0.327792*exp(-0.5*sq((x-0.480945)/2.01717))))+(0.0410935*exp(-0.5*sq((x-0.480945)/6.49599))))
- pre1=0 pre2>0 [u]: 0.725212*((exp(-0.5*sq((x-0.474451)/0.560416))+(0.3332*exp(-0.5*sq((x-0.474451)/1.91957))))+(0.0611053*exp(-0.5*sq((x-0.474451)/5.34357))))
- pre1=0 pre2>0 [v]: 0.686446*((exp(-0.5*sq((x-0.536662)/0.650485))+(0.388429*exp(-0.5*sq((x-0.536662)/1.99118))))+(0.0712328*exp(-0.5*sq((x-0.536662)/5.64637))))
- 0 <4MeV [u]: 0.612486*((exp(-0.5*sq((x-0.485717)/0.592415))+(0.55846*exp(-0.5*sq((x-0.485717)/1.87214))))+(0.0749598*exp(-0.5*sq((x-0.485717)/6.12462))))
- 0 <4MeV [v]: 0.651584*((exp(-0.5*sq((x-0.486876)/0.652023))+(0.450767*exp(-0.5*sq((x-0.486876)/2.07667))))+(0.0864232*exp(-0.5*sq((x-0.486876)/5.84357))))
- 4 <10MeV [u]: 0.621905*((exp(-0.5*sq((x-0.496841)/0.632917))+(0.512575*exp(-0.5*sq((x-0.496841)/1.97482))))+(0.0927374*exp(-0.5*sq((x-0.496841)/6.10844))))
- 4 <10MeV [v]: 0.634943*((exp(-0.5*sq((x-0.505378)/0.660763))+(0.480929*exp(-0.5*sq((x-0.505378)/2.17312))))+(0.0788037*exp(-0.5*sq((x-0.505378)/6.21667))))
Fit results for pp2006 gamma-jet candidates
Figure 6: Same as Fig. 3, but for gamma-jet candidates from pp2006 data
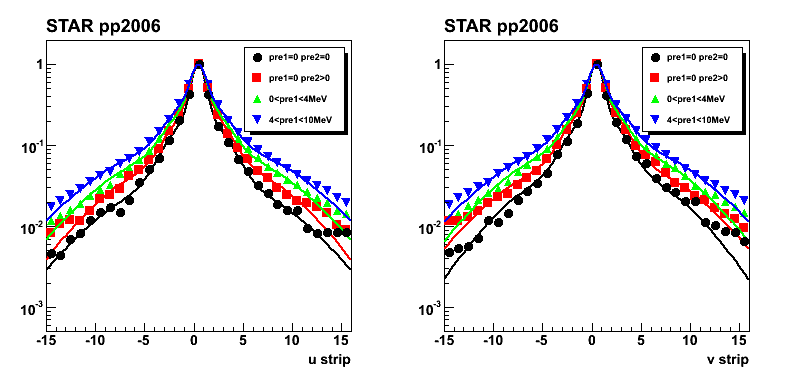
Figure 7: Same as Fig. 5, but for gamma-jet candidates from pp2006 data
2008.09.09 Maximum sided residual with shower shapes sorted by uv- and pre-shower bins
Ilya Selyuzhenkov September 09, 2008
Data sets:
- pp2006 - STAR 2006 pp longitudinal data (~ 3.164 pb^1) after applying gamma-jet isolation cuts.
- gamma-jet - data-driven Pythia gamma-jet sample (~170K events). Partonic pt range 5-35 GeV.
- QCD jets - data-driven Pythia QCD jets sample (~4M events). Partonic pt range 3-65 GeV.
Procedure to calculate maximum sided residual:
-
For each event fit SMD u and v energy distributions with
triple Gaussian functions from shower shapes analysis:[0]*(exp(-0.5*((x-[1])/[2])**2)+[3]*exp(-0.5*((x-[1])/[4])**2)+[6]*exp(-0.5*((x-[1])/[5])**2))
Fit parameters sorted by various pre-shower conditions and u and v-planes can be found here
There are only two free parameters in a final fit: overall amplitude [0] and mean value [1]
Fit range is +-2 strips from the high strip (5 strips total). -
Integrate energy from a fit within +-2 strips from high strip.
This is our peak energy from fit, F_peak. -
Calculate tail energies on left and right sides from the peak for both data, D_tail, and fit, F_tail.
Tails are integrated up to 30 strips excluding 5 highest strips.
Determine maximum difference between D_tail and F_tail:
max(D_tail-F_tail). This is our maximum sided residual. -
Plot F_peak vs. max(D_tail-F_tail). This is sided residual plot.
-
(implementation for this item is in progress)
Based on MC gamma-jet sided residual plot find a line (some polynomial function)
which will serve as a cut to separate signal and background.
Use that cut line to calculate signal to background ratio
and apply it for the real data analysis.
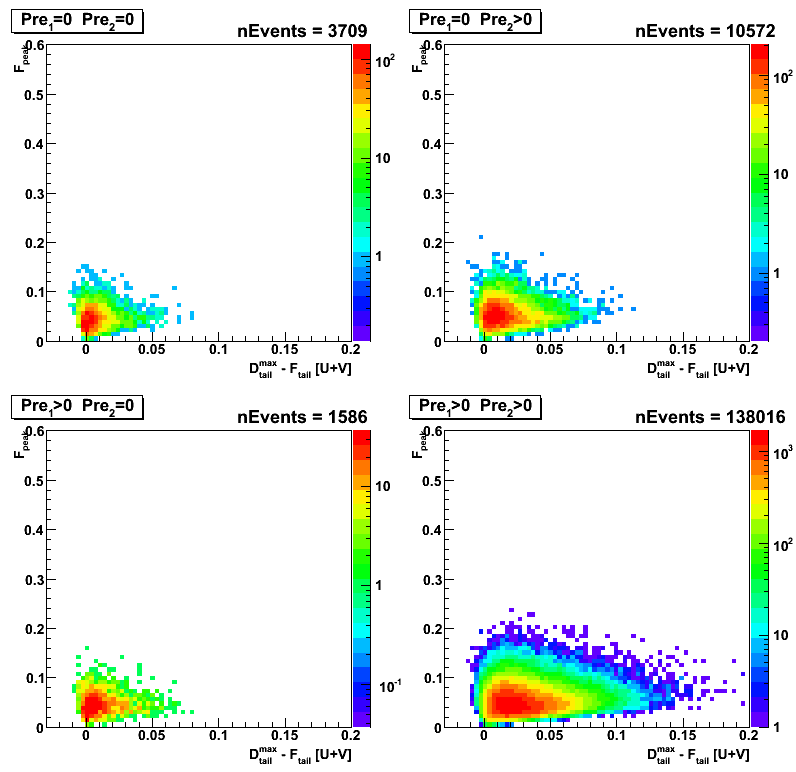
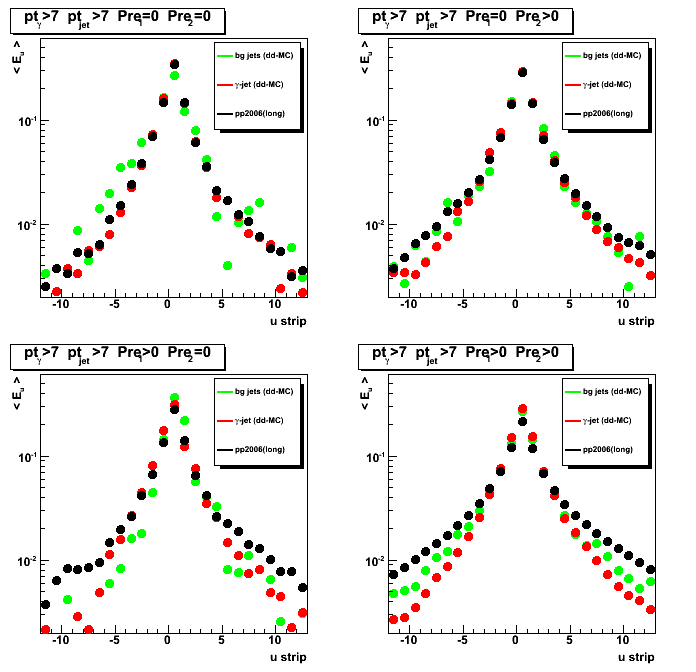
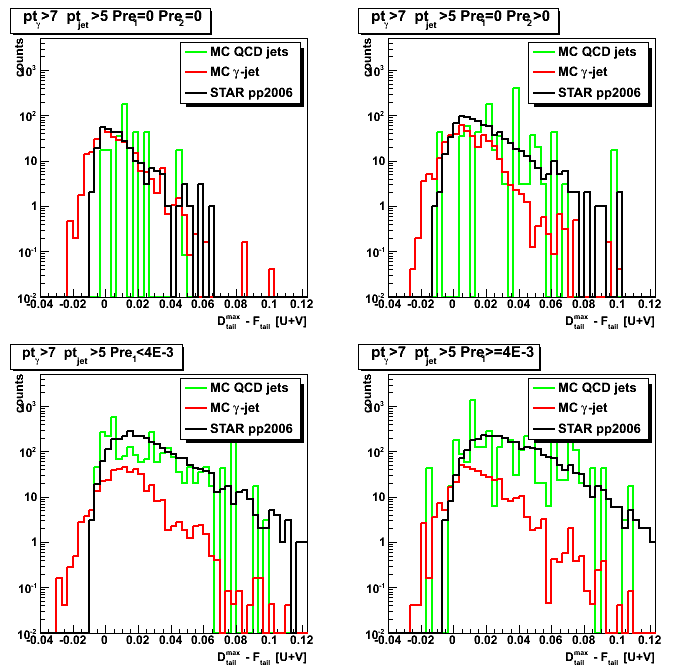
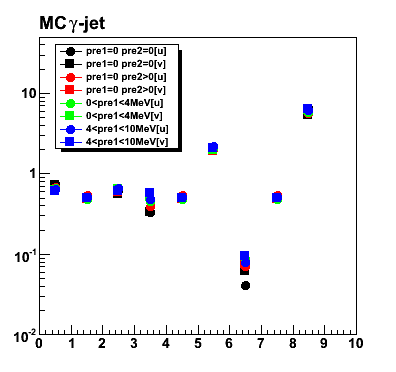
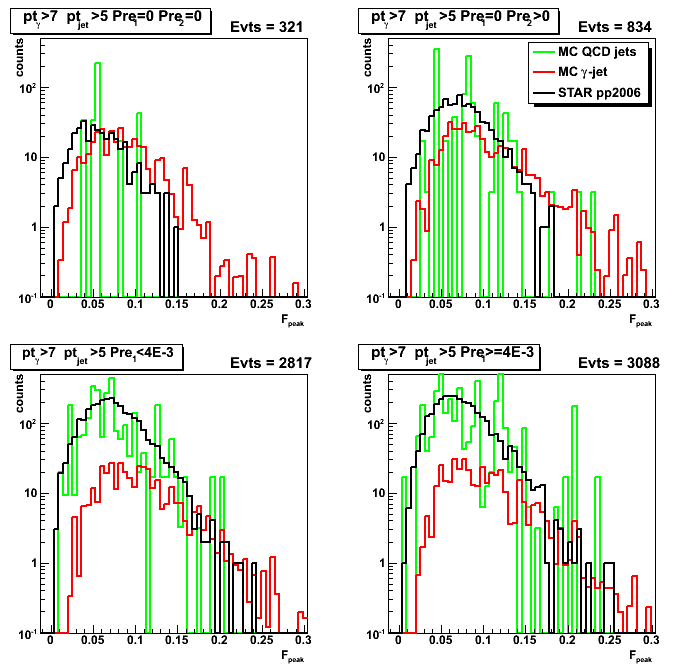
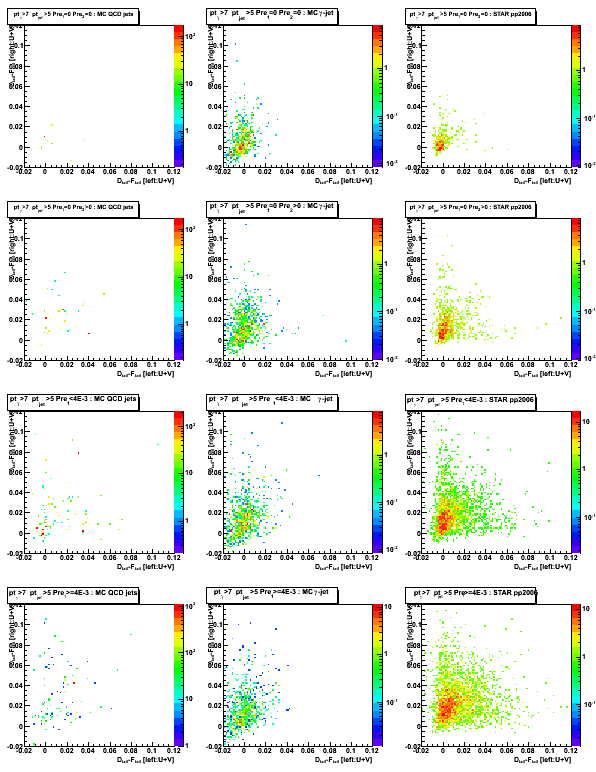
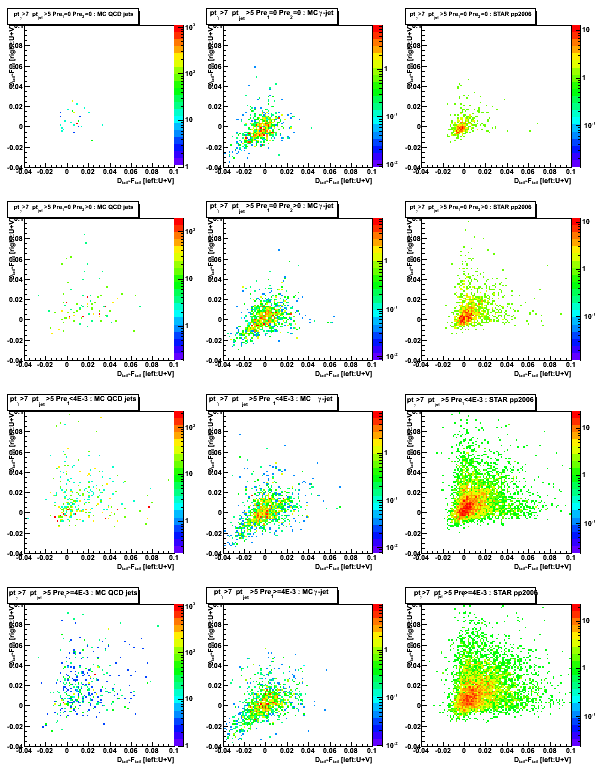
Figure 1: Maximum sided residual plots for different data sets and various pre-shower condition.
Columns [data sets]: 1. MC QCD background; 2. gamma-jet; 3. pp2006 data
Rows [pre-shower bins]: 1. pre1=0 pre2=0; 2. pre1=0, pre2>0; 3. 0<pre1<4MeV; 4. 4<pre1<10MeV
Results from u and v plane are combined as [U+V]/2
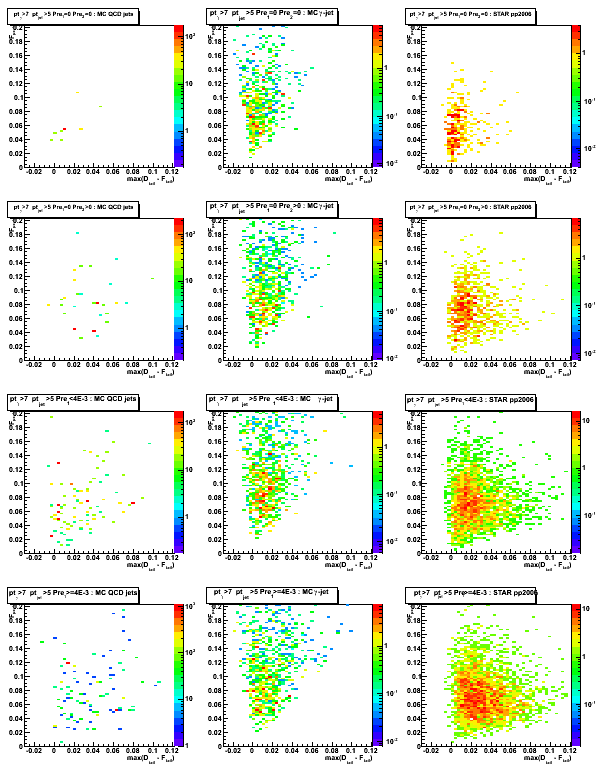
Figure 2: max(D_tail-F_tail) distribution (projection on horizontal axis from Fig.1)
Some observations:
Results for pp2006 and MC gamma-jet are consistent for pre1=0 pre2=0 case (upper left plot)
Results for pp2006 and MC QCD background jets are also in agrees for pre1>0 case (lower left and right plots)
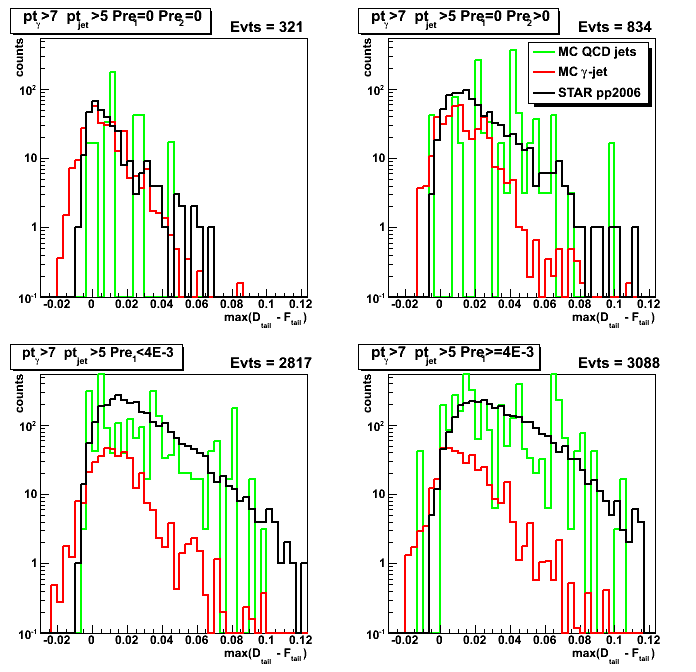
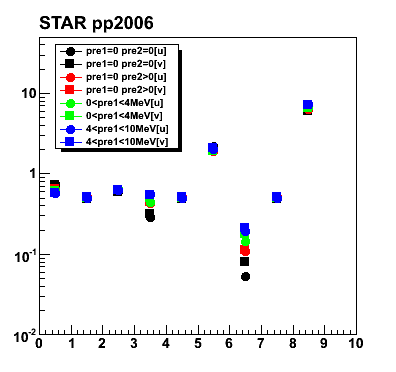
Figure 3: F_peak distribution (projection on vertical axis from Fig.1)
2008.09.16 QA plots for maximum sided residual (obsolete)
Ilya Selyuzhenkov September 16, 2008
These results are obsolete.
Please use this link instead
Data sets:
- pp2006 - STAR 2006 pp longitudinal data (~ 3.164 pb^1) after applying gamma-jet isolation cuts.
- gamma-jet - data-driven Pythia gamma-jet sample (~170K events). Partonic pt range 5-35 GeV.
- QCD jets - data-driven Pythia QCD jets sample (~4M events). Partonic pt range 3-65 GeV.
Notations used in the plots:
- Fit peak energy:
F_peak - integral within +-2 strips from maximum strip
Maximum strip determined by fitting procedure.
Float value converted ("cutted") to integer value. - Data peak energy:
D_peak - energy sum within +-2 strips from maximum strip (the same strip Id as for F_peak). - Data tails:
D_tail^left and D_tail^right.
Energy sum from 3rd strip up to 30 strips on the
left and right sides from maximum strip (excludes strips which contributes to D_peak) - Fit tails:
F_tail^left and F_tail^right.
Same definition as for D_tail, but integrals are calculated from a fit function. - Maximum sided residual:
max(D_tail-F_tail)
Maximum of the data minus fit energy on the left and right sides from the peak.
Figure 1: D_peak from [U+V]/2.
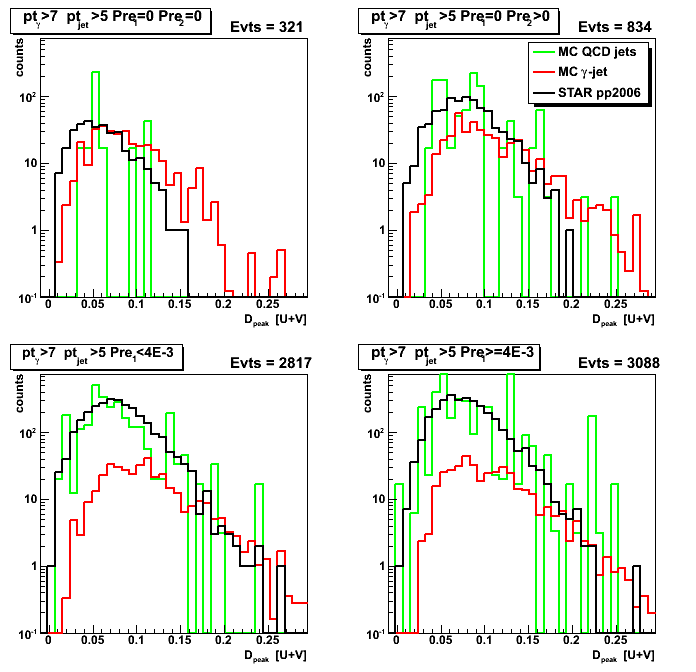
Figure 2: U/V asymmetry for D_peak: [U-V]/[U+V]
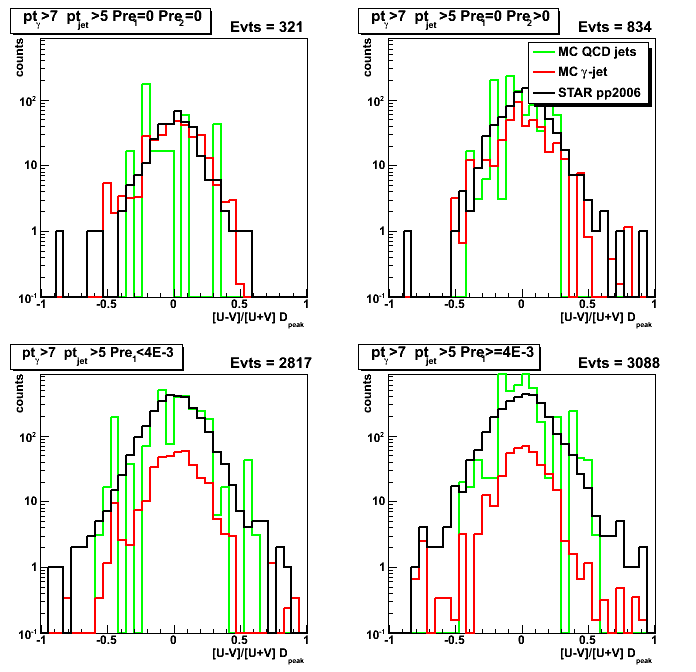
Figure 3: F_peak from [U+V]/2.
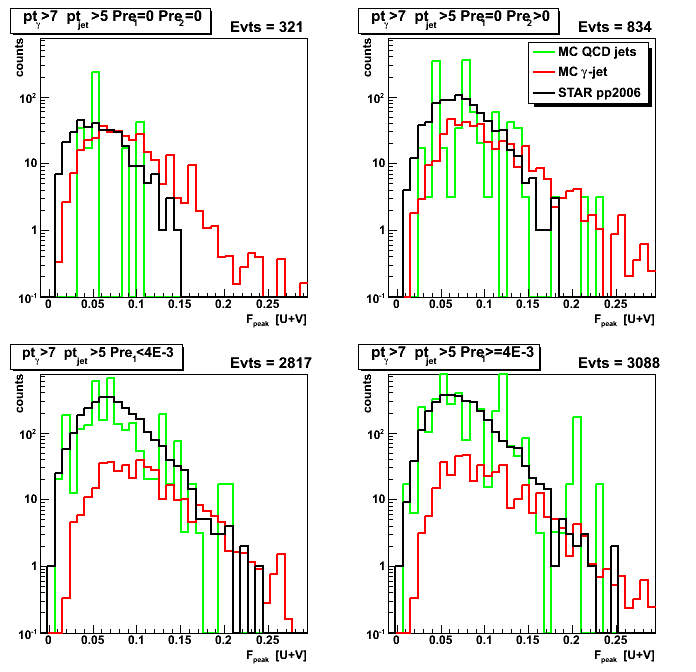
Figure 4: U/V asymmetry for F_peak: [U-V]/[U+V]
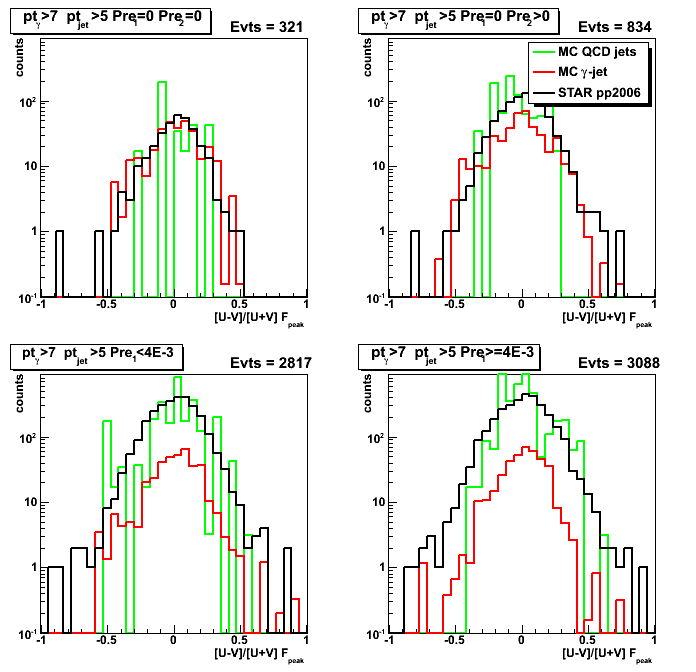
Figure 5: (D_peak - F_peak)/D_peak asymmetry
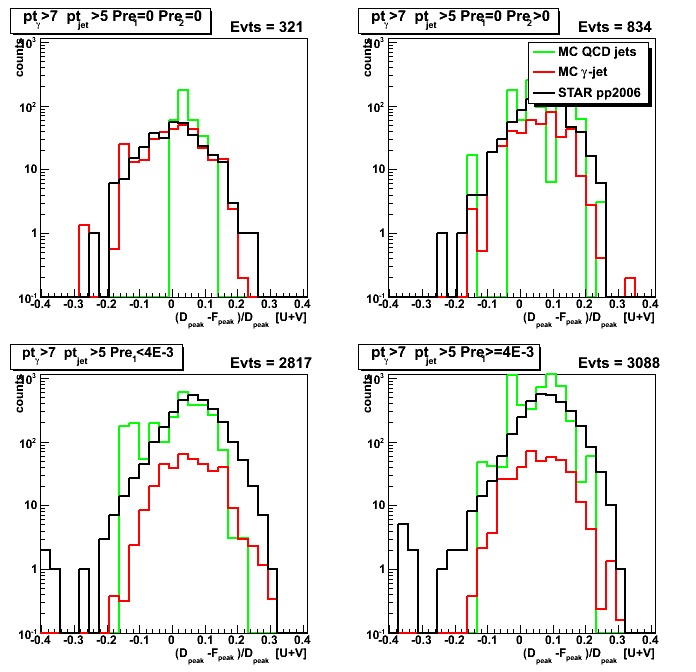
Figure 6: Maximum sided residual from V vs. U plane.
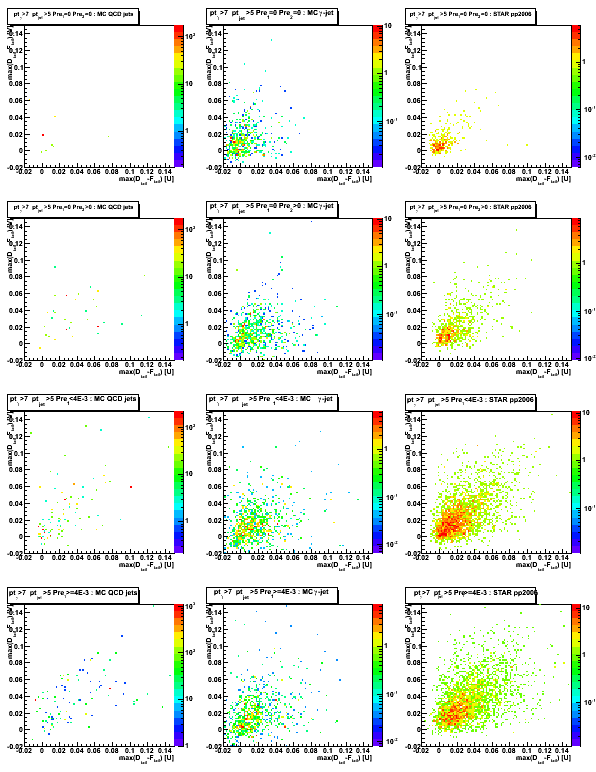
Figure 7: (D_tail-F_tail)^right vs. (D_tail-F_tail)^left
2008.09.23 QA plots for maximum sided residual (bug fixed update)
Ilya Selyuzhenkov September 23, 2008
Data sets:
- pp2006 - STAR 2006 pp longitudinal data (~ 3.164 pb^1)
after applying gamma-jet isolation cuts (note: R_cluster > 0.9 is used below). - gamma-jet - data-driven Pythia gamma-jet sample (~170K events). Partonic pt range 5-35 GeV.
- QCD jets - data-driven Pythia QCD jets sample (~4M events). Partonic pt range 3-65 GeV.
Notations used in the plots:
- Fit peak energy:
F_peak - integral within +-2 strips from maximum strip
Maximum strip determined by fitting procedure.
Float value converted ("cutted") to integer value. - Data peak energy:
D_peak - energy sum within +-2 strips from maximum strip (the same strip Id as for F_peak). - Data tails:
D_tail^left and D_tail^right.
Energy sum from 3rd strip up to 30 strips on the
left and right sides from maximum strip (excludes strips which contributes to D_peak) - Fit tails:
F_tail^left and F_tail^right.
Same definition as for D_tail, but integrals are calculated from a fit function. - Maximum sided residual:
max(D_tail-F_tail)
Maximum of the data minus fit energy on the left and right sides from the peak.
Figure 1: D_peak from [U+V]/2.
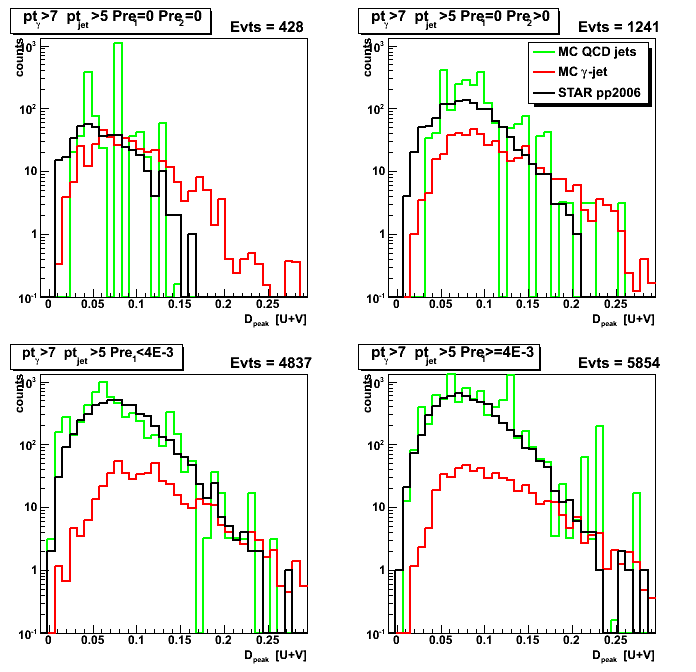
Figure 2: (D_peak - F_peak)/D_peak asymmetry
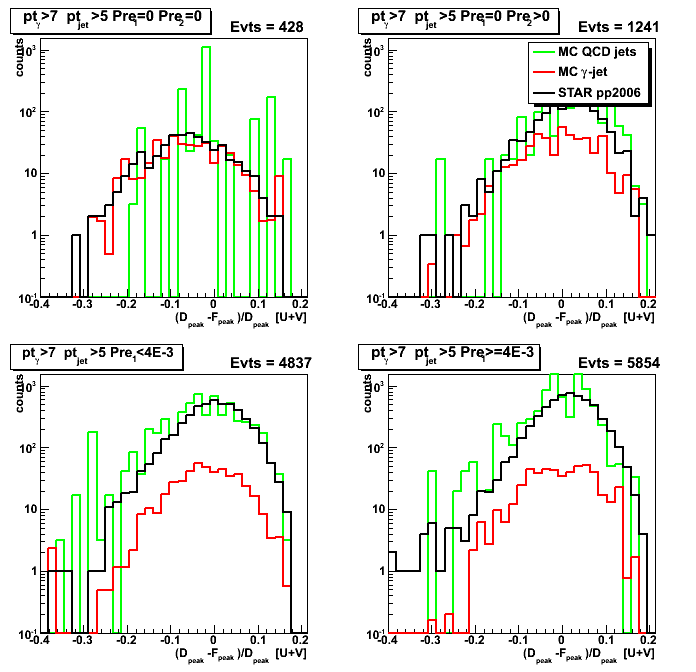
Figure 3: Maximum sided residual from V vs. U plane.
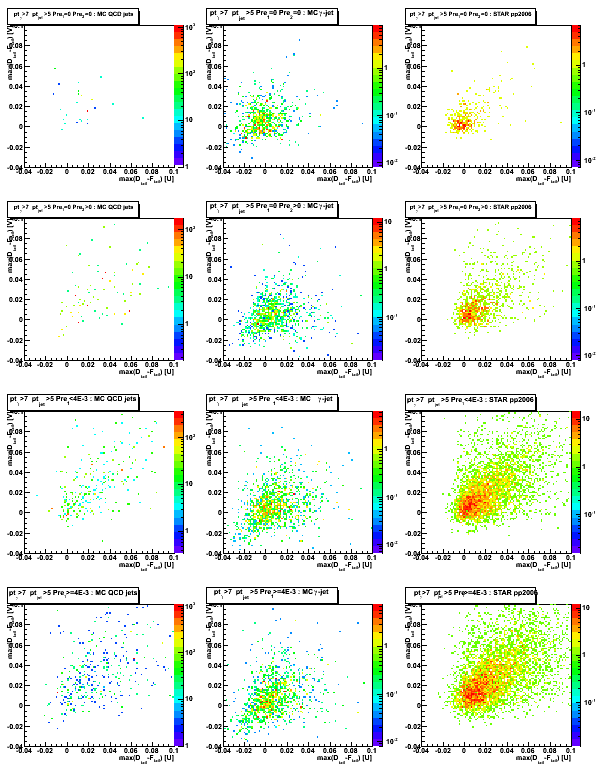
Figure 4: (D_tail-F_tail)^right. (D_tail-F_tail)^left
2008.09.23 Right-left SMD tail asymmetries
Ilya Selyuzhenkov September 23, 2008
Figure 1: D_peak vs. [right-left] D_tail
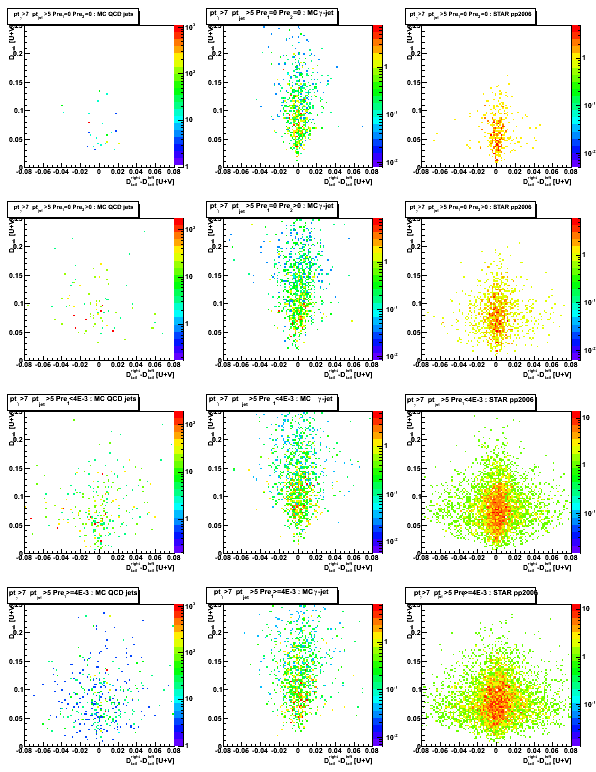
Figure 2: [right-left]/[right-+left] D_tail
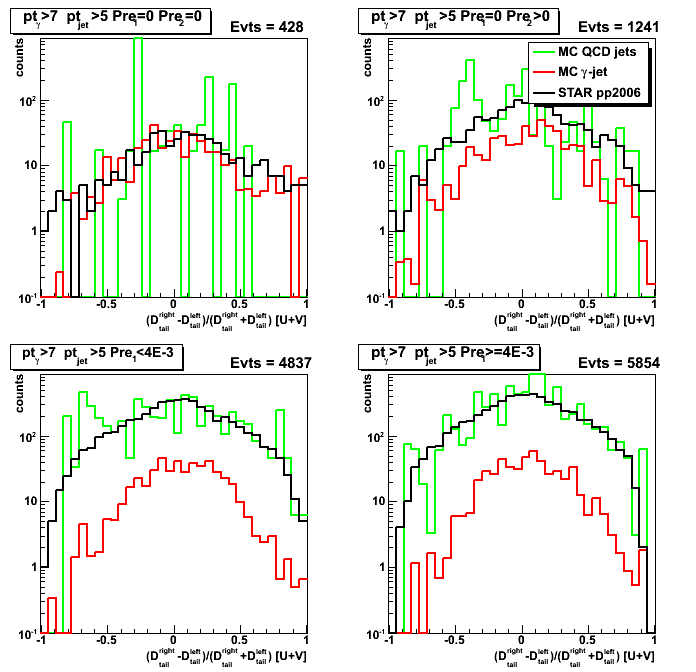
2008.09.23 Sided residual plot projection: toward s/b efficency/rejection plot
Ilya Selyuzhenkov September 23, 2008
Data sets:
- pp2006 - STAR 2006 pp longitudinal data (~ 3.164 pb^1)
after applying gamma-jet isolation cuts (note: R_cluster > 0.9 is used below). - gamma-jet - data-driven Pythia gamma-jet sample (~170K events). Partonic pt range 5-35 GeV.
- QCD jets - data-driven Pythia QCD jets sample (~4M events). Partonic pt range 3-65 GeV.
Notations used in the plots:
- Fit peak energy:
F_peak - integral within +-2 strips from maximum strip
Maximum strip determined by fitting procedure.
Float value converted ("cutted") to integer value. - Data peak energy:
D_peak - energy sum within +-2 strips from maximum strip (the same strip Id as for F_peak). - Data tails:
D_tail^left and D_tail^right.
Energy sum from 3rd strip up to 30 strips on the
left and right sides from maximum strip (excludes strips which contributes to D_peak) - Fit tails:
F_tail^left and F_tail^right.
Same definition as for D_tail, but integrals are calculated from a fit function. - Maximum sided residual:
max(D_tail-F_tail)
Maximum of the data minus fit energy on the left and right sides from the peak.
Maximum sided residual: MC vs. data comparison
Figure 1: Maximum sided residual plot
Top get more statistics for MC QCD sample plot is redone with a softer R_cluster > 0.9 cut
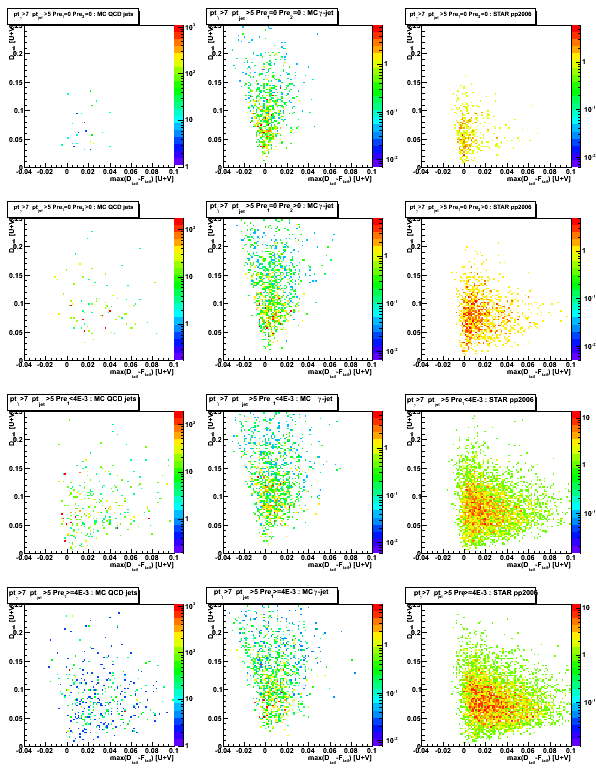
Figure 2: D_peak (projection on vertical axis for Fig. 1)
Upper left plot (no pre-shower fired case) reveals some difference
between MC gamma-jet and pp2006 data at lower D_peak values.
This difference could be due to background contribution at low energies.
Still needs more statistics for MC QCD jet sample to confirm that statement.
Figure 3: max(D_tail-F_tail) (projection on horisontal axis for Fig. 1)
One can get an idea of signal/background separation (red vs. black) depending on pre-shower condition.
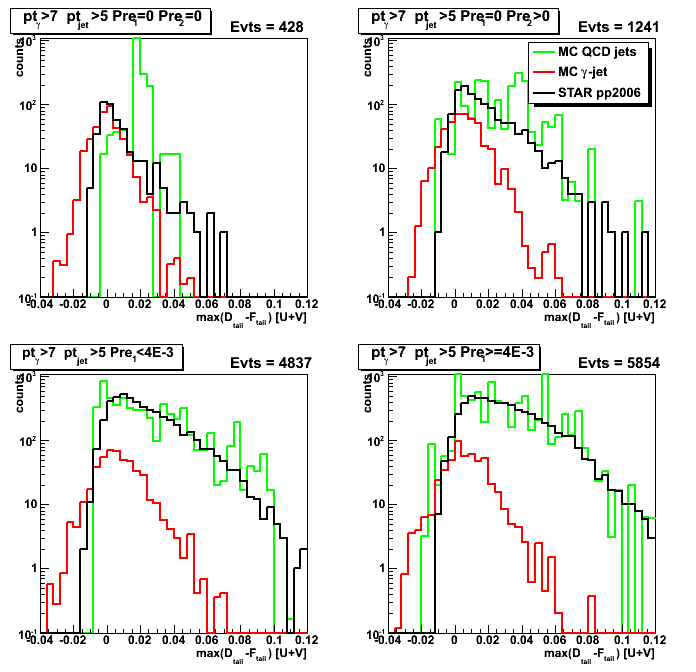
Figure 4: Mean < max(D_tail-F_tail) > vs. D_peak (profile on vertical axis from Fig. 1)
For gamma-jet sample average sided residual is independent on D_peak energy
and has a slight positive shift for all pre-shower>0 conditions.
For large D_peak values (D_peak>0.16) MC gamma-jet and pp2006 data results are getting close to each other.
This corresponds to higher energy gammas, where we have a better signal/background ratio,
and thus more real gammas among gamma-jet candidates from pp2006 data.
(Note: legend's color coding is wrong, colors scheme is the same as in Fig. 3)
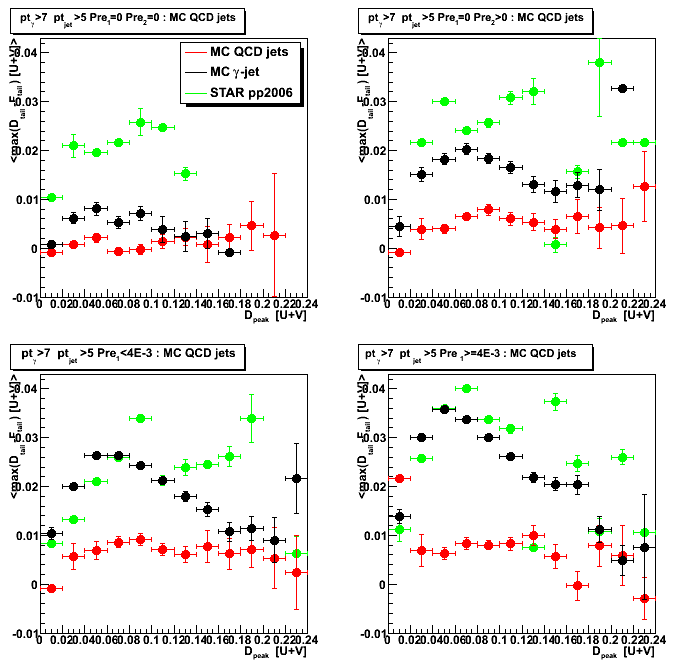
Figure 5: Mean < D_peak > vs. max(D_tail-F_tail) (profile on horisontal axis from Fig. 1)
For "no-preshower fired" case MC gamma-jet sample has a large average values than that from pp2006 data.
This reflects the same difference between pp2006 and MC gamma-jet sample at small D_peak values (see Fig. 2, upper left plot).
(Note: legend's color coding is wrong, colors scheme is the same as in Fig. 3)
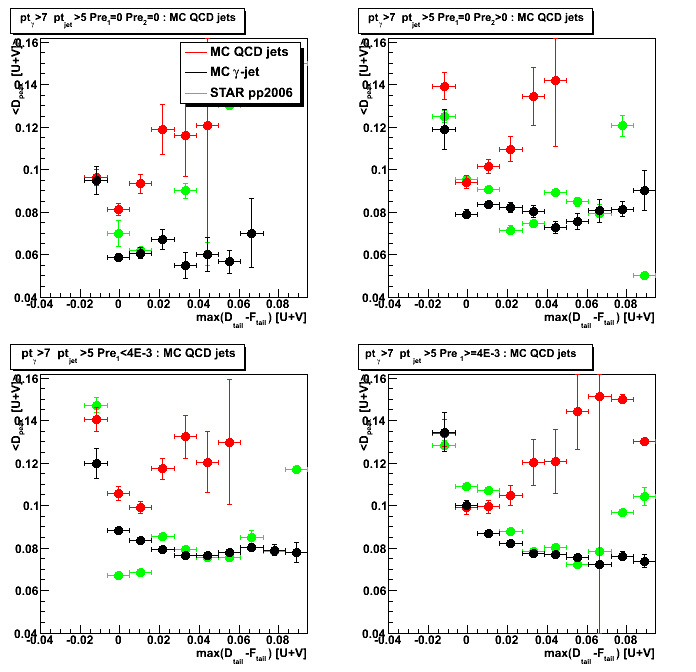
Figure 6: D_peak vs. gamma pt
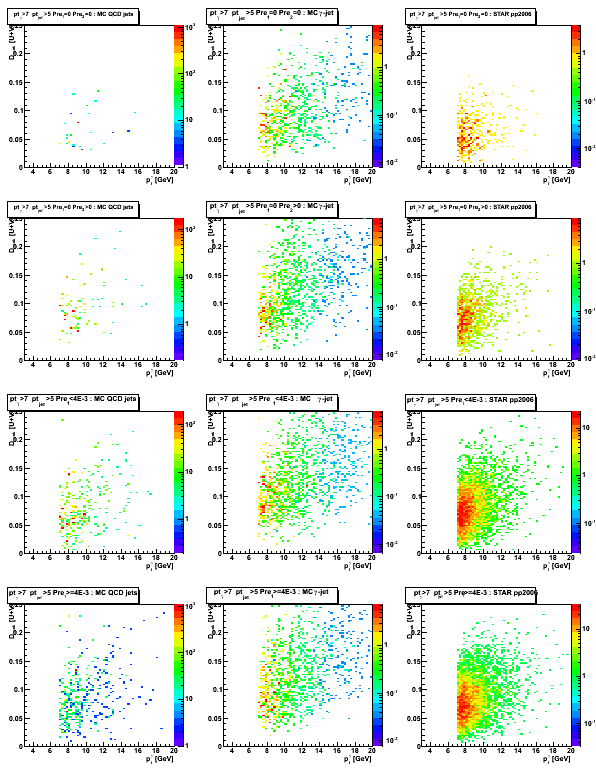
Figure 7: D_peak vs. gamma 3x3 tower cluster energy
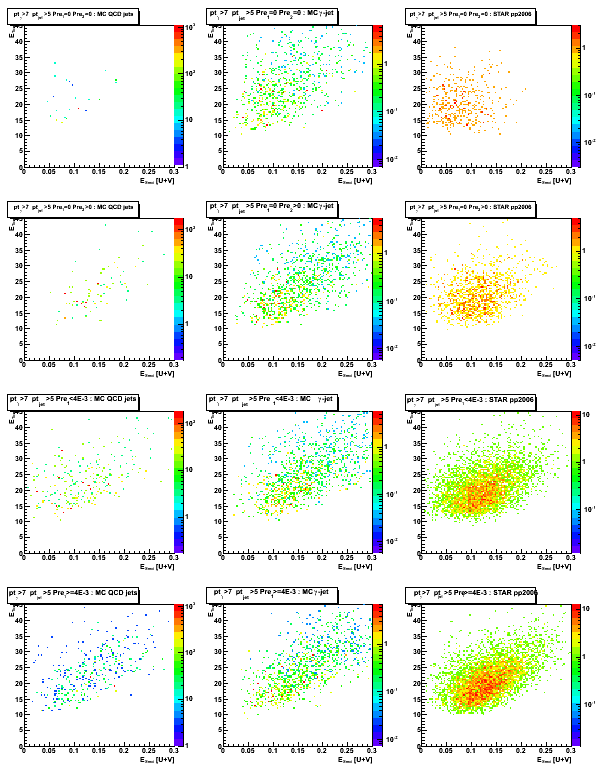
Figure 8: 3x3 cluster tower energy distribution
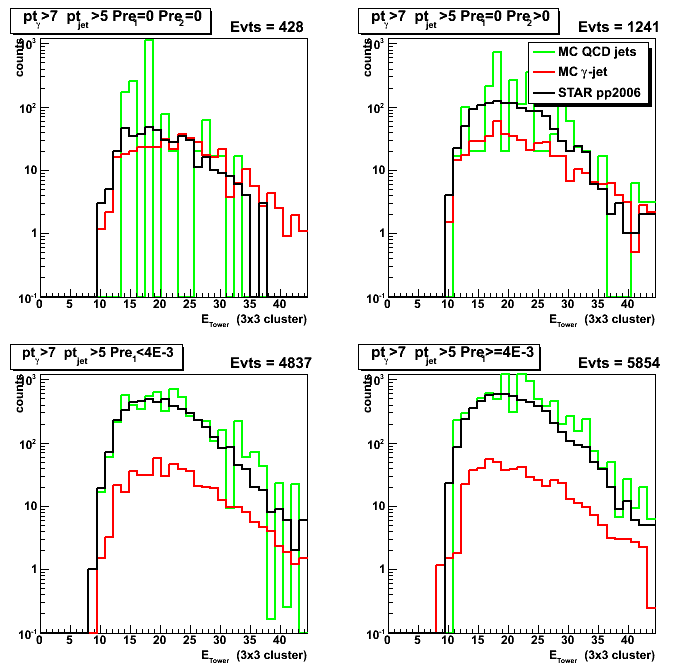
Figure 9: Gamma pt distribution
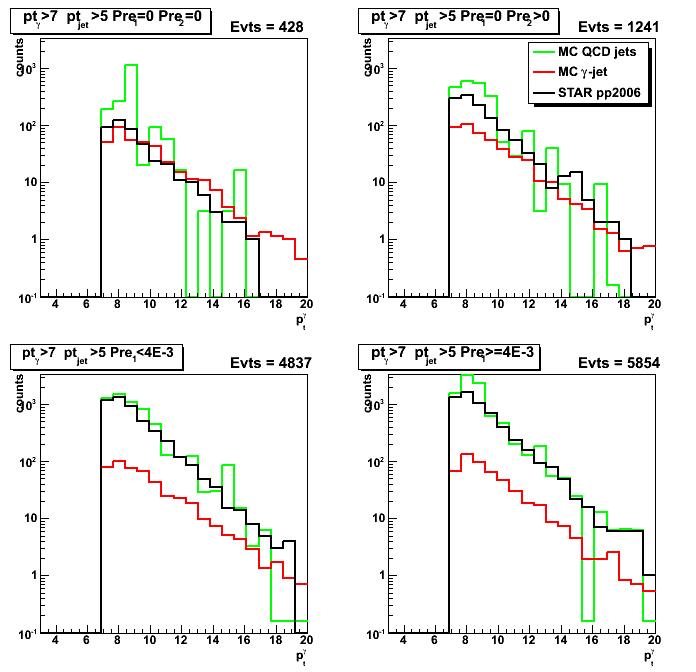
Signal/background separation
The simplest way to get signal/background separation is to draw a straight line
on sided residual plot (Fig. 1) in such a way that
it will contains most of the counts (signal) on the left side,
and use a distance to that line for both MC and pp2006 data samples
as a discriminant for signal/background separation.
To get the distance to the straight line one can rotate sided residual plot
by the angle which corresponds to the slope of this line,
and then project it on "rotated" max(D_tail-F_tail) axis.
Figure 10: Shows "rotated" sided residual plot by "5/6*(pi/2)" angle (this angle has been picked by eye).
One can see that now most of the counts for gamma-jet sample (middle column)
are on the left side from vertical axis.
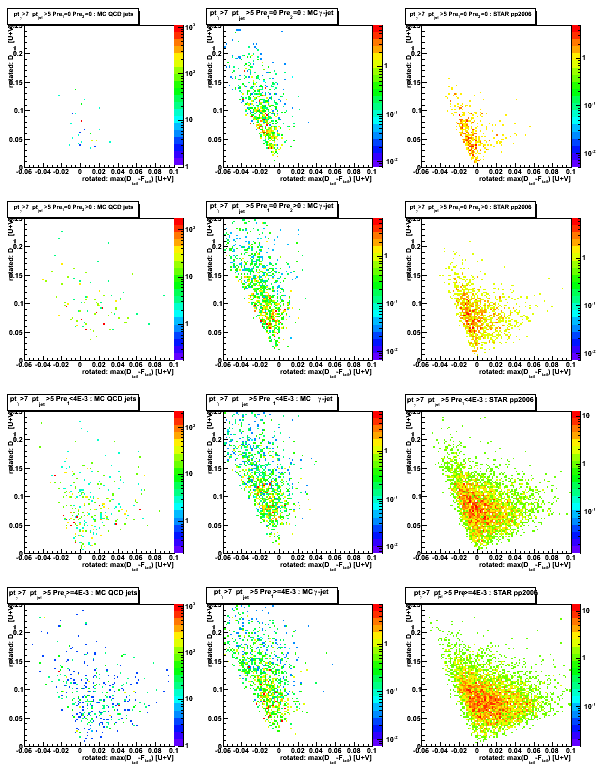
Figure 11: "Rotated" max(D_tail-F_tail) [projection on horizontal axis for Fig. 10]
Cut on "Rotated" max(D_tail-F_tail) can be used for signal/background separation.
From figure below one can see much better signal/background separation than in Fig. 3
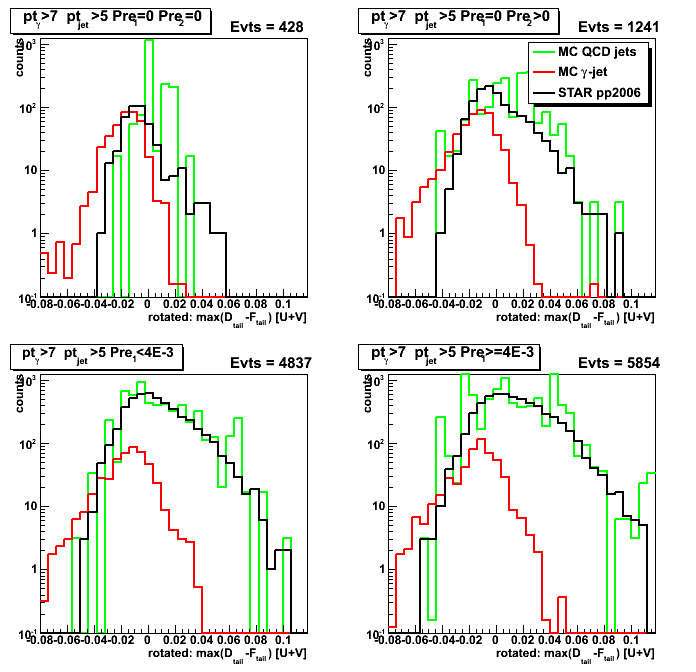
Figure 12: "Rotated" D_peak [projection on vertical axis for Fig. 10]
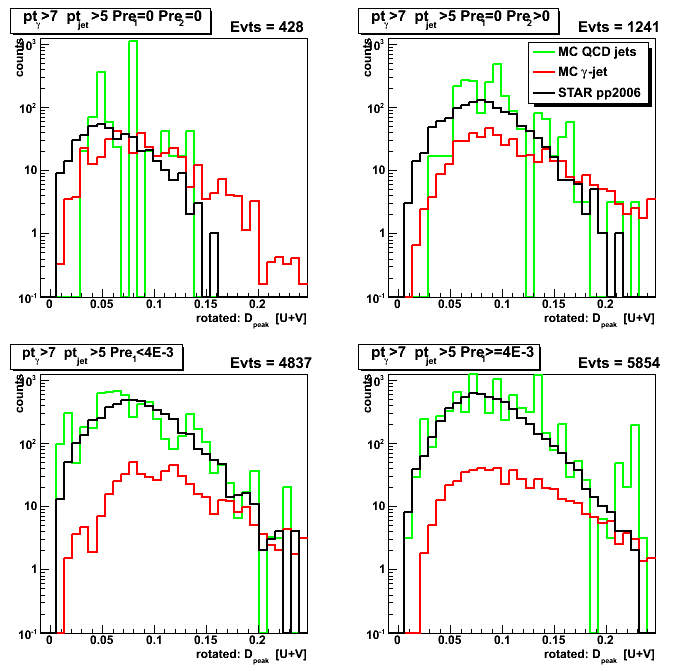
Optimizing the shape of s/bg separation line
Ideally, instead of straight line one needs to use
an actual shape of side residual distribution for MC gamma-jet sample.
This shape can be extracted and parametrized by the following procedure:
- Get slices from sided residual plot for different D_peak values
- From each slice get max(D_tail-F_tail) value
for which most of the counts appears on its left side (for example 80%), - Fit these set of points {D_peak slice, max(D_tail-F_tail)} with a polynomial function
The distance to that polynomial function can be used to determine our signal/background rejection efficiency.
This work is in progress...
Just last one figure showing shapes for 6 slices from sided plot.
Figure 13: max(D_tail-F_tail) for different slices in D_peak (scaled by the integral for each slice)
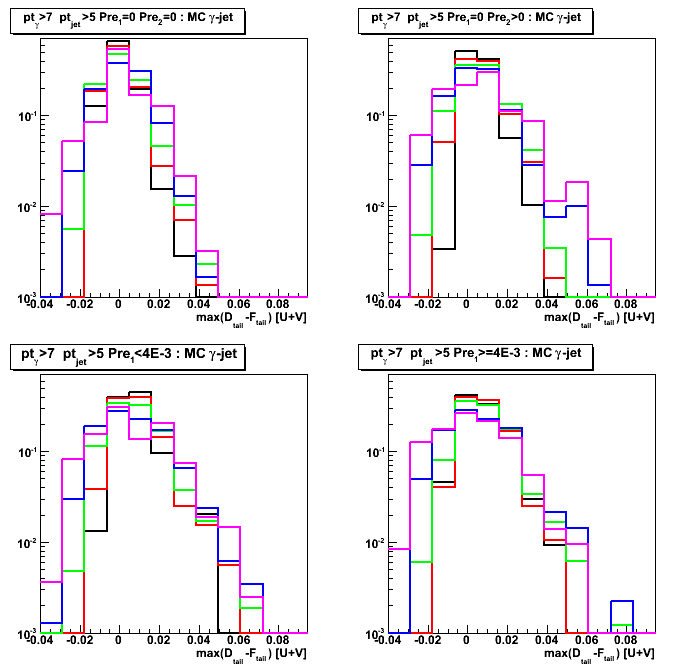
2008.09.30 Sided residual: purity, efficiency, and background rejection
Ilya Selyuzhenkov September 30, 2008
Data sets:
- pp2006 - STAR 2006 pp longitudinal data (~ 3.164 pb^1)
after applying gamma-jet isolation cuts (note: R_cluster > 0.9 is used below). - gamma-jet - data-driven Pythia gamma-jet sample (~170K events). Partonic pt range 5-35 GeV.
- QCD jets - data-driven Pythia QCD jets sample (~4M events). Partonic pt range 3-65 GeV.
Notations used in the plots:
- Fit peak energy:
F_peak - integral within +-2 strips from maximum strip
Maximum strip determined by fitting procedure.
Float value converted ("cutted") to integer value. - Data peak energy:
D_peak - energy sum within +-2 strips from maximum strip (the same strip Id as for F_peak). - Data tails:
D_tail^left and D_tail^right.
Energy sum from 3rd strip up to 30 strips on the
left and right sides from maximum strip (excludes strips which contributes to D_peak) - Fit tails:
F_tail^left and F_tail^right.
Same definition as for D_tail, but integrals are calculated from a fit function. - Maximum sided residual:
max(D_tail-F_tail)
Maximum of the data minus fit energy on the left and right sides from the peak.
Determining cut line based on sided residual plot
Figure 1: Sided residual plot: D_peak vs. max(D_tail-F_tail)
Red lines show 4th order polynomial functions, a*x^4,
which have 80% of MC gamma-jet counts on the left side.
These lines are obtained independently for each of pre-shower condition
based on fit procedure shown in Fig. 3 below.
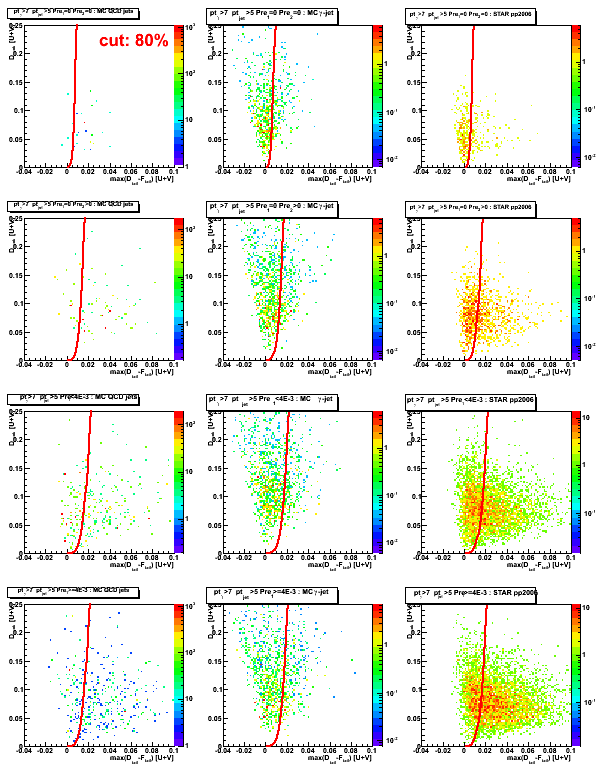
Figure 2: max(D_tail-F_tail) distribution
(projection on horizontal axis from sided residual plot, see Fig. 1 above)
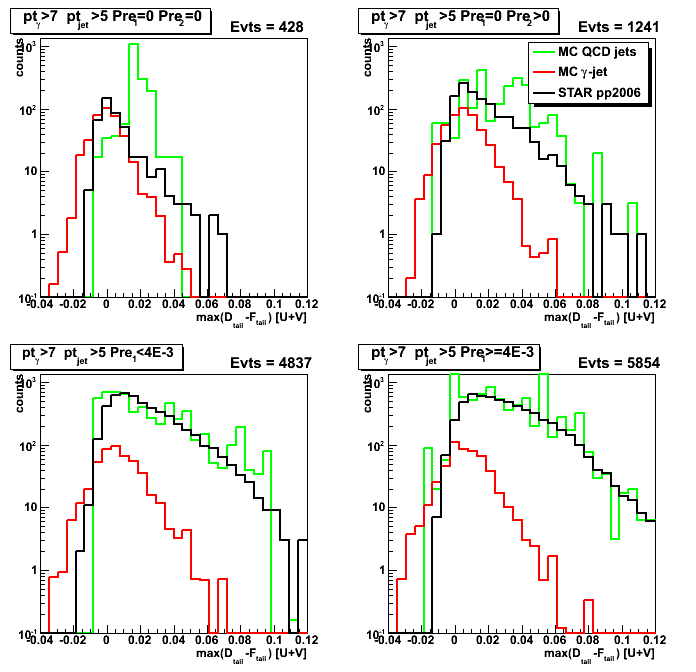
Figure 3: max(D_tail-F_tail) [at 80%] vs. D_peak.
For each slice (bin) in D_peak variable, the max(D_tail-F_tail) value
which has 80% of gamma-jet candidates on the left side are plotted.
Lines represent fits to MC gamma-jet points (shown in red) using different fit functions
(linear, 2nd, 4th order polynomials: see legend for color coding).
Note, that in this plot D_peak values are shown on horizontal axis.
Consequently, to get 2nd order polynomial fit on sided residual plot (Fig. 1),
one needs to use sqrt(D_peak) function.
The same apply to 4th order polynomial function.
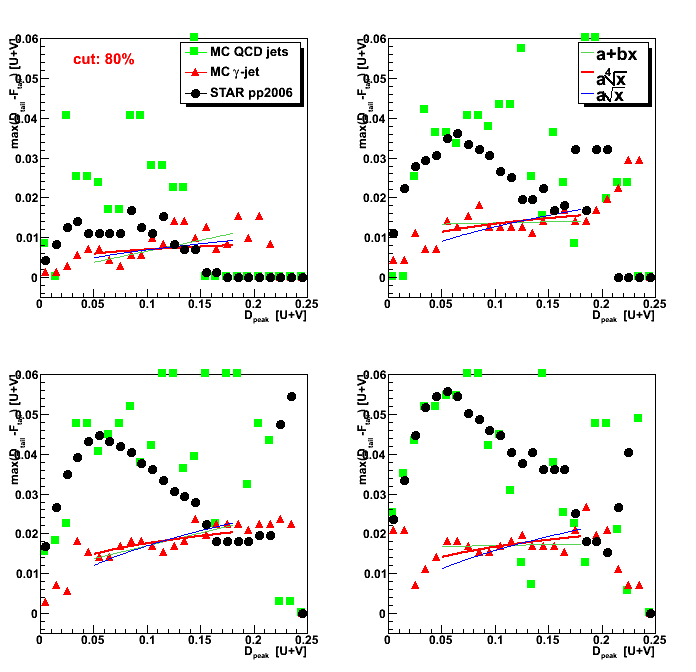
Figure 4: D_peak vs. horisontal distance from 4th order polinomial function to max(D_tail-F_tail) values.
(compare with Fig. 1: Now 80% of MC gamma-jet counts are on the left side from vertical axis)
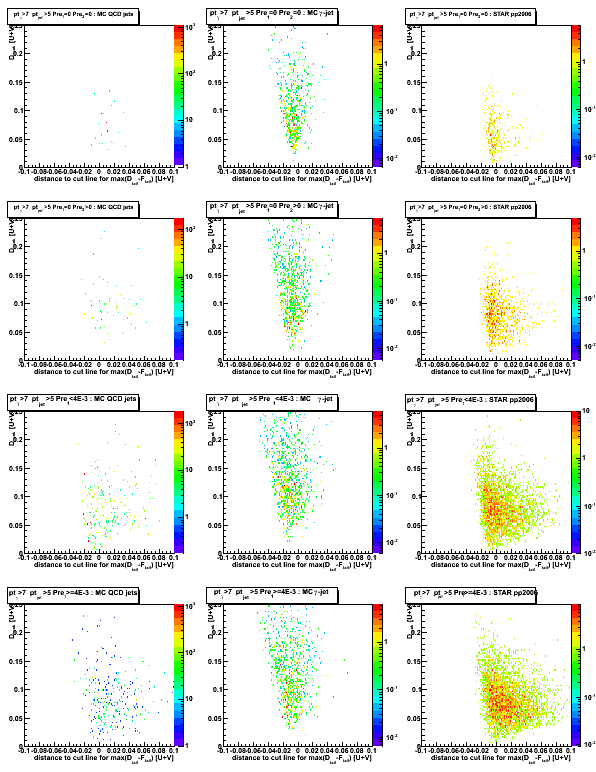
Figure 5: Horizontal distance from 4th order polynomial function to max(D_tail-F_tail)
[Projection on horizontal axis from Fig. 4]
Based on this plot one can obtain purity, efficiency, and rejection plots (see Fig. 6 below)
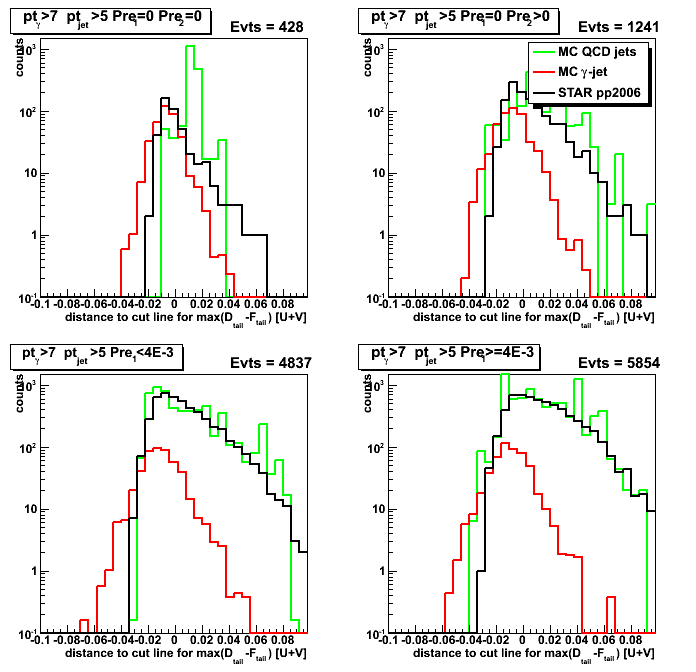
Gamma-jet purity, efficiency, and QCD background rejection
Horizontal distance plotted in Fig. 5 can be used as a cut
separating gamma-jet signal and QCD-jets background,
and for each value of this distance one can define
gamma-jet purity, efficiency, and QCD-background rejection:
-
gamma-jet purity is defined as the ratio of
the integral on the left for MC gamma-jet data sample, N[g-jet]_left,
to the sum of the integrals on the left for MC gamma-jet and QCD jets, N[QCD]_left, data samples:
Purity[gamma-jet] = N[g-jet]_left/(N[g-jet]_left+N[QCD]_left) -
gamma-jet efficiency is defined as the ratio of
the integral on the left side for MC gamma-jet data sample, N[g-jet]_left,
to the total integral for MC gamma-jet data sample, N[g-jet]:
Efficiency[gamma-jet] = N[g-jet]_left/N[g-jet] -
QCD background rejection is defined as the ratio of
the integral on the right side for MC QCD jets data sample, N[QCD]_right,
to the total integral for MC QCD jets data sample, N[QCD]:
Rejection[QCD] = N[QCD]_right/N[QCD]
Figure 6: Shows:
purity[g-jet] vs. efficiency[g-jet] (upper left);
rejection[QCD] vs. efficiency[g-jet] (upper right);
purity[g-jet] vs. rejection[QCD] (lower left);
pp2006 to MC ratio, N[pp2006]/(N[g-jet]+N[QCD]), vs. horizontal distance from Fig. 5 (lower right)
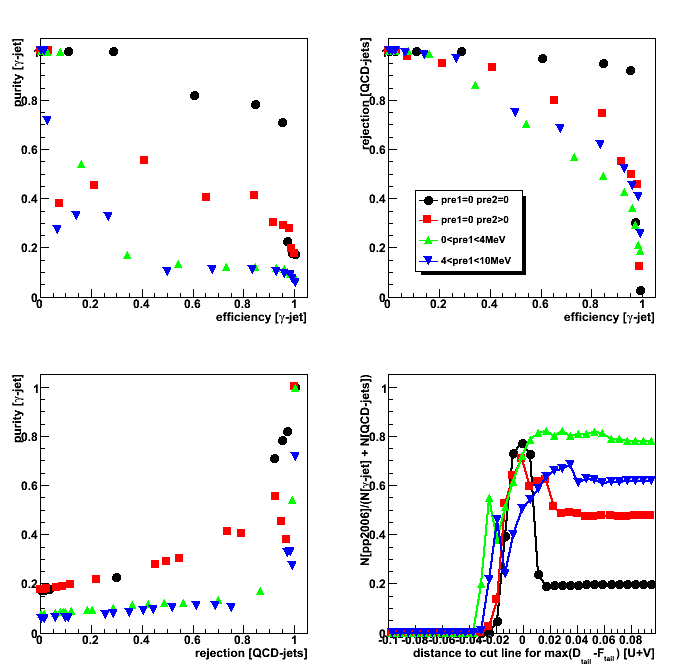
10 Oct
October 2008 posts
2008.10.13 Jet trees for Michael's gamma filtered events
Ilya Selyuzhenkov October 13, 2008
I have finished production of jet trees for Michael's gamma filtered events
You can find jet and skim file lists in my directory at IUCF disk (RCF):
- Jet trees: /star/institutions/iucf/IlyaSelyuzhenkov/simu/JetTrees/JetTrees.list
- Skim trees: /star/institutions/iucf/IlyaSelyuzhenkov/simu/JetTrees/SkimTrees.list
- Log files: /star/institutions/iucf/IlyaSelyuzhenkov/simu/JetTrees/LogFiles.list
Number of jet events is 1284581 (1020 files).
Production size, including archived log files, is 4.0G.
The script to run jet finder:
/star/institutions/iucf/IlyaSelyuzhenkov/simu/JetTrees/20081008_gJet/StRoot/macros/RunJetSimuSkimFinder.C
JetFinder and JetMaker code:
/star/institutions/iucf/IlyaSelyuzhenkov/simu/JetTrees/20081008_gJet/StRoot/StJetFinder
/star/institutions/iucf/IlyaSelyuzhenkov/simu/JetTrees/20081008_gJet/StRoot/StJetMaker
For more details see these threads of discussions:
- jetfinding list: thread 814
- photon reconstruction list: thread 271 and thread 256
2008.10.14 Purity, efficiency, and background rejection: R_cluster > 0.98
Ilya Selyuzhenkov October 14, 2008
Data sets:
- pp2006 - STAR 2006 pp longitudinal data (~ 3.164 pb^1)
after applying gamma-jet isolation cuts (note: R_cluster > 0.98 is used below). - gamma-jet - data-driven Pythia gamma-jet sample (~170K events). Partonic pt range 5-35 GeV.
- QCD jets - data-driven Pythia QCD jets sample (~4M events). Partonic pt range 3-65 GeV.
Figure 1: Horizontal distance from 4th order polynomial function to max(D_tail-F_tail)
See this page for definition and more details
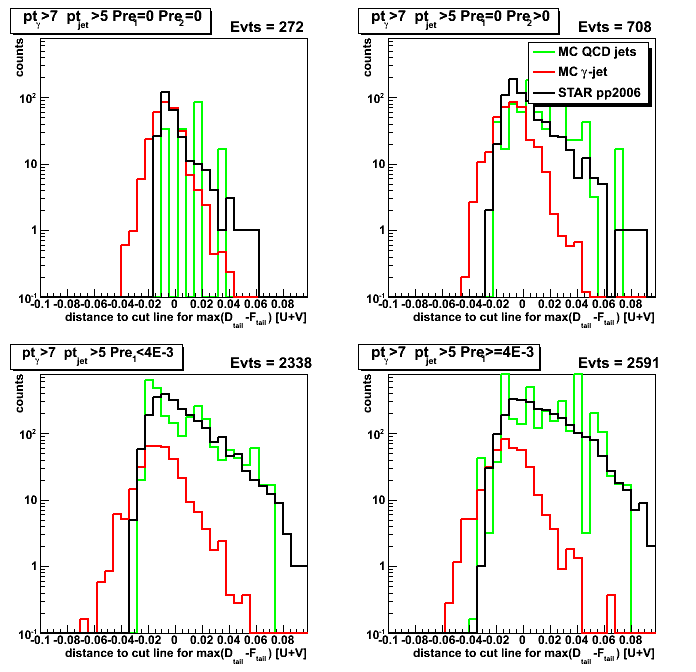
Figure 2:
purity[g-jet] vs. efficiency[g-jet] (upper left);
rejection[QCD] vs. efficiency[g-jet] (upper right);
purity[g-jet] vs. rejection[QCD] (lower left);
pp2006 to MC ratio, N[pp2006]/(N[g-jet]+N[QCD]), vs. horizontal distance (lower right)
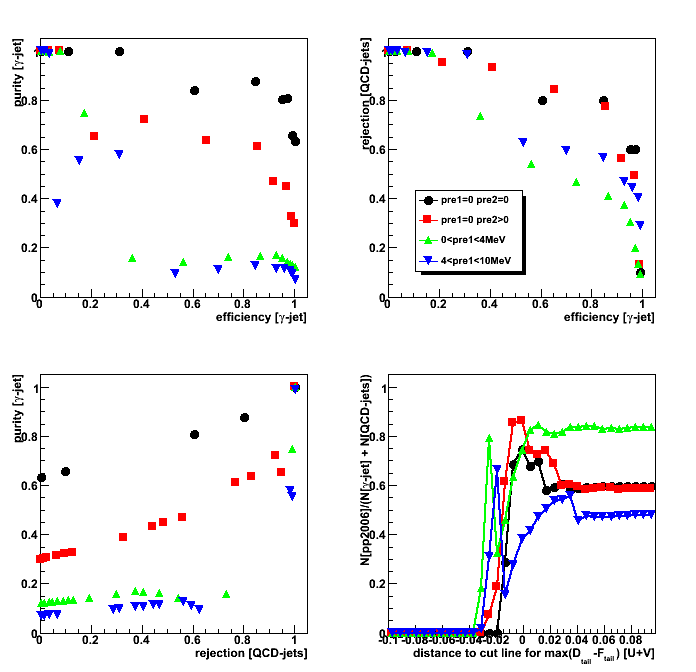
2008.10.15 Comparison of gamma-jets from Michael's filtered events vs. old MC samples
Ilya Selyuzhenkov October 15, 2008
Data sets:
- pp2006 - STAR 2006 pp longitudinal data (~ 3.164 pb^1)
after applying gamma-jet isolation cuts (note: R_cluster > 0.9 is used below). - gamma-jet[gamma-filtered] - data-driven Prompt Photon [p6410EemcGammaFilter] events.
Partonic pt range 2-25 GeV. - QCD jets[gamma-filtered] - data-driven QCD [p6410EemcGammaFilter] events.
Partonic pt range 2-25 GeV. - gamma-jet [old] - data-driven Pythia gamma-jet sample (~170K events).
Partonic pt range 5-35 GeV.
Details on jet trees production for Michael's gamma filtered events can be found here. - QCD jets [old] - data-driven Pythia QCD jets sample (~4M events).
Partonic pt range 3-65 GeV.
Some observations:
- Both Fig. 1a vs. Fig. 1b shows good statistics for old and new (gamma-filtered) MC gamma-jet samples
- Fig. 1c shows poor statistics for QCD background sample
within partonic pt range 5-10GeV (only 3 counts for "pre1=0 & pre2=0" condition).
Fig. 1d (new QCD sample) has much more counts in the same region,
but it is still only 20-25 entries for the case when
none of EEMC pre-shower layers fired (upper left corner - our purest gamma-jet sample).
This may be still insufficient for a various cuts systematic study. - Fig. 2 and Fig. 3 shows nice agreement between data and MC
for both old and new (gamma-filtered) MC samples.
For pre-shower1>0 case this agreement persists across full range of gamma's pt (7GeV and above).
Upper plots in Fig. 3 shows some difference between data and Monte-Carlo,
what could be effect from l2gamma trigger,
which has not been yet applied for MC events.
Figure 1a: partonic pt for gamma-jet [old] events
after analysis cuts and partonic pt bin weighting
(Note:Arbitrary absolute scale)
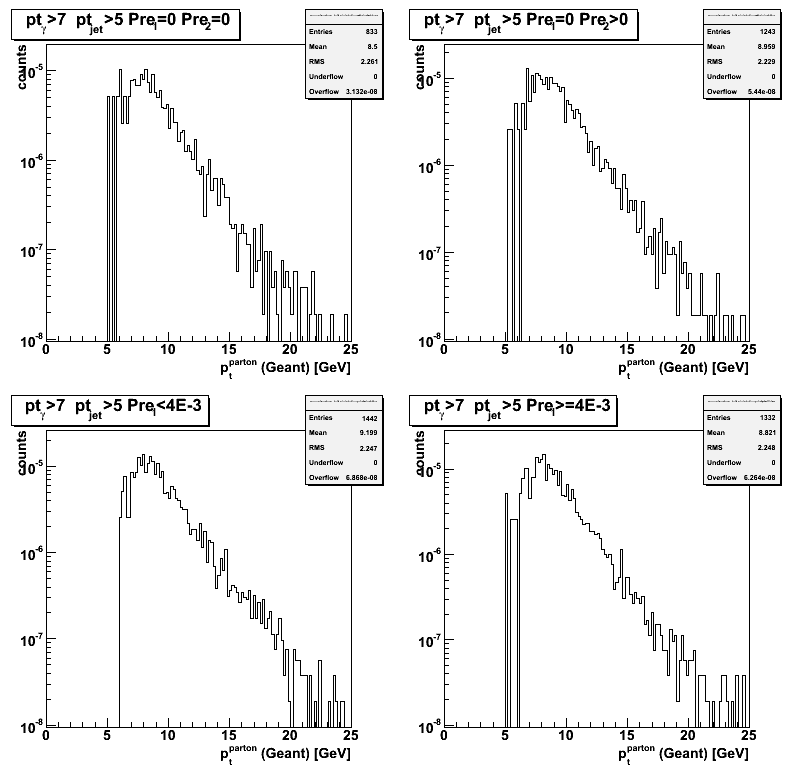
Figure 1b: partonic pt for gamma-jet [gamma-filtered] events after analysis cuts.
Michael's StBetaWeightCalculator has been used to caclulate partonic pt weights
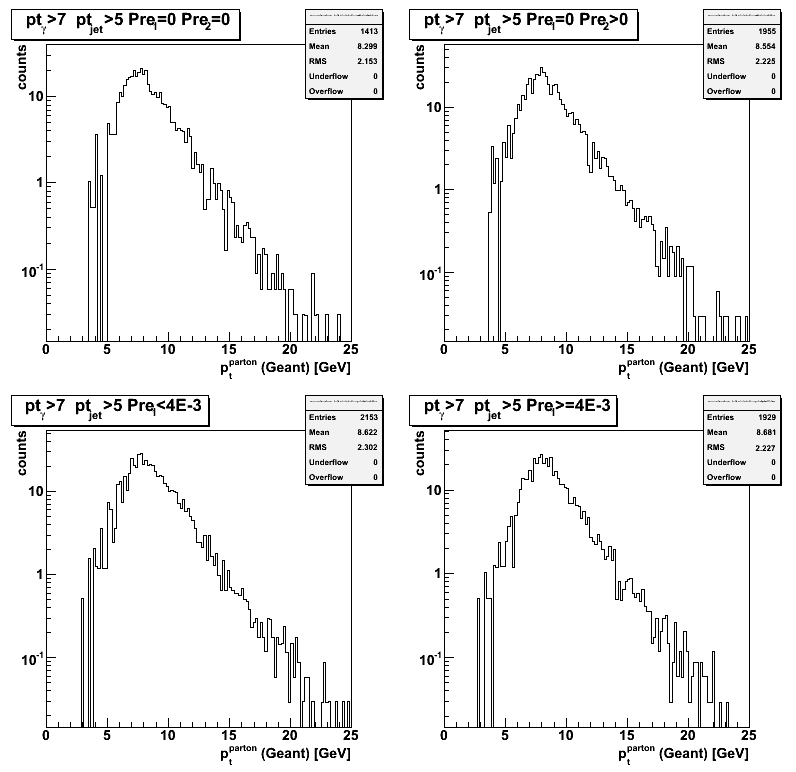
Figure 1c: partonic pt for QCD jets [old] events
after analysis cuts and partonic pt bin weighting
(Note:Arbitrary absolute scale)
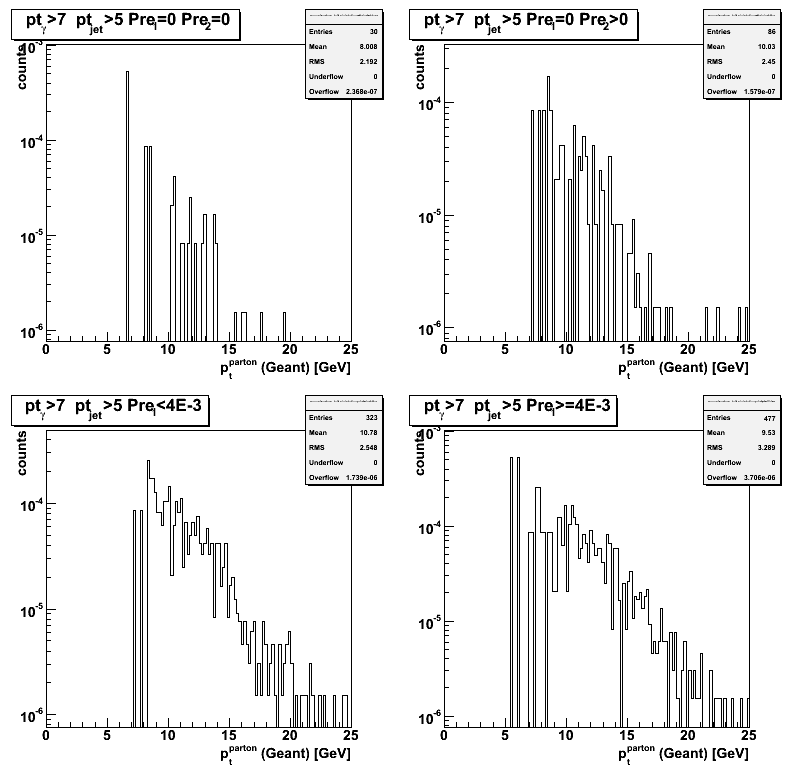
Figure 1d: partonic pt for QCD jets [gamma-filtered] events after analysis cuts.
Michael's StBetaWeightCalculator has been used to caclulate partonic pt weights
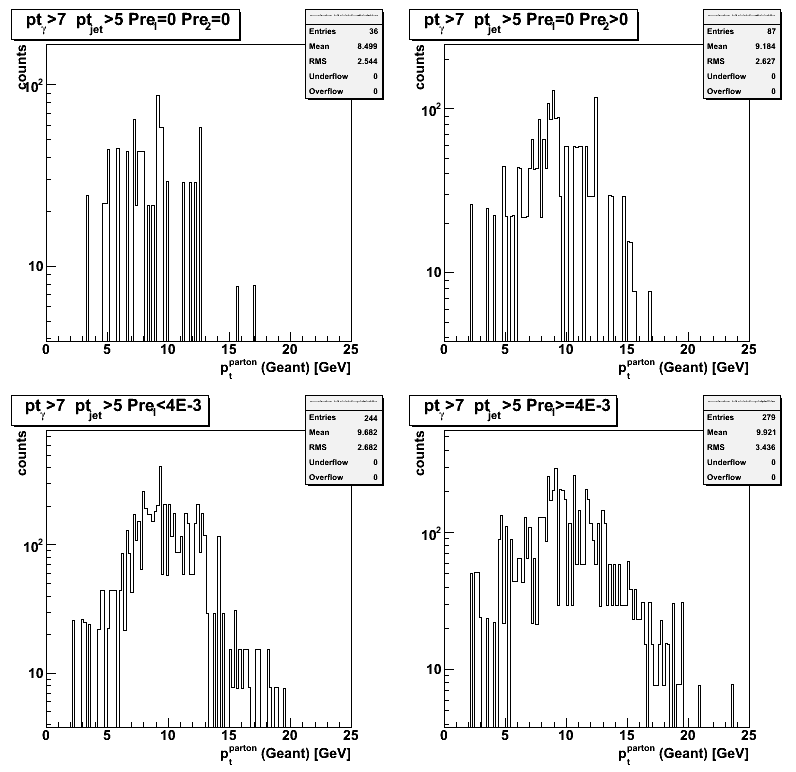
Figure 2: reconstructed gamma pt: old MC vs. pp2006 data (scaled to the same luminosity)

Figure 3: reconstructed gamma pt: gamma-filtered MC vs. pp2006 data (scaled to the same luminosity)
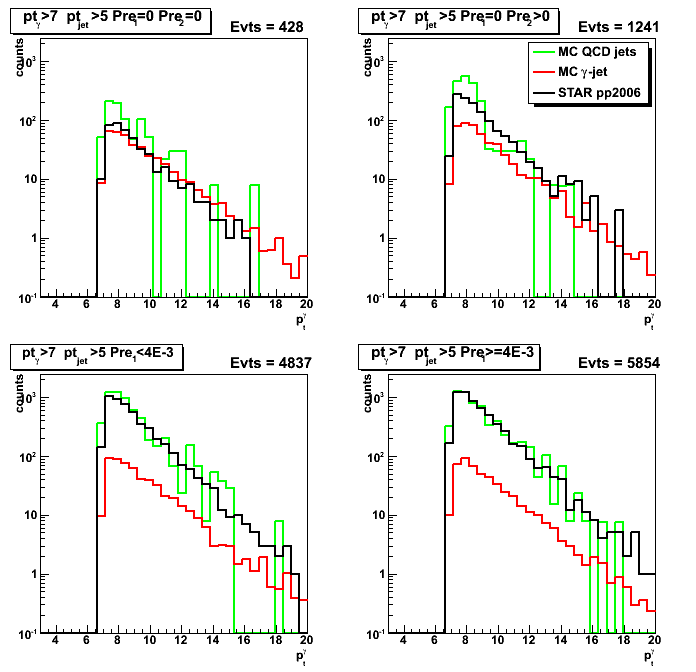
2008.10.15 Purity vs. efficiency from gamma-filtered events: R_cluster > 0.9 vs. R_cluster > 0.98
Ilya Selyuzhenkov October 15, 2008
Data sets:
- pp2006 - STAR 2006 pp longitudinal data (~ 3.164 pb^1)
after applying gamma-jet isolation cuts (note: R_cluster > 0.9 or > 0.98 is used below). - gamma-jet[gamma-filtered] - data-driven Prompt Photon [p6410EemcGammaFilter] events.
Partonic pt range 2-25 GeV. - QCD jets[gamma-filtered] - data-driven QCD [p6410EemcGammaFilter] events.
Partonic pt range 2-25 GeV.
Gamma-jet candidates from MC gamma filtered events: R_cluster > 0.9
Figure 1: Horizontal distance from sided residual plot: R_cluster > 0.9
(see Figs. 1-5 from this post for horizontal distance definition)
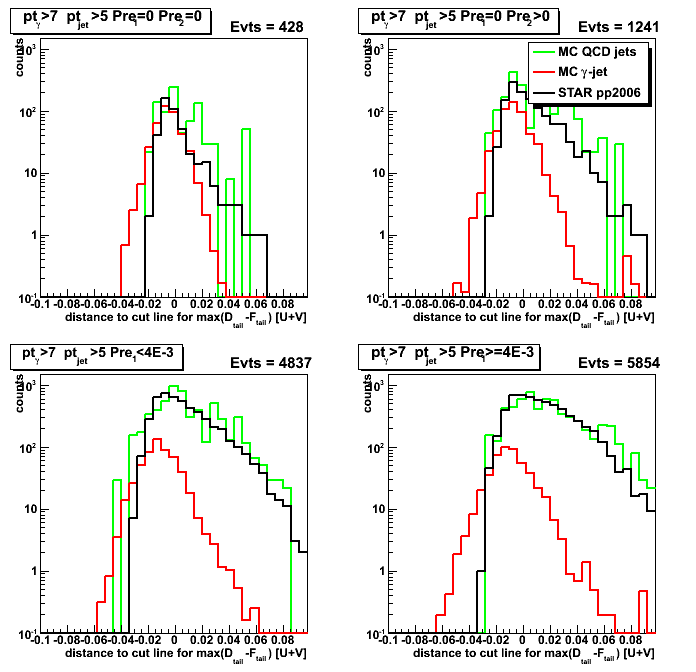
Figure 2: Purity/efficiency/rejection, and data to MC[gamma-jet+QCD] ratio plots: R_cluster > 0.9
(see text above Fig. 6 from this post for purity, efficiency, and background rejection definition)
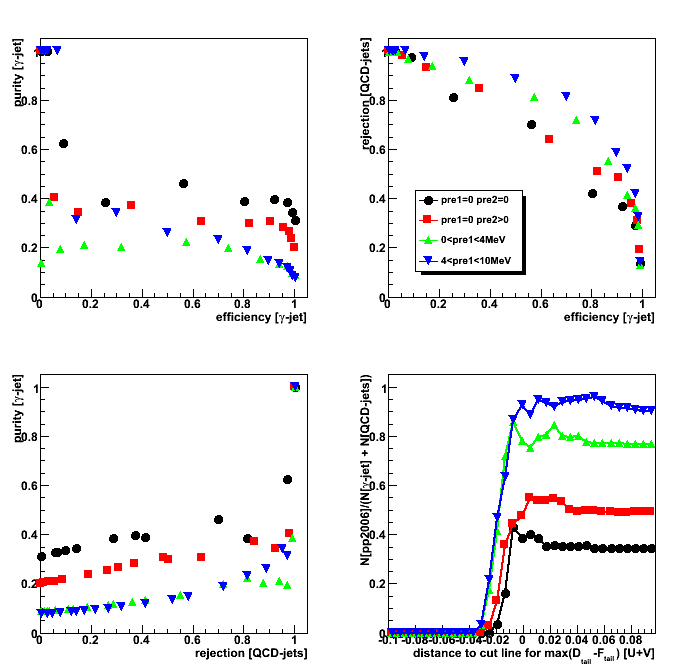
Gamma-jet candidates from MC gamma filtered events: R_cluster > 0.98
Figure 3: Reconstructed gamma pt: R_cluster > 0.98
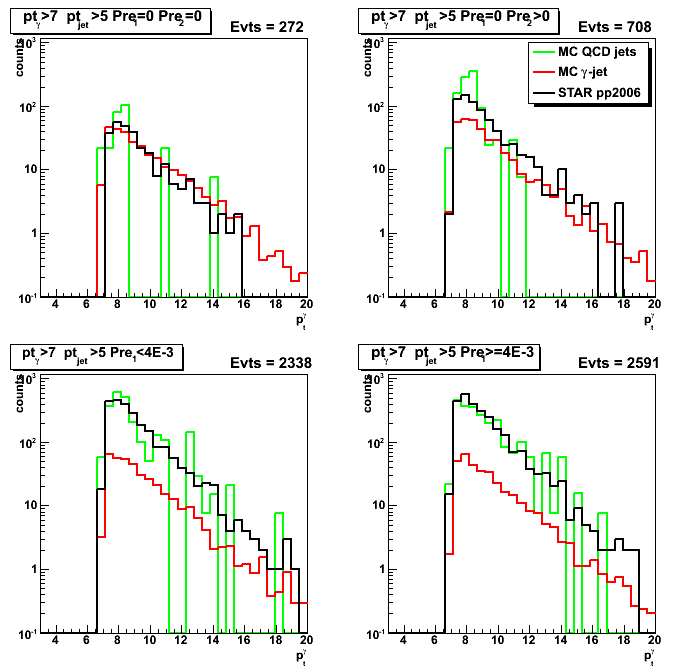
Figure 4: Horizontal distance from sided residual plot: R_cluster > 0.98
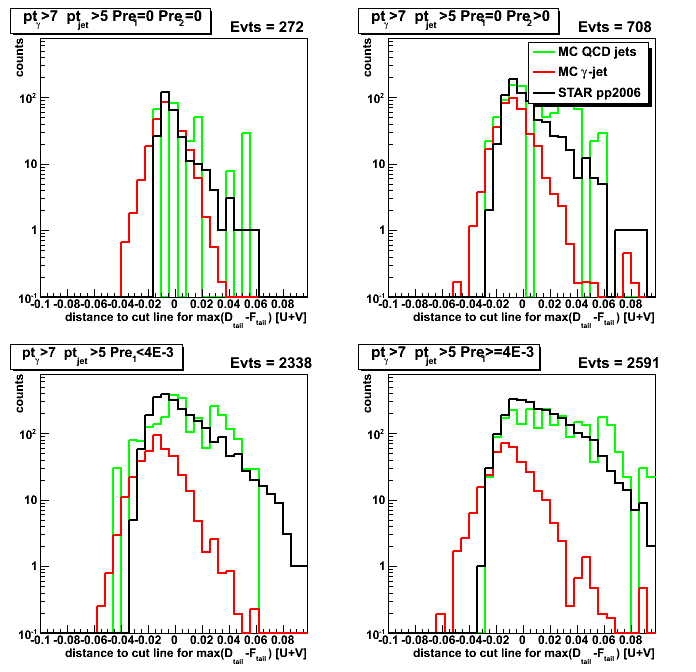
Figure 5: Purity/efficiency/rejection, and data to MC[gamma-jet+QCD] ratio plots: R_cluster > 0.98
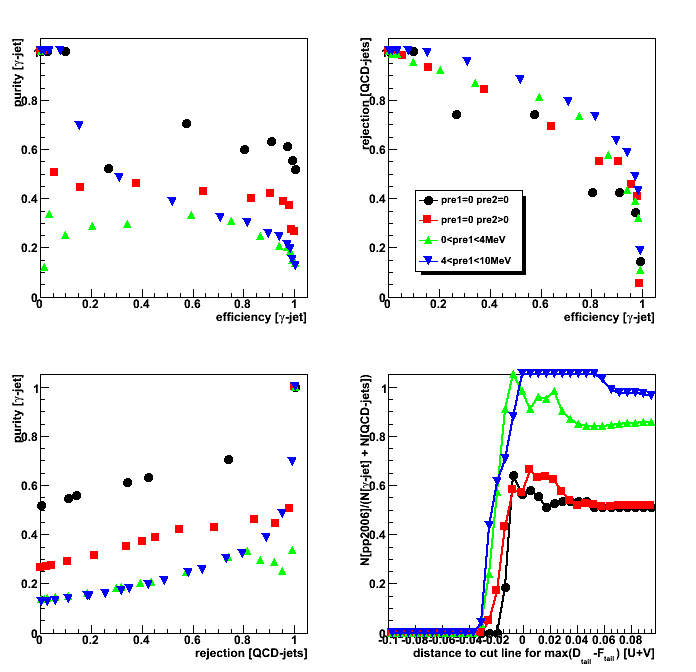
2008.10.21 Shower shapes, 5/25 strips cluster energy, raw vs. data-driven MC
Ilya Selyuzhenkov October 21, 2008
Data sets:
- pp2006 - STAR 2006 pp longitudinal data (~ 3.164 pb^1)
after applying gamma-jet isolation cuts (R_cluster > 0.9 is used below). - gamma-jet[gamma-filtered] - data-driven Prompt Photon [p6410EemcGammaFilter] events.
Partonic pt range 2-25 GeV. - QCD jets[gamma-filtered] - data-driven QCD [p6410EemcGammaFilter] events.
Partonic pt range 2-25 GeV.
Some comments:
- Overall comment: effect of data-driven shower shape replacement procedure
on QCD background events is small, except probably pre1=0 pre2=0 case. -
Fig. 1-3, upper left plots (pre1=0 pre2=0) show that
average energy per strip in data-driven gamma-jet MC (i.e. solid red square in Fig. 3)
is systematically higher than that for pp2006 data (black circles in Fig. 3).Note, that there is an agreement between SMD shower shapes
for pp2006 data and data-driven gamma-jet simulations
if one scales them to the same peak value
(Compare red vs. black in upper left plot from Fig. 1 at this link) -
Fig. 4, upper left plot (pre1=0 pre2=0):
Integrated SMD energy from 25 strips
in raw gamma-jet simulations (red line) match pp2006 data (black line)
in the region where signal to background ratio is high, E_smd(25-strips)>0.1GeV.
This indicates that raw MC does a good job in
reproducing total energy deposited by direct photon. -
Fig. 5, upper left plot (pre1=0 pre2=0):
There is mismatch between distributions of energy in 25 strips cluster
from data-driven gamma-jet simulations and pp2006 data.
This probably reflects the way we scale our library shower shapes
in data-driven shower shape replacement procedure.
Currently, the scaling factor for the library shape is calculated based on the ratio
of direct photon energy from Geant record to the energy of the library photon.
Our library is build out of photons from eta-meson decay,
which has been reconstructed by running pi0 finder.
The purity of the library is about 70% (see Fig. 1 at this post for more details).The improvement of scaling procedure could be to
preserve total SMD energy deposited within 25 strips from raw MC,
and use that energy to scale shower shapes from the library. -
Fig. 6, upper left plot (pre1=0 pre2=0):
Mismatch between integrated 5-strip energy for raw MC and pp2006 in Fig. 6
corresponds to "known" difference in shower shapes from raw Monte-Carlo and real data.
Figure 1: SMD shower shapes: data, raw, and data-driven MC (40 strips).
Vertical axis shows average energy per strip (no overall shower shapes scaling)
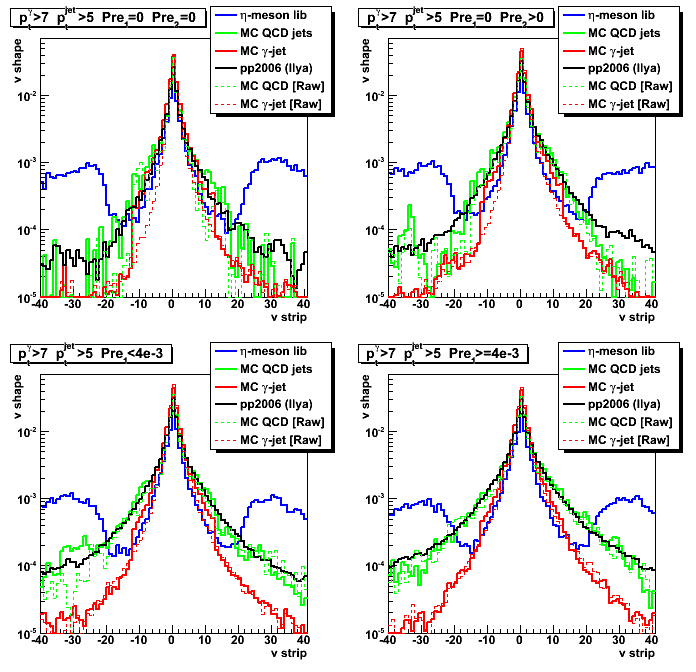
Figure 2: Shower shapes: data, raw, and data-driven MC (12 strips)
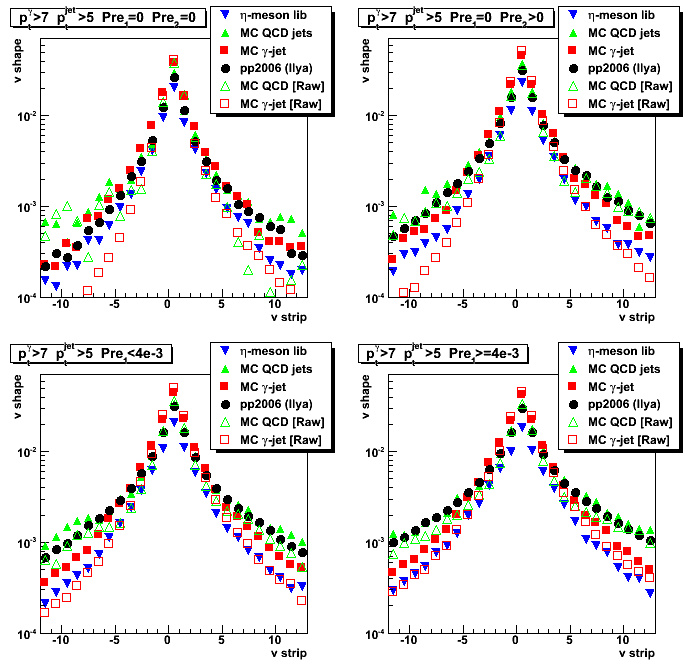
Figure 3: Shower shapes: data, raw, and data-driven MC (5 strips)
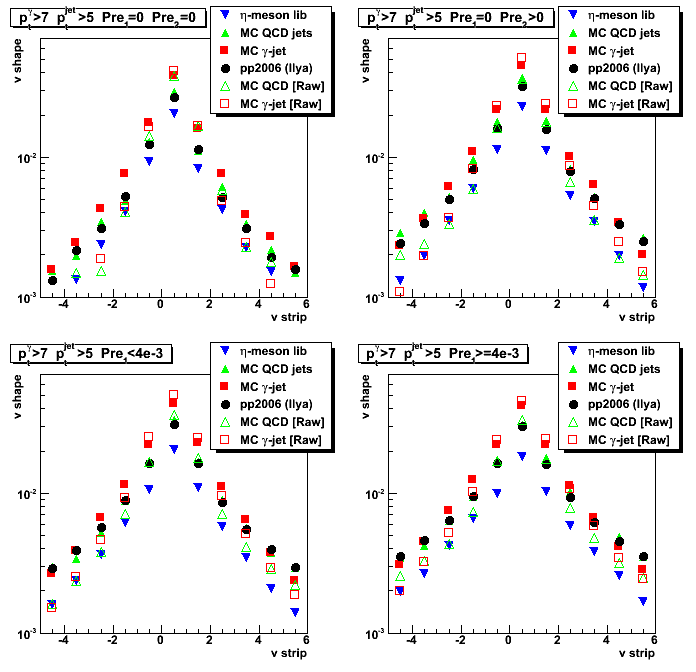
Figure 4: 25 strips SMD cluster energy for raw Monte-Carlo
(Note: type in x-axis lables, should be "25 strip peak" instead of 5)
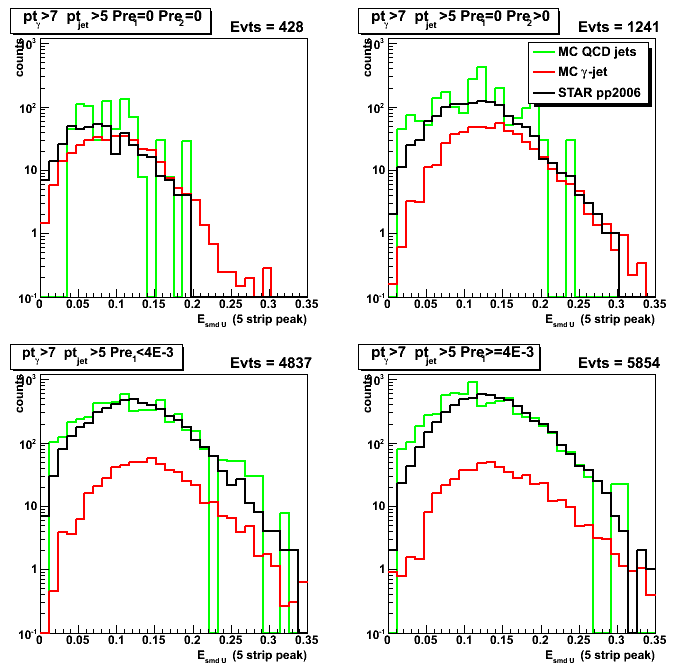
Figure 5: 25 strips SMD cluster energy for data-driven Monte-Carlo
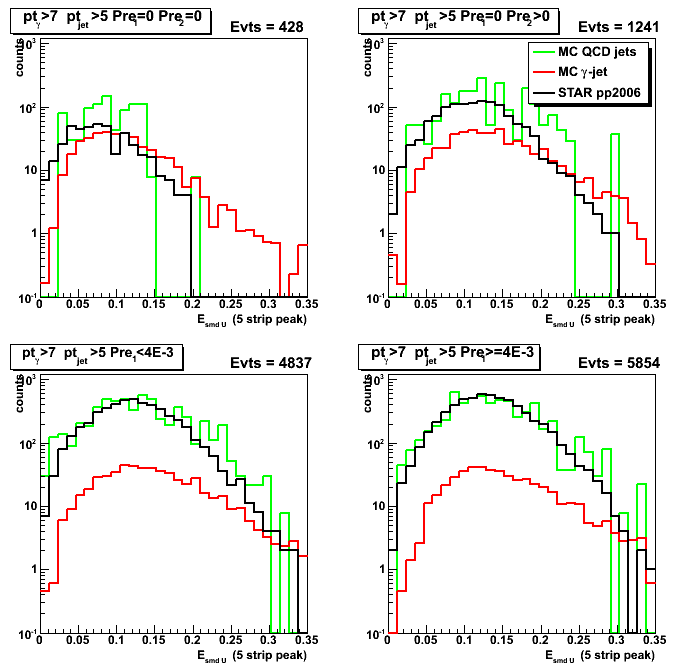
Figure 6: 5 strips SMD peak energy for raw Monte-Carlo
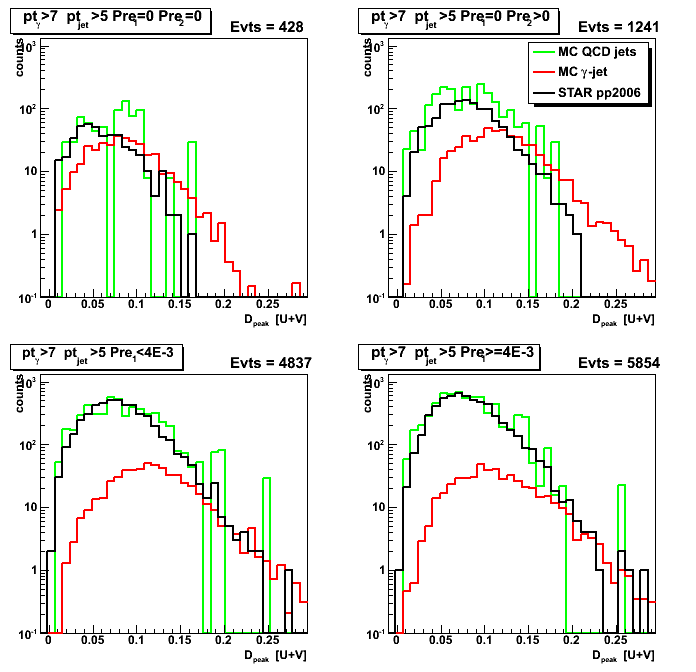
Figure 7: 5 strips SMD peak energy for data-driven Monte-Carlo
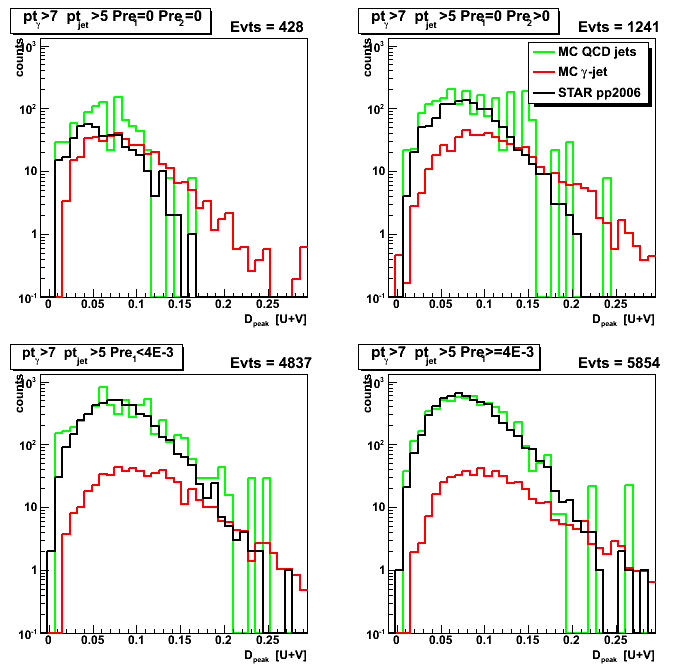
Figure 8:Energy from the right tail (up to 30 strips) for raw Monte-Carlo
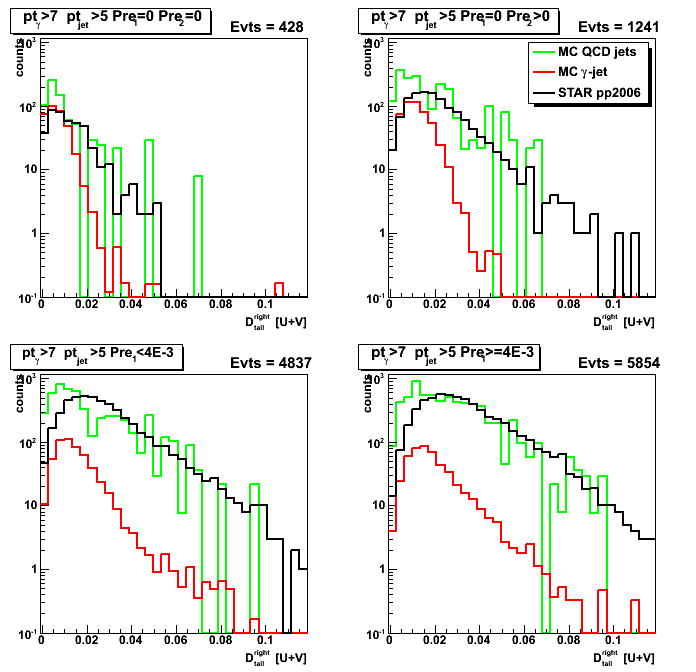
Figure 9:Energy from the right tail (up to 30 strips) for data-driven Monte-Carlo
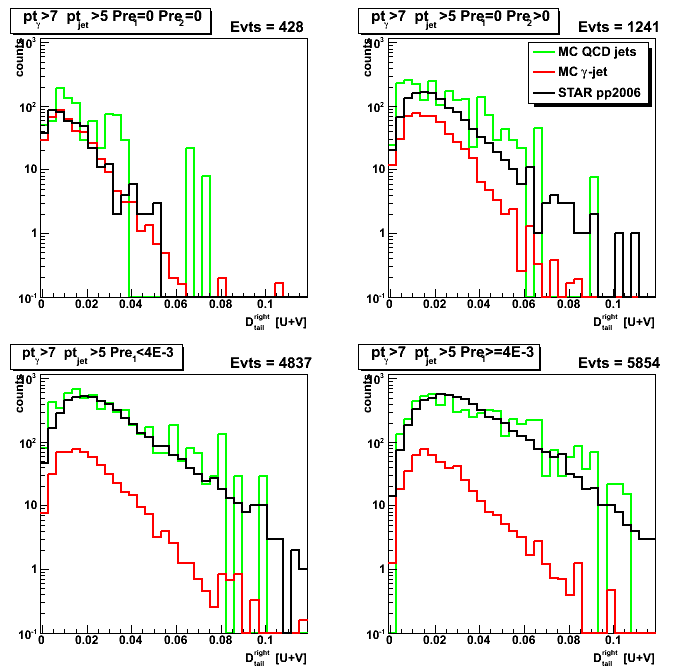
2008.10.27 SMD-based shower shape scaling: 25 strips cluster energy, raw vs. data-driven MC
Ilya Selyuzhenkov October 27, 2008
Data sets:
- pp2006 - STAR 2006 pp longitudinal data (~ 3.164 pb^1)
after applying gamma-jet isolation cuts (R_cluster > 0.9 is used below). - gamma-jet[gamma-filtered] - data-driven Prompt Photon [p6410EemcGammaFilter] events.
Partonic pt range 2-25 GeV. - QCD jets[gamma-filtered] - data-driven QCD [p6410EemcGammaFilter] events.
Partonic pt range 2-25 GeV.
Shower shapes scaling options in data-driven maker:
- scale = E_smd^geant / E_smd^library (default)
E_smd^geant is SMD energy associated with given photon
integrated over +/- 12 strips from raw Monte-Carlo,
and E_smd^library is SMD energy from +/- 12 strips for the library photon. - scale = E_Geant / E_library (used before in all posts)
E_Geant is thrown photon energy from Geant record,
and E_library is stand for energy of the library photon.
In all figures below (exept for pp2006 data and raw Monte-Carlo)
the SMD based shower shape scaling has been used.
Figure 1: SMD shower shapes: data, raw, and data-driven MC (40 strips).
Vertical axis shows average energy per strip (no overall shower shapes scaling)
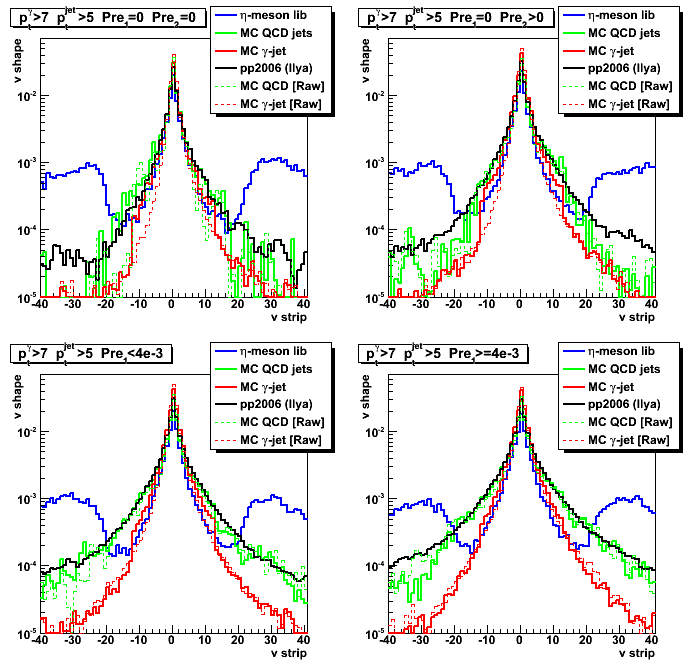
Figure 2: Shower shapes: data, raw, and data-driven MC (12 strips)
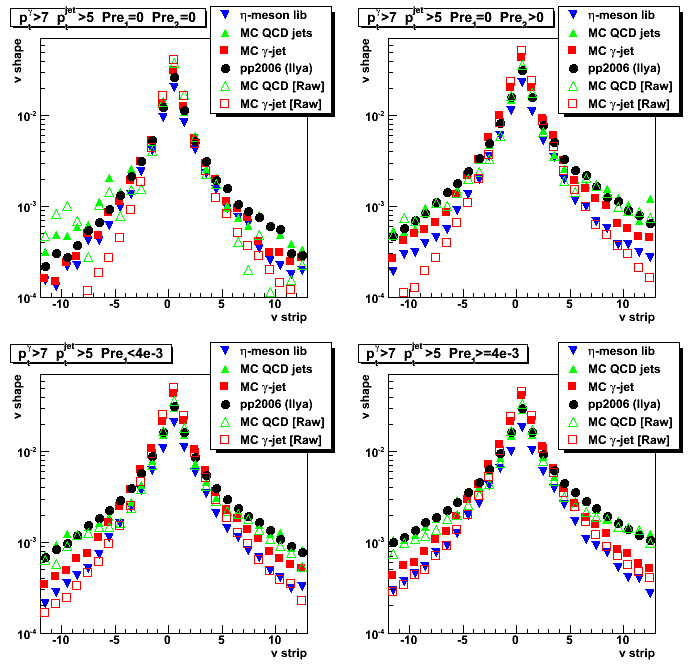
Figure 3: Shower shapes: data, raw, and data-driven MC (5 strips)
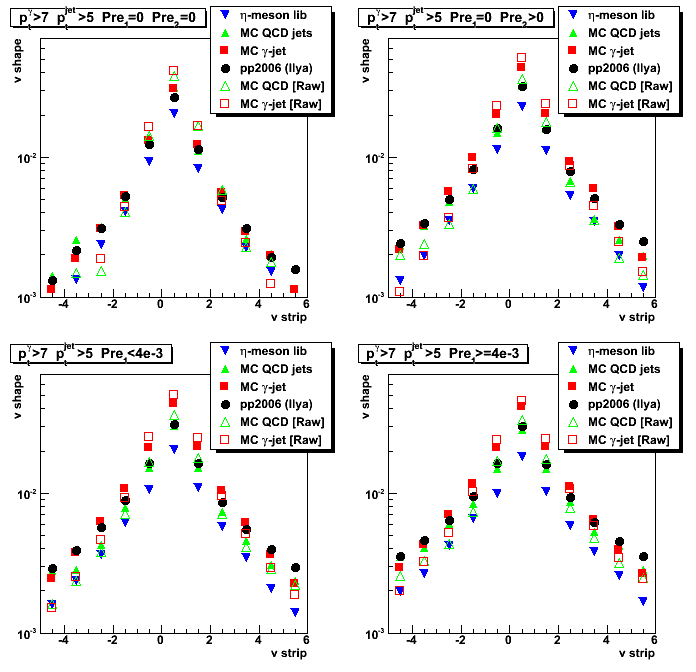
Figure 4: 25 strips SMD cluster energy for data-driven Monte-Carlo
(SMD based shower shape scaling)

Figure 5: 25 strips SMD cluster energy for raw Monte-Carlo
Note, the difference between results in Fig. 4 and 5. for MC gamma-jets (shown in red)
at low energy (Esmd < 0.04) for pre1=0 pre2=0 case.
This effect is due to the "Number of strips fired in 5-strips cluster > 3" cut.
In data-driven Monte-Carlo we may have shower shapes
with small number of strips fired (rejected in raw Monte-Carlo)
to be replaced by library shape with different (bigger) number of strips fired.
This mostly affects photons which starts to shower
later in the detector and only fires few strips (pre1=0 pre2=0 case)
2008.10.30 Various cuts study (pt, Esmd, 8 strips replaced)
Ilya Selyuzhenkov October 30, 2008
Below are links to drupal pages
with various SMD energy distributions and shower shapes
for the following set of cuts/conditions:
- Case A: pt > 7 GeV, +/- 12 strips replaced
- Case B: pt > 7 GeV, +/- 8 strips replaced
- Case C: pt > 7 GeV, +/- 12 strips replaced, E_smd(25strips) > 0.1
- Case D: pt > 8.5 GeV, +/- 12 strips replaced
2008.10.30 Distance to cut line from sided residual
Figure 1: Case A
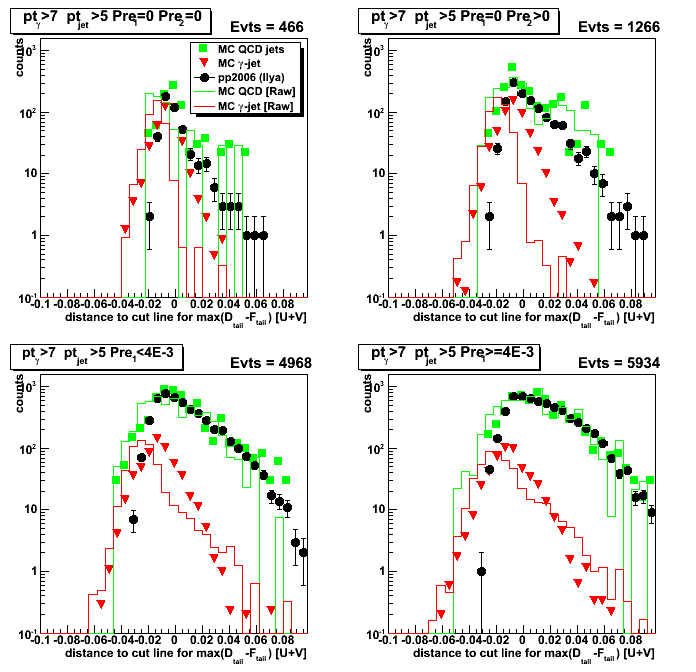
Figure 2:Case B
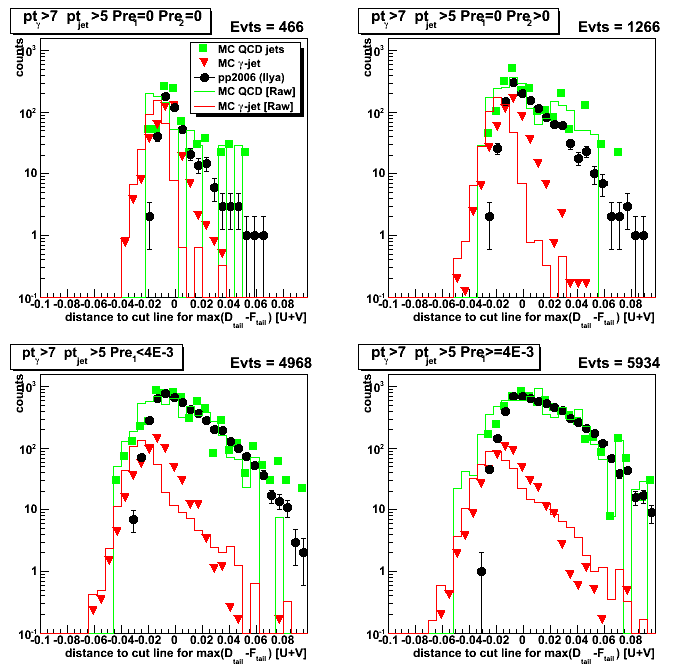
Figure 3:Case C
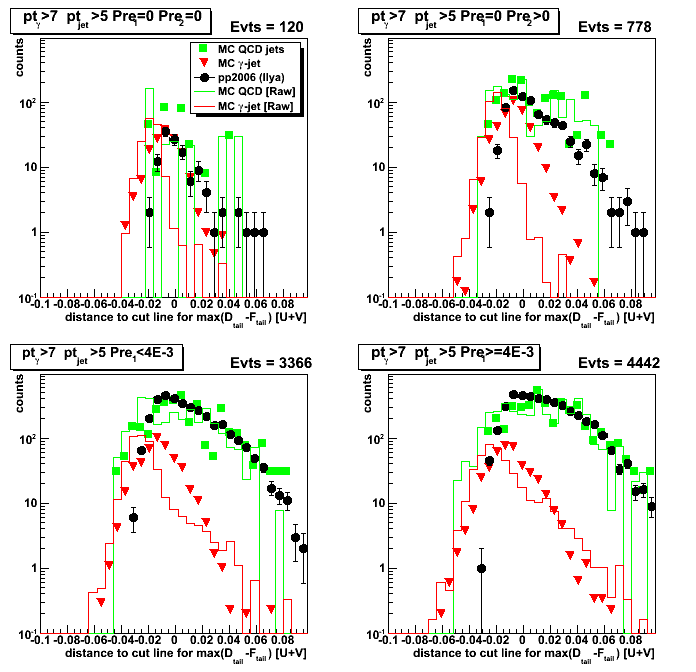
Figure 4:Case D
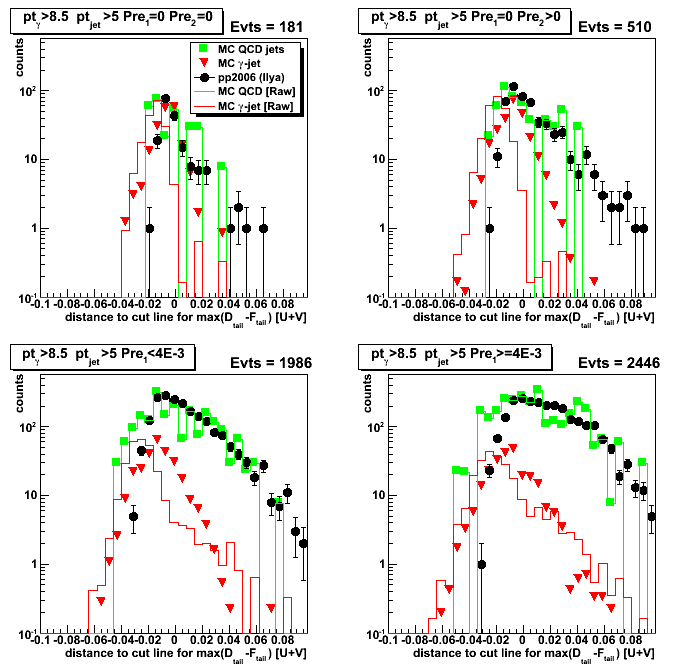
2008.10.30 SMD shower shapes: data, raw, and data-driven MC (12 strips)
Figure 1: Case A
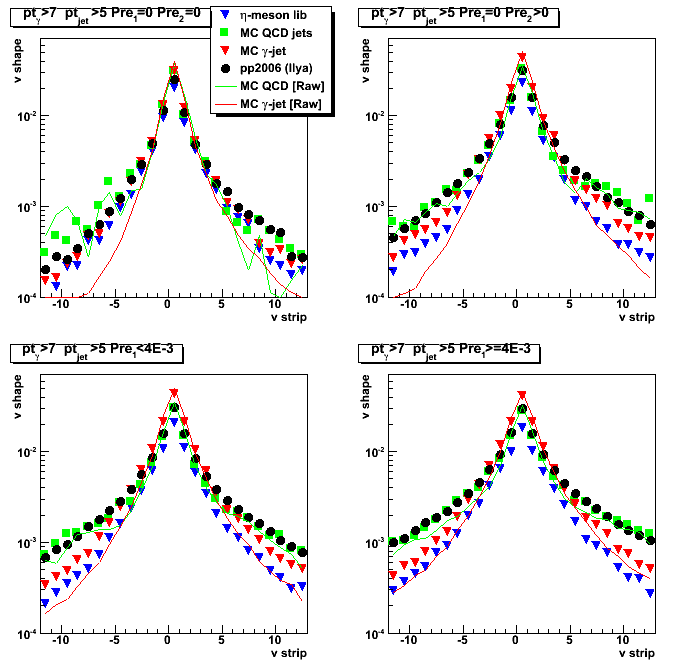
Figure 2:Case B
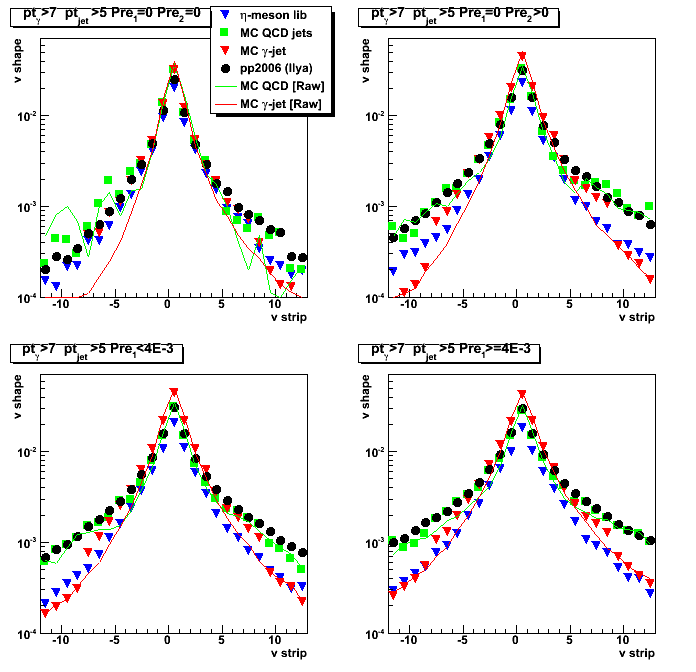
Figure 3:Case C
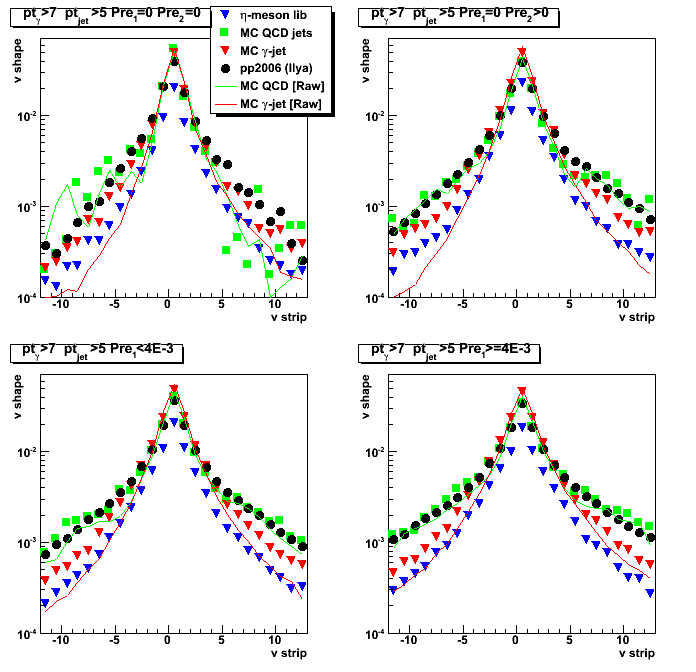
Figure 4:Case D
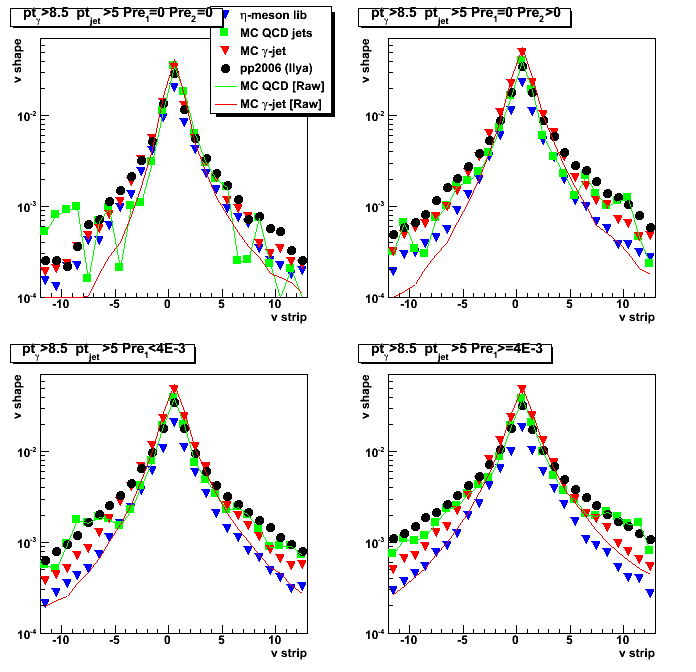
2008.10.30 SMD shower shapes: data, raw, and data-driven MC (30 strips)
Figure 1: Case A
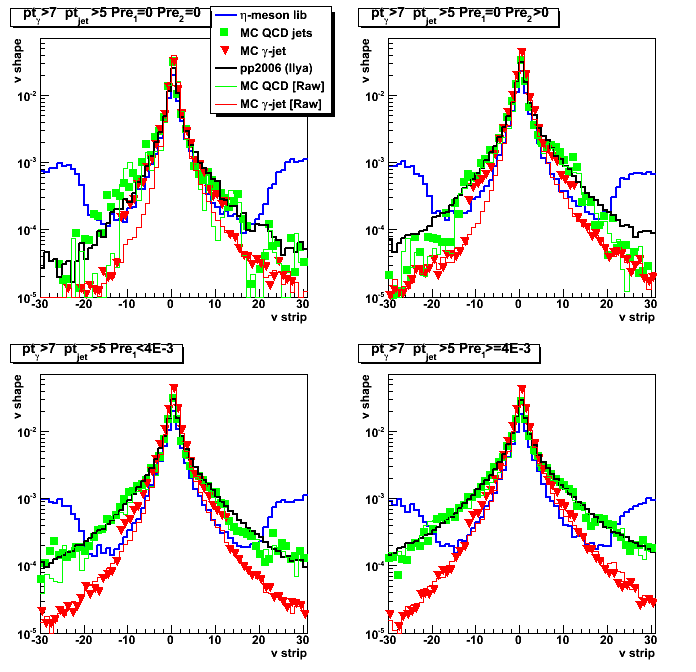
Figure 2: Case B
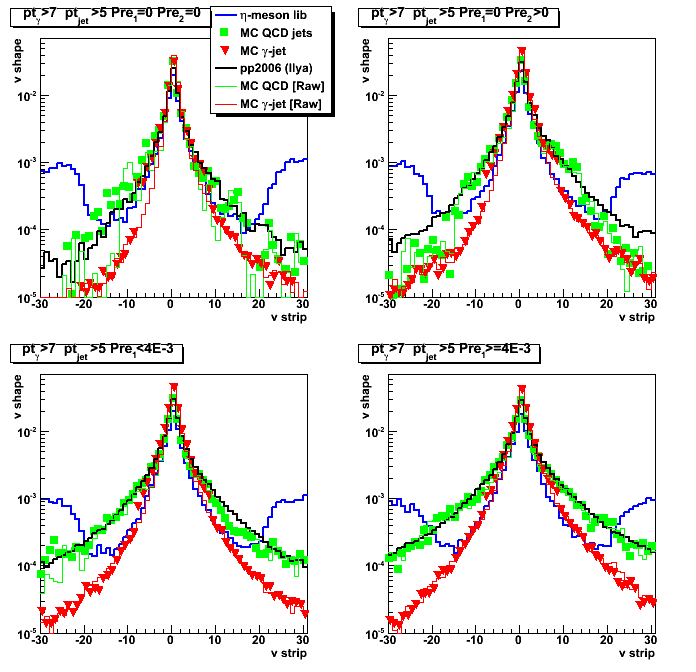
Figure 3: Case C
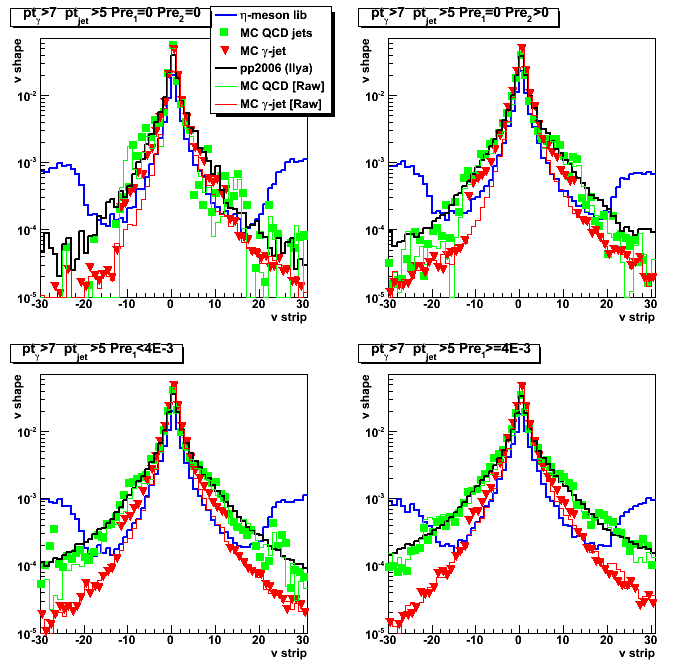
Figure 4: Case D
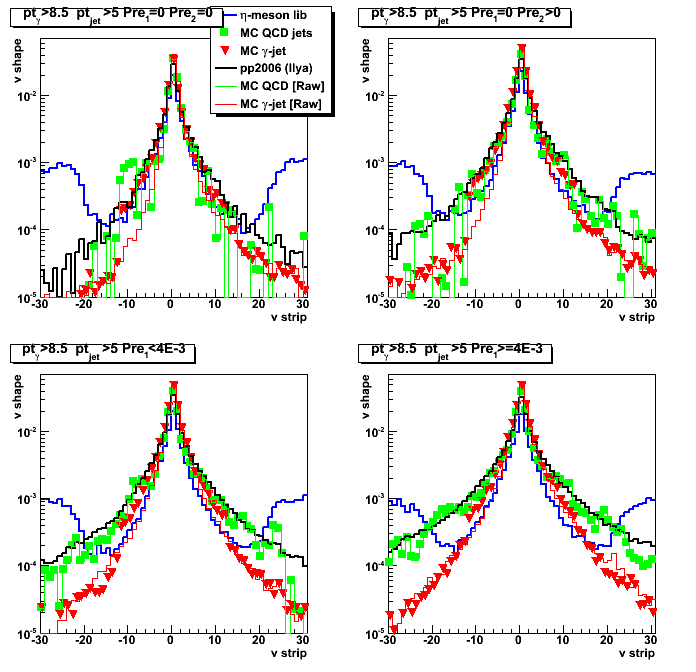
2008.10.30 Sided residual
Figure 1: Case A
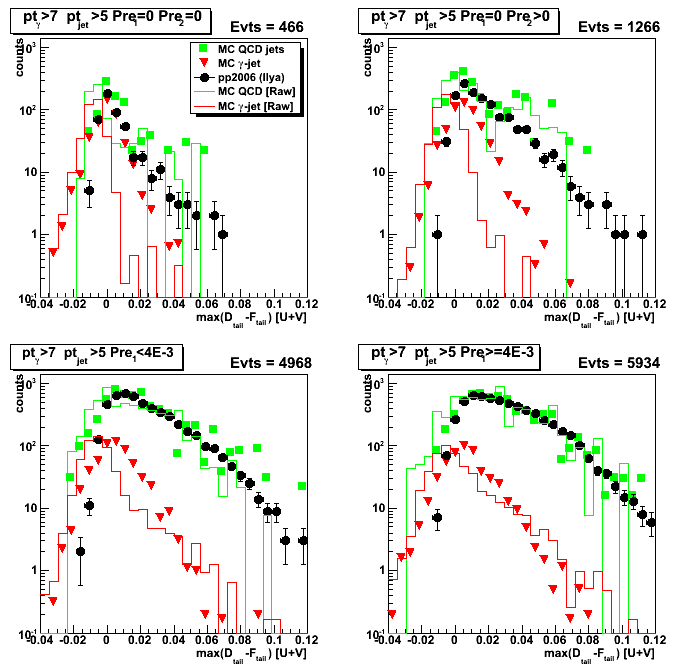
Figure 2:Case B
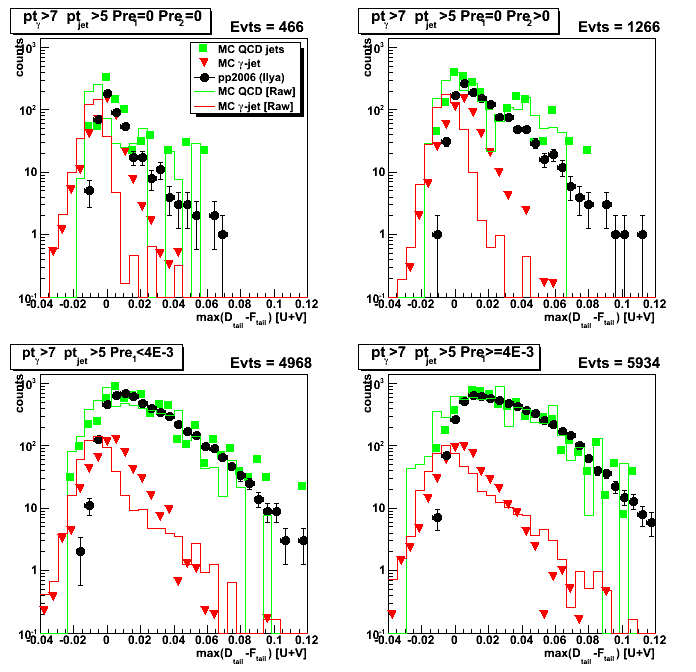
Figure 3:Case C
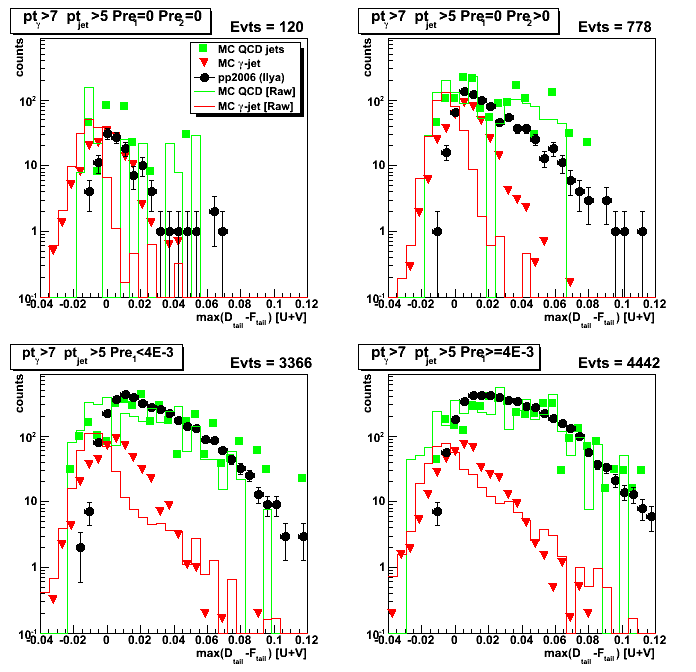
Figure 4:Case D
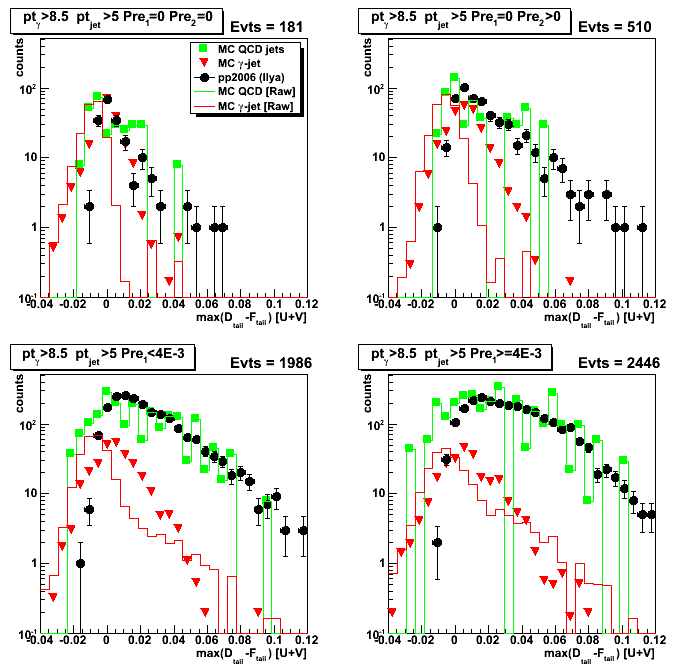
2008.10.30 Smd emergy for left tail (-3 to -30 strips)
Figure 1: Case A

Figure 2:Case B
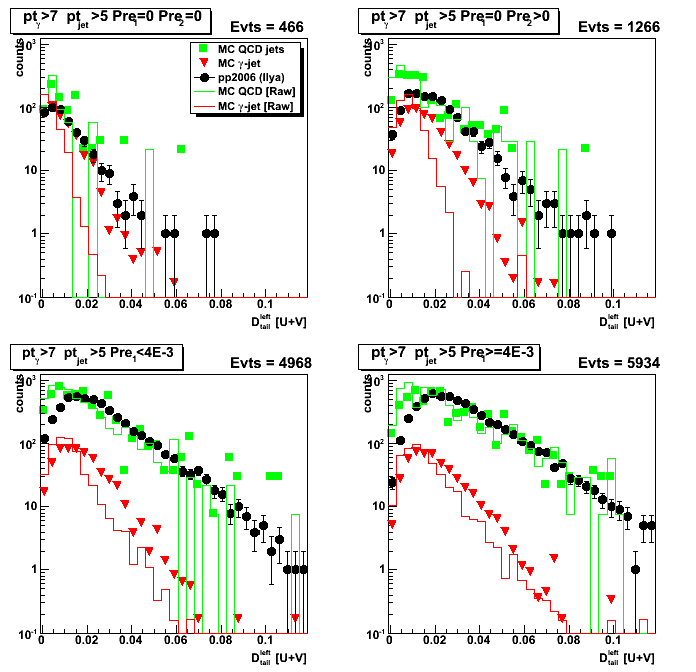
Figure 3:Case C
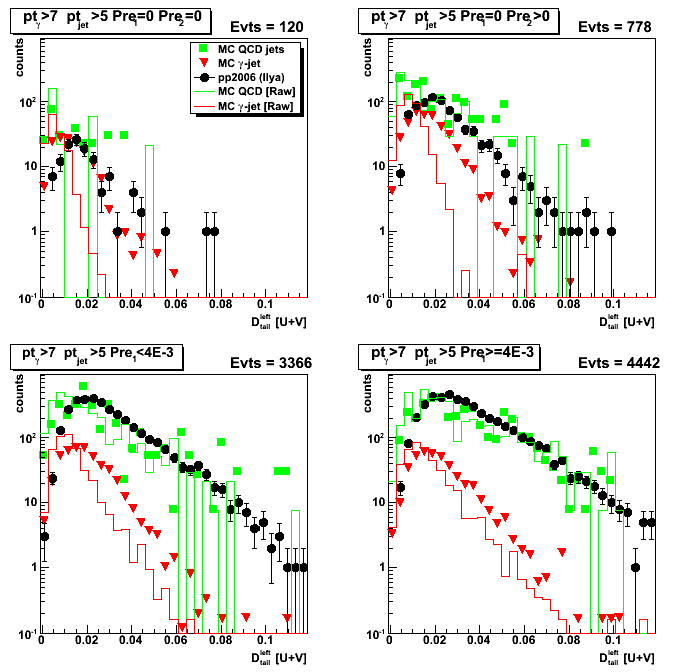
Figure 4:Case D
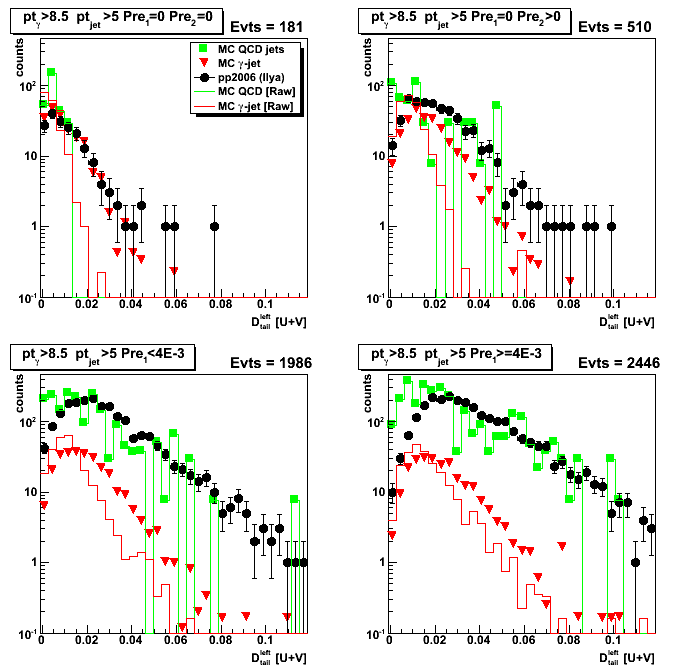
2008.10.30 Smd emergy for right tail (3 to 30 strips)
Figure 1: Case A
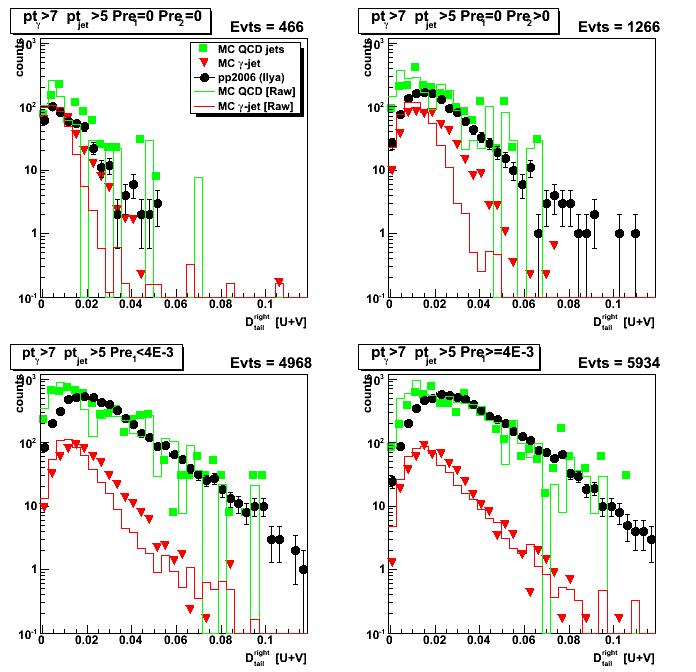
Figure 2:Case B
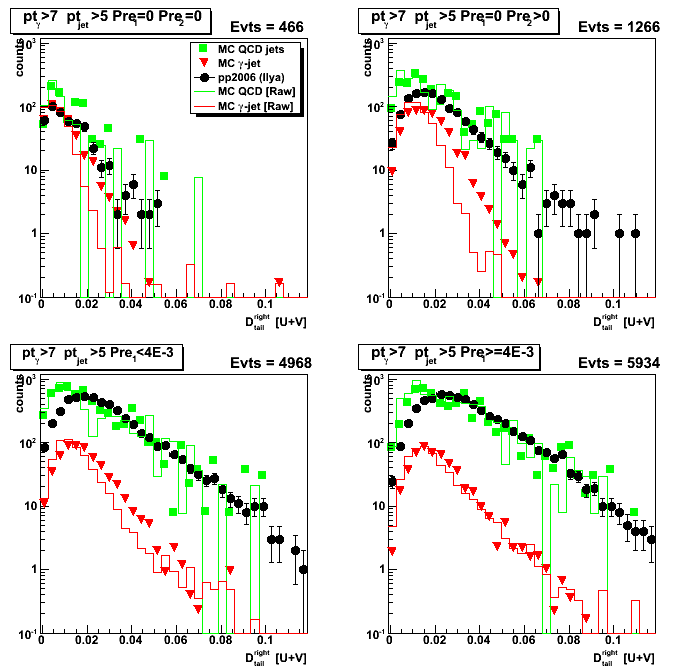
Figure 3:Case C
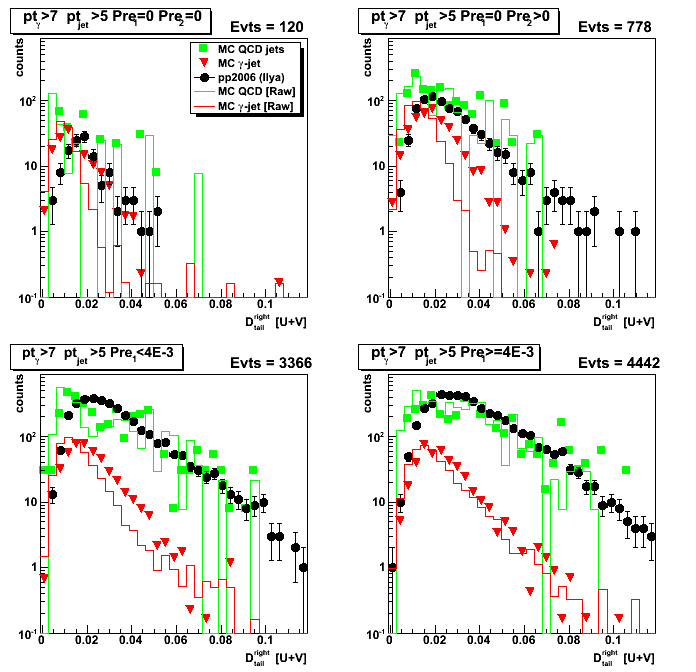
Figure 4:Case D
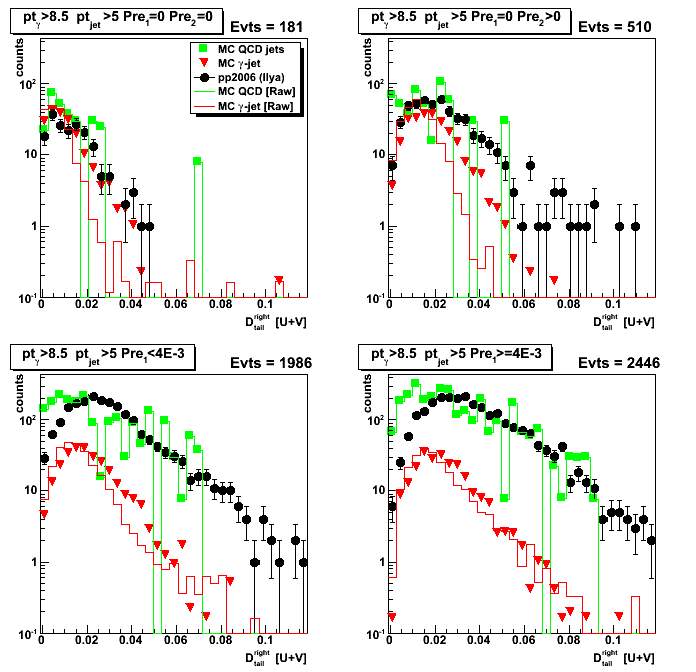
2008.10.30 Smd energy for 25 central strips
Figure 1: Case A
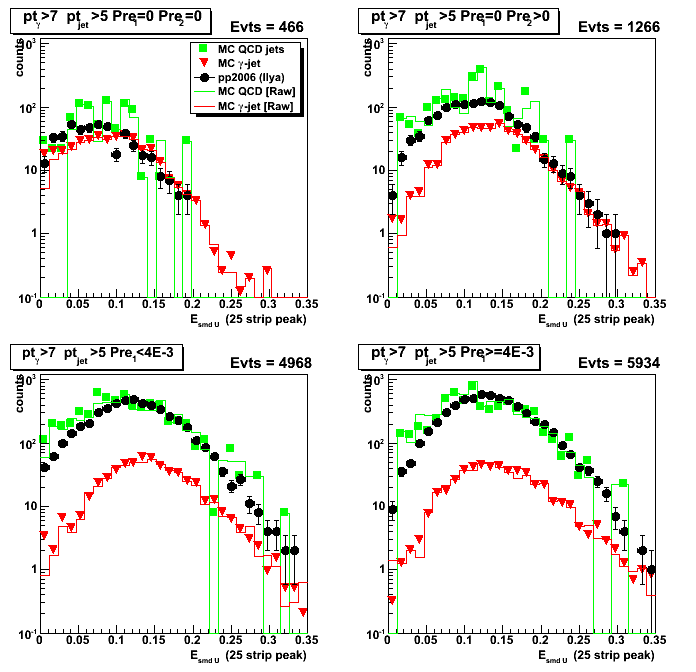
Figure 2:Case B

Figure 3:Case C
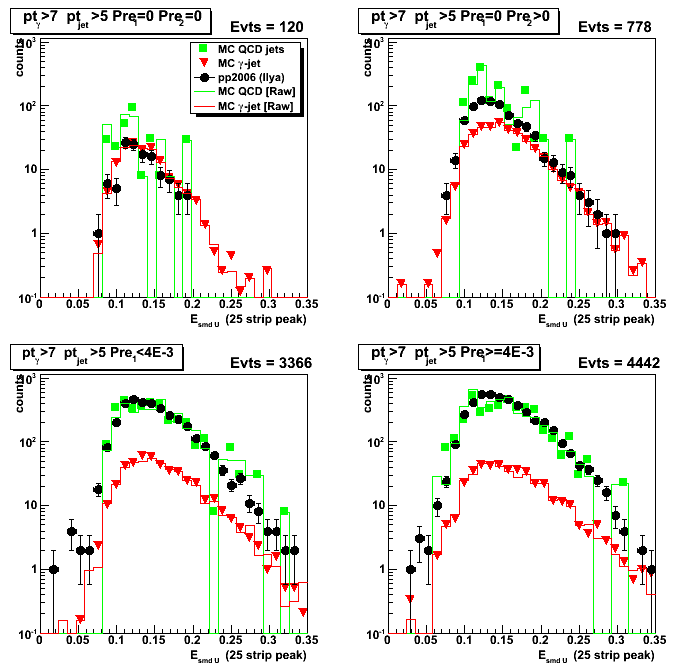
Figure 4:Case D
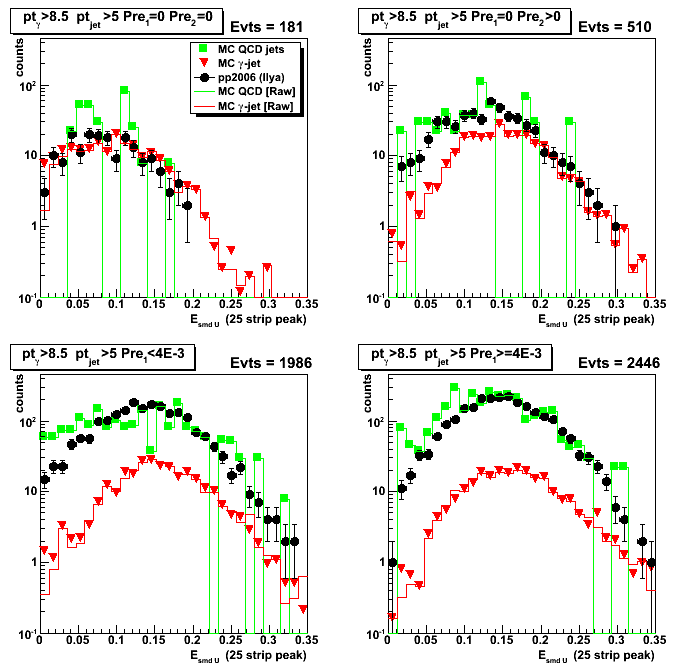
2008.10.30 Smd energy for 5 central strips
Figure 1: Case A
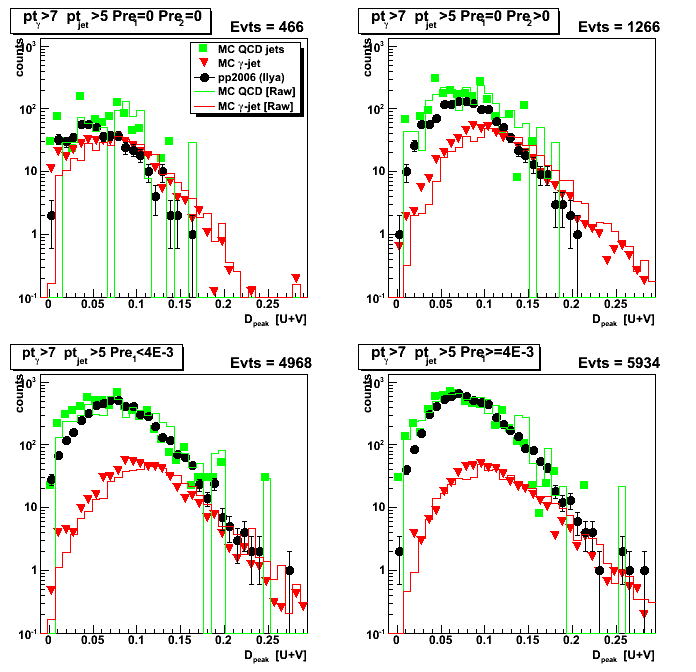
Figure 2:Case B
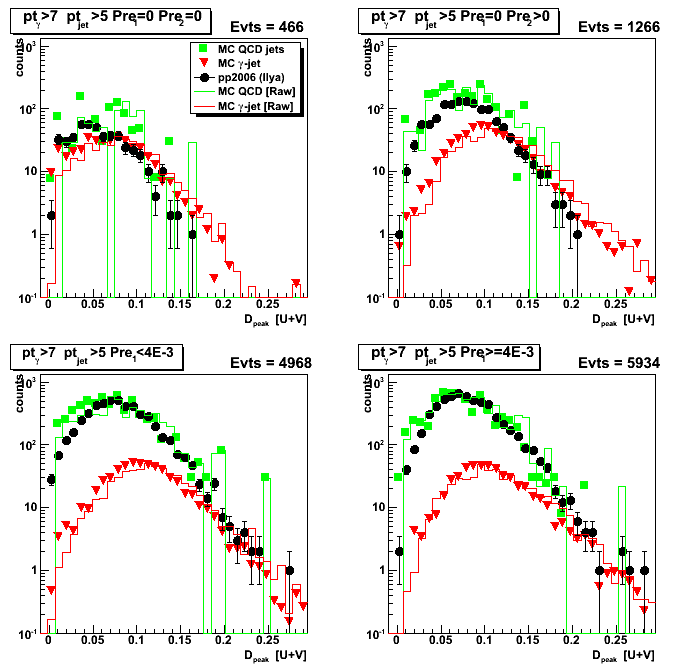
Figure 3:Case C
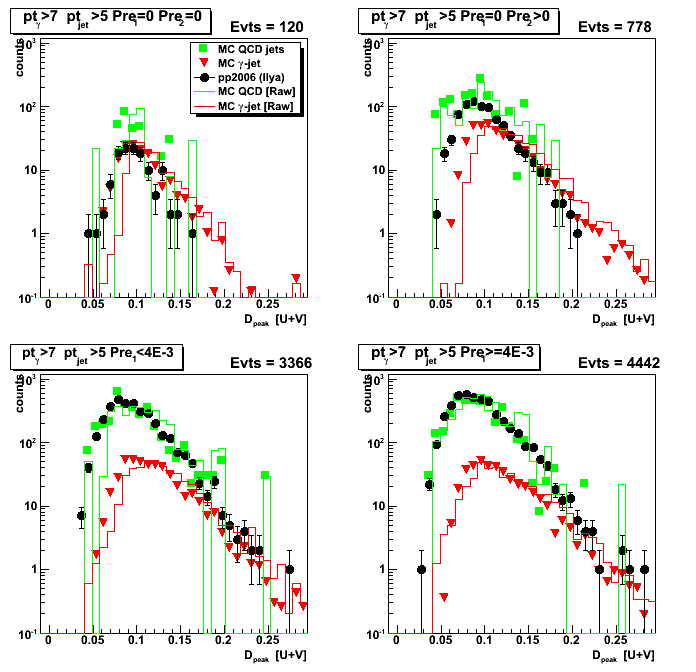
Figure 4:Case D
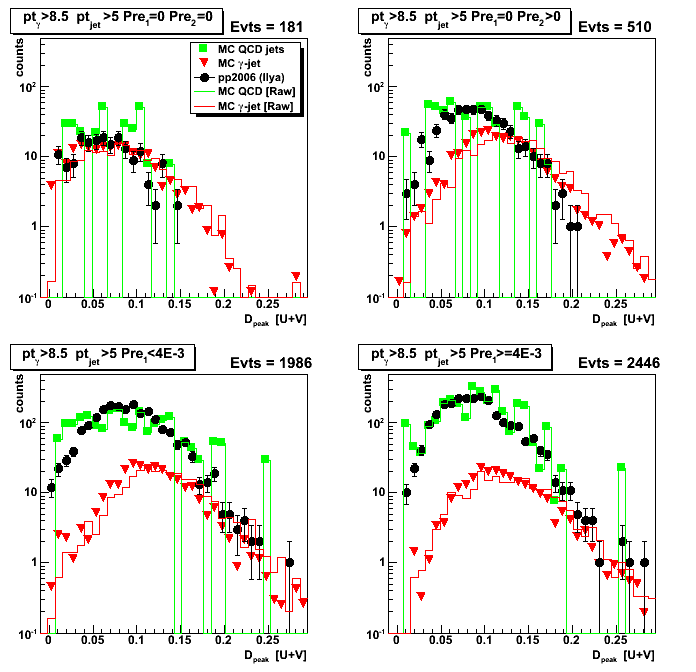
11 Nov
November 2008 posts
2008.11.06 Gamma-jet reconstruction with the Endcap EMC (Analysis status update)
Ilya Selyuzhenkov November 06, 2008
Gamma-jet reconstruction with the Endcap EMC (Analysis status update for Spin PWG)
- latest version (pdf)
- Version 3: pdf or odp (for spin PWG)
- Version 2: pdf or odp (after phana comments)
- Version 1: pdf or odp (draft for phana meeting)
2008.11.11 Yields vs. analysis cuts
Ilya Selyuzhenkov November 11, 2008
Data sets:
- pp2006 - STAR 2006 pp longitudinal data (~ 3.164 pb^1)
after applying gamma-jet isolation cuts (R_cluster > 0.9 is used below). - gamma-jet[gamma-filtered] - data-driven Prompt Photon [p6410EemcGammaFilter] events.
Partonic pt range 2-25 GeV. - QCD jets[gamma-filtered] - data-driven QCD [p6410EemcGammaFilter] events.
Partonic pt range 2-25 GeV.
Figure 1: Reconstructed gamma pt for di-jet events and
Geant cuts: pt_gamma[Geant] > 7GeV and 1.05 < eta_gamma[Geant] < 2.0
Total integral for the histogram is: N_total = 5284
(after weighting different partonic pt bins and scaled to 3.164pb^-1).
Compare with number from Jim Sowinski study for
Endcap East+West gamma-jet and pt>7 GeV: N_Jim = 5472
( Jim's numbers are scaled to 3.164pb^-1 : [2539+5936]*3.164/4.9) 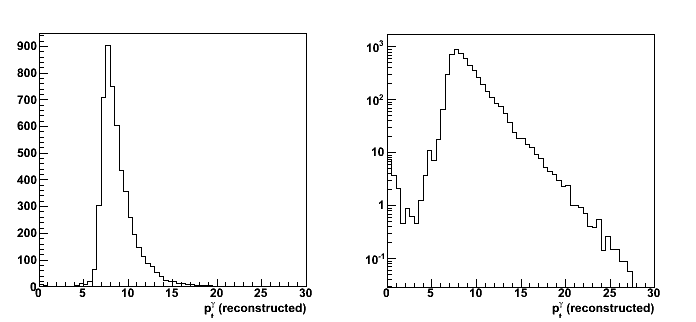
Figure 2: Reconstructed jet pt for di-jet events and the same cuts as in Fig. 1

Yield vs. various analysis cuts
List of cuts (sorted by bin number in Figs. 2 and 3):
- N_events : total number of di-jet events found by the jet-finder
- cos(phi_gamma - phi_jet) < -0.8 : gamma-jet opposite in phi
- R_{3x3cluster} > 0.9 : Energy in 3x3 cluster of EEMC tower to the total jet energy
- R_EM^jet < 0.9 : neutral energy fraction cut for on away side jet
- N_ch=0 : no charge tracks associated with a gamma candidate
- N_bTow = 0 : no barrel towers associated with a gamma candidate (gamma in the endcap)
- N_(5-strip cluster)^u > 2 : minimum number of strips in EEMC SMD u-plane cluster around peak
- N_(5-strip cluster)^v > 2 : minimum number of strips in EEMC SMD v-plane cluster around peak
- gamma-algo fail : my algorithm failed to match tower with SMD uv-intersection, etc...
- Tow:SMD match : SMD uv-intersection has a tower which is not in a 3x3 cluster
Figure 3: Number of accepted events vs. various analysis cuts
The starting number of events (shown in first bin of the plots) is
the number of di-jets with reconstructed gamma_pt>7 GeV and jet_pt>5 GeV
upper left: cuts applied independently
upper right: cuts applied sequentially
lower left: ratio of pp2006 data vs. MC sum of gamma-jet and QCD-jets events (cuts applied independently)
lower right:ratio of pp2006 data vs. MC sum of gamma-jet and QCD jets events (cuts applied sequentially)
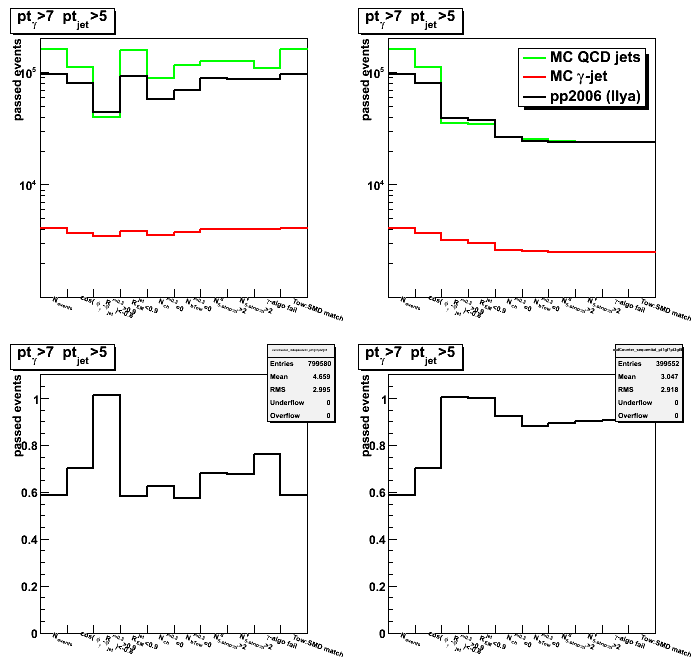
Figure 4: Number of accepted events vs. various analysis cuts
Data from Fig. 3 (upper plots) scaled to the initial number of events from first bin:
left: cuts applied independently
right: cuts applied sequentially

2008.11.18 Cluster isolation cuts: 2x1 vs. 2x2 vs. 3x3
Ilya Selyuzhenkov November 18, 2008
Data sets:
- pp2006 - STAR 2006 pp longitudinal data (~ 3.164 pb^1)
after applying gamma-jet isolation cuts (no R_cluster cut applied for this study). - gamma-jet[gamma-filtered] - data-driven Prompt Photon [p6410EemcGammaFilter] events.
Partonic pt range 2-25 GeV. - QCD jets[gamma-filtered] - data-driven QCD [p6410EemcGammaFilter] events.
Partonic pt range 2-25 GeV.
2x1, 2x2, and 3x3 clusters definition:
- 3x3 cluster: tower energy sum for 3x3 patch around highest tower
- 2x2 cluster: tower energy sum for 2x2 patch
which are closest to 3x3 tower patch centroid.
3x3 tower patch centroid is defined based
on tower energies weighted wrt tower centers:
centroid = sum{E_tow * r_tow} / sum{E_tow}.
Here r_tow=(x_tow, y_tow) denotes tower center. - 2x1 cluster: tower energy sum for high tower plus second highest tower in 3x3 patch
- r=0.7 energy is calculated based on towers
within a radius of 0.7 (in delta phi and eta) from high tower
Cuts applied
all gamma-jet candidate selection cuts except 3x3/r=0.7 energy isolation cut
Results for 2x1, 2x2, and 3x3 clusters
- Energy fraction in NxN cluster in r=0.7 radius
2x1, 2x2, 3x3 patch to jet radius of 0.7 energy ratios - Yield vs. NxN cluster energy fraction in r=0.7
For a given cluster energy fraction yield is defined as an integral on the right - Efficiency vs. NxN cluster energy fraction in r=0.7
For a given cluster energy fraction
efficiency is defined as the yield (on the right)
normalized by the total integral (total yield)
Efficiency vs. NxN cluster energy fraction in r=0.7
Efficiency vs. NxN cluster energy fraction in r=0.7
Figure 1b: 2x1/0.7 ratio
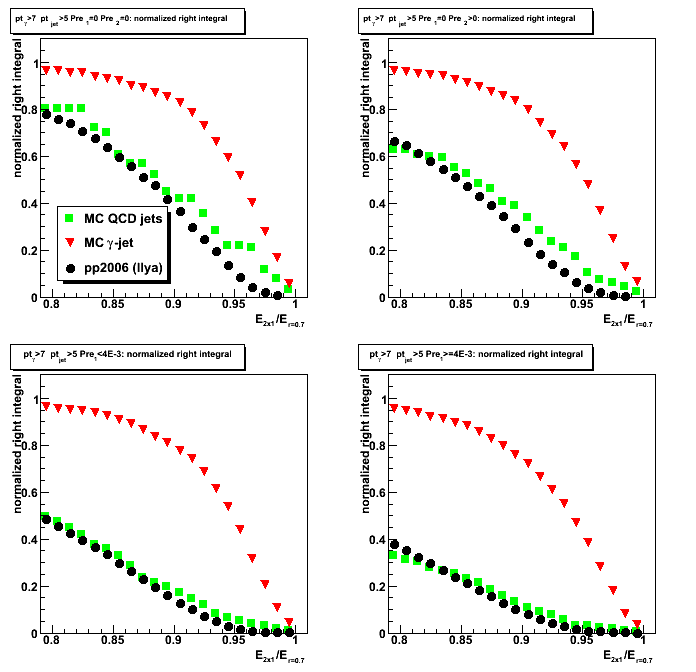
Figure 2b: 2x2/0.7 ratio
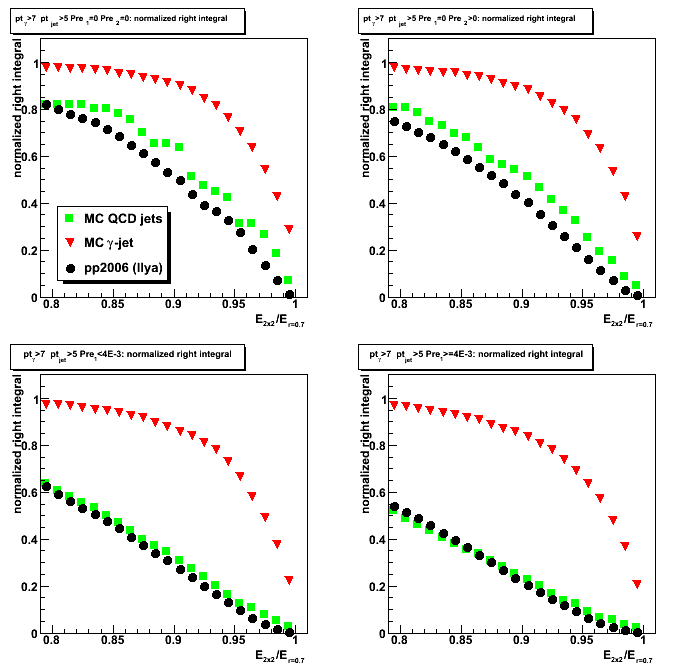
Figure 3b: 3x3/0.7 ratio
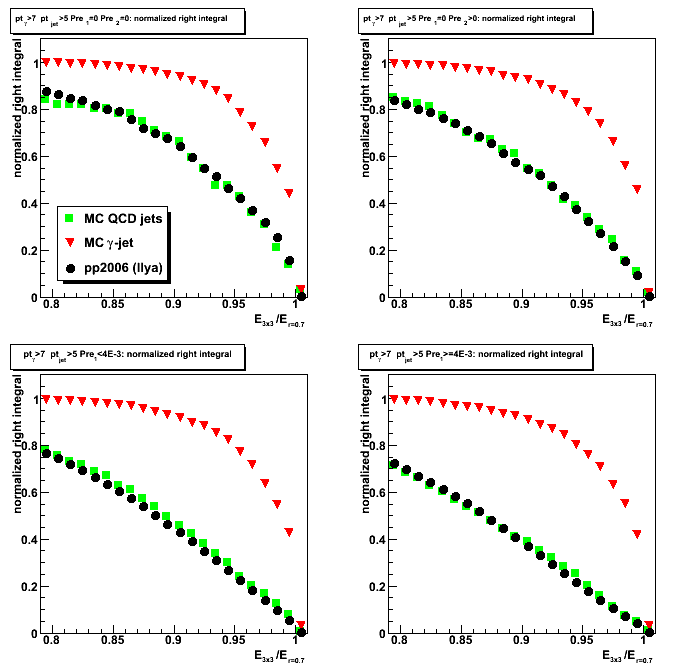
Figure 4b: 3x3/0.7 ratio but only using towers which passed jet finder threshold
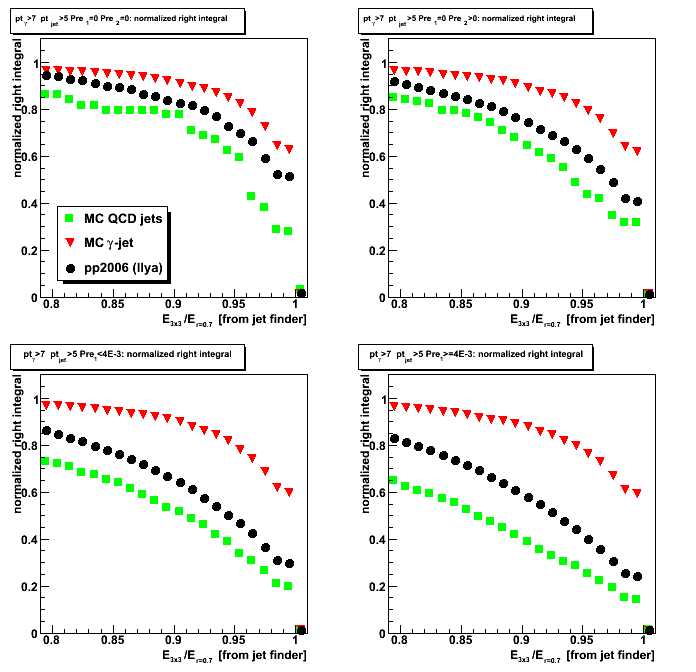
Energy fraction in NxN cluster within r=0.7 radius
Energy fraction in NxN cluster within r=0.7 radius
Figure 1a: 2x1/0.7 ratio
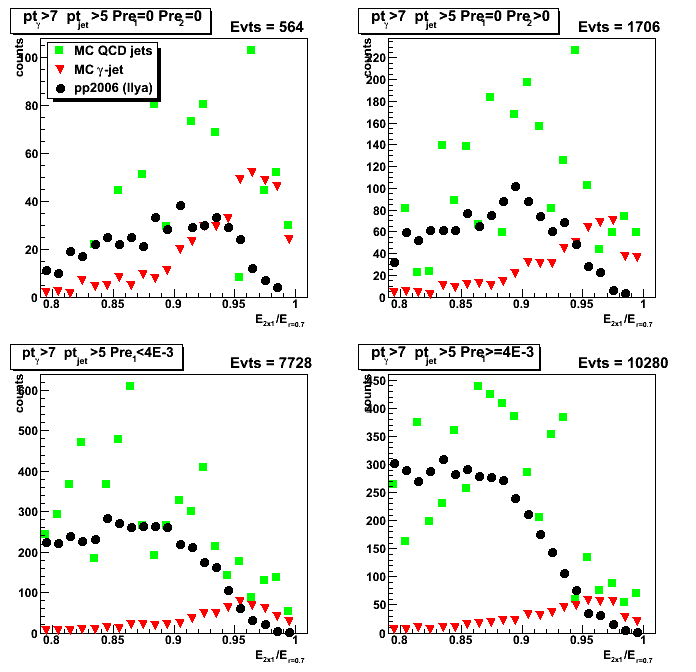
Figure 2a: 2x2/0.7 ratio
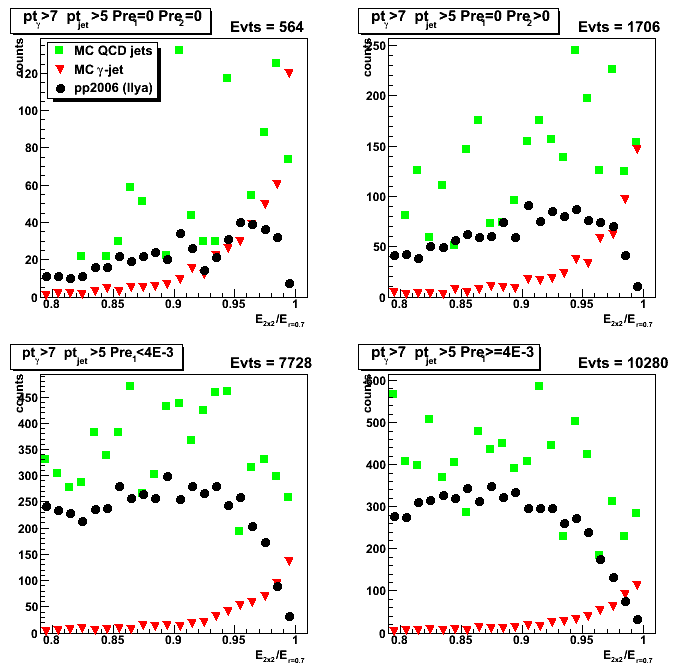
Figure 3a: 3x3/0.7 ratio
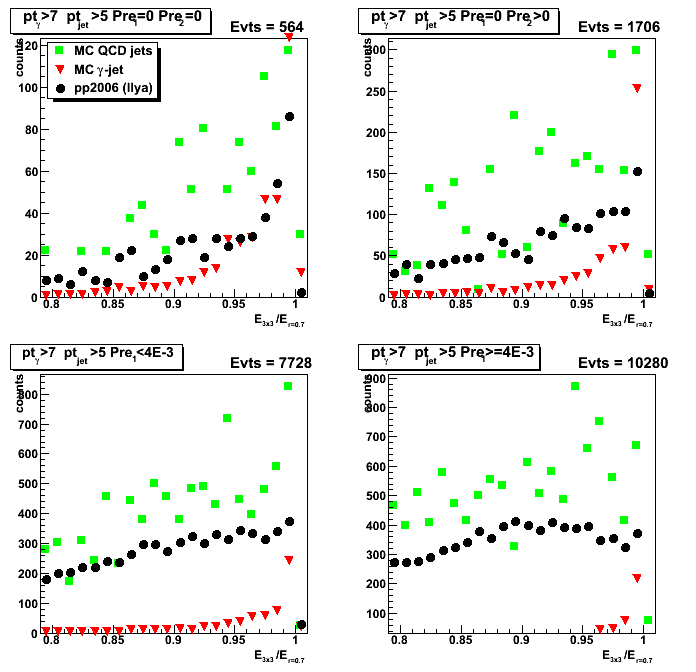
Figure 4a: 3x3/0.7 ratio but only using towers which passed jet finder threshold
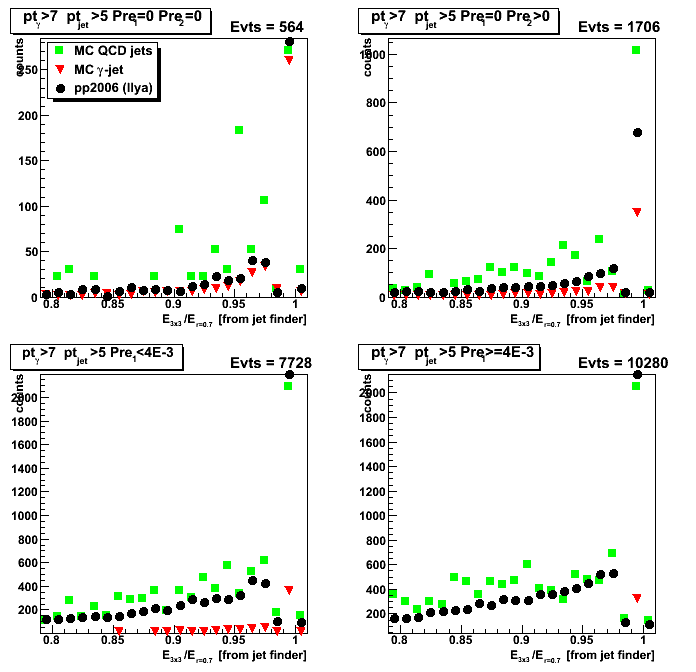
Yield vs. NxN cluster energy fraction in r=0.7
Yield vs. NxN cluster energy fraction in r=0.7
Figure 1c: 2x1/0.7 ratio
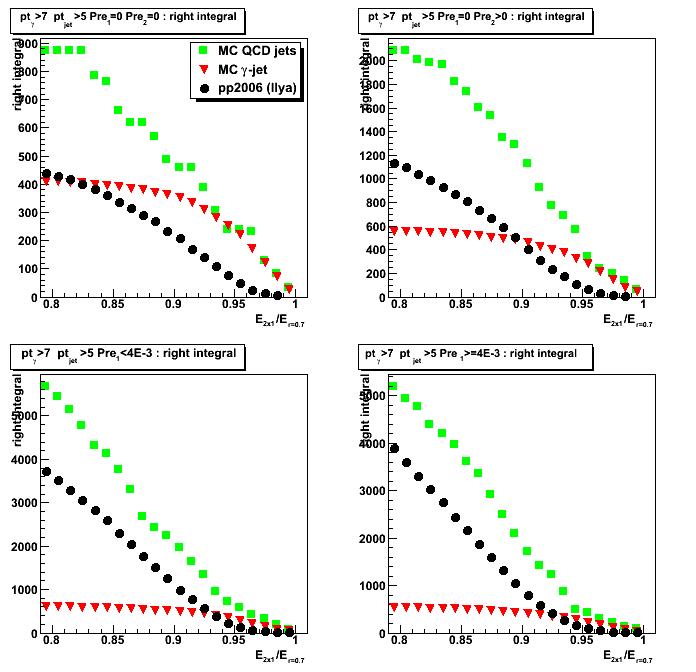
Figure 2c: 2x2/0.7 ratio

Figure 3c: 3x3/0.7 ratio
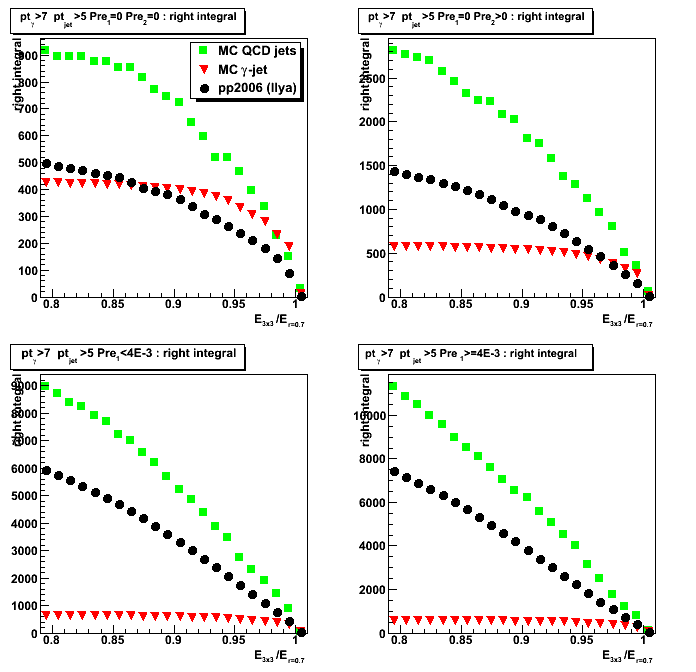
Figure 4c: 3x3/0.7 ratio but only using towers which passed jet finder threshold
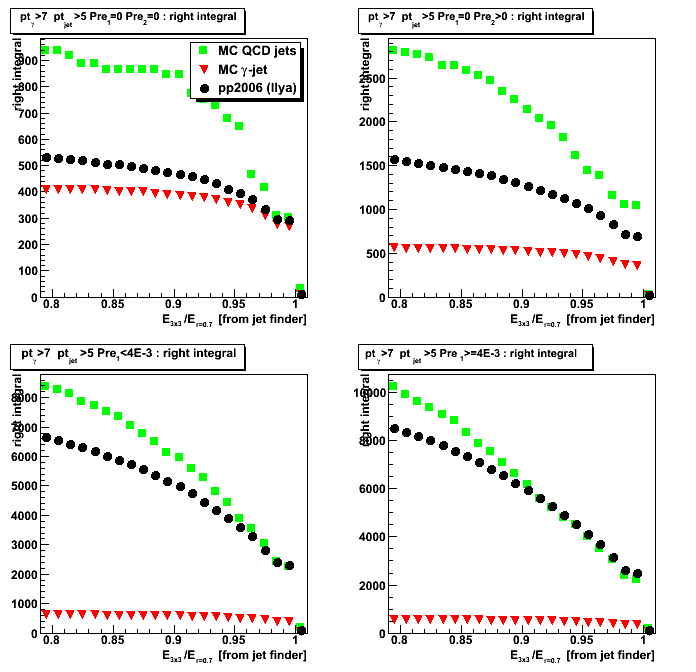
2008.11.21 Energy fraction from 2x1 vs. 2x2 vs. 3x3 or 0.7 radius: rapidity dependence
Ilya Selyuzhenkov November 21, 2008
Data sets:
- pp2006 - STAR 2006 pp longitudinal data (~ 3.164 pb^1)
after applying gamma-jet isolation cuts (no R_cluster cut applied for this study). - gamma-jet[gamma-filtered] - data-driven Prompt Photon [p6410EemcGammaFilter] events.
Partonic pt range 2-25 GeV. - QCD jets[gamma-filtered] - data-driven QCD [p6410EemcGammaFilter] events.
Partonic pt range 2-25 GeV.
2x1, 2x2, and 3x3 clusters definition:
- 3x3 cluster: tower energy sum for 3x3 patch around highest tower
- 2x2 cluster: tower energy sum for 2x2 patch
which are closest to 3x3 tower patch centroid.
3x3 tower patch centroid is defined based
on tower energies weighted wrt tower centers:
centroid = sum{E_tow * r_tow} / sum{E_tow}.
Here r_tow=(x_tow, y_tow) denotes tower center. - 2x1 cluster: tower energy sum for high tower plus second highest tower in 3x3 patch
- r=0.7 energy is calculated based on towers
within a radius of 0.7 (in delta phi and eta) from high tower
Cuts applied
all gamma-jet candidate selection cuts except 3x3/r=0.7 energy isolation cut
Results
There are two sets of figures in links below:
- Number of counts for a given energy fraction
- Yield above given energy fraction
[figures with right integral in the caption]
Yield is defined as the integral above given energy fraction
up to the maximum value of 1
Gamma candidate detector eta < 1.5
(eta region where we do have most of the TPC tracking):
Gamma candidate detector eta > 1.5:
(smaller tower size)
Some observation
- For pre1>0 condition (contains most of events)
yield in Monte-Carlo for eta > 1.5 case
is about factor of two different than that from pp2006 data,
while for eta < 1.5 Monte-Carlo yield agrees with data within 10-15%.
This could be due to trigger effect? - For pre1=0 case yiled for both eta > 1.5 and eta < 1.5 are different in data and MC
This could be due to migration of counts from pre1=0 to pre1>0
in pp2006 data due to more material budget than it is Monte-Carlo - For pre1=0 condition pp2006 data shapes are not reproduced by gamma-jet Monte-Carlo.
With a larger cluster size (2x1 -> 3x3) the pp2006 and MC gamma-jet shapes
are getting closer to each other. - For pre1>0 condition (with statistics available),
pp2006 data shapes are consistent with QCD Monte-Carlo.
Cluster energy fraction in 0.7 radius: detector eta < 1.5
Energy fraction in NxN cluster within r=0.7 radius: detector eta < 1.5
Figure 1a: 2x1/0.7 energy fraction [number of counts per given fraction]
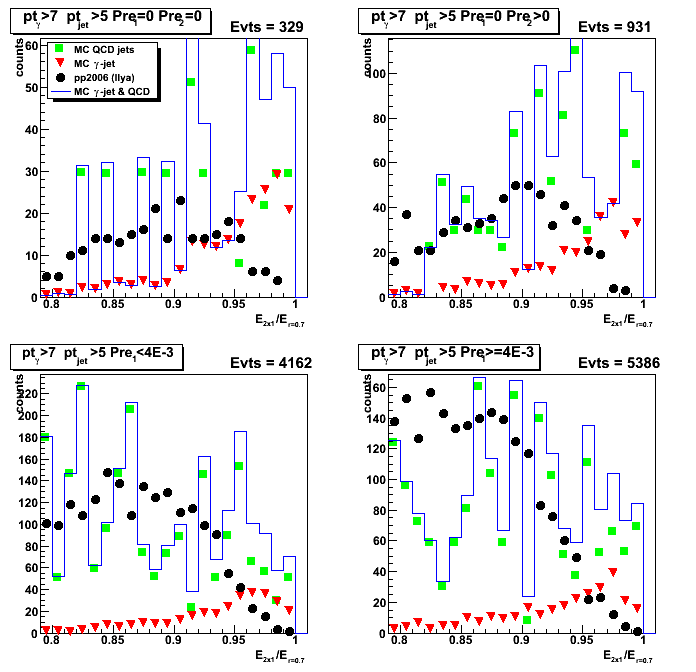
Figure 2a: 2x2/0.7 energy fraction [number of counts per given fraction]
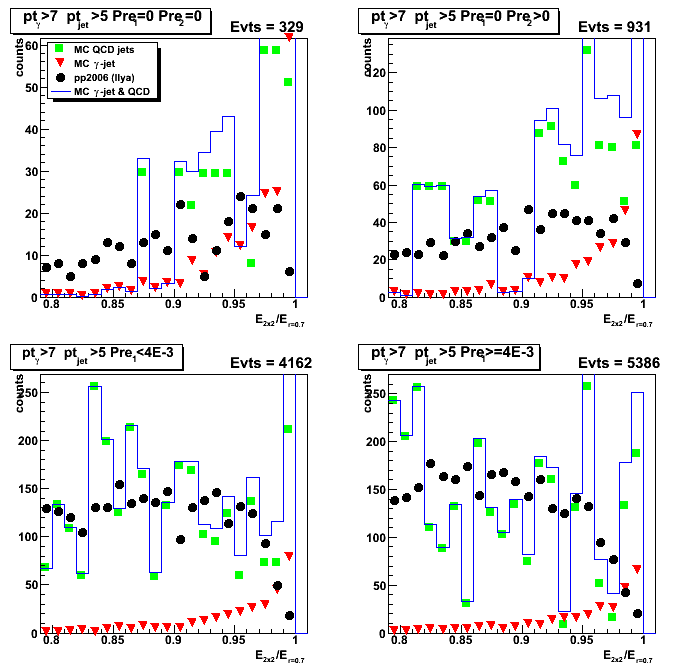
Figure 3a: 3x3/0.7 energy fraction [number of counts per given fraction]

Yield vs. NxN cluster energy fraction in r=0.7: detector eta < 1.5
Figure 4a: 2x1/0.7 energy fraction [yield]
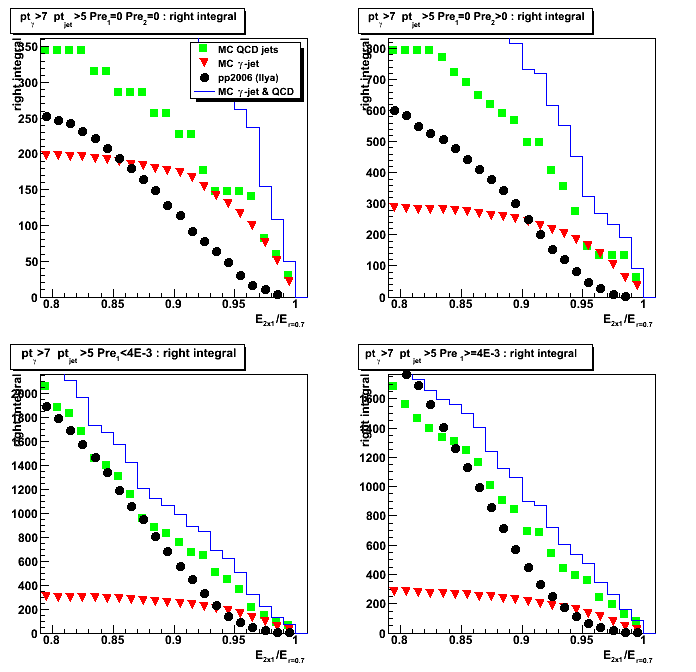
Figure 5a: 2x2/0.7 energy fraction [yield]
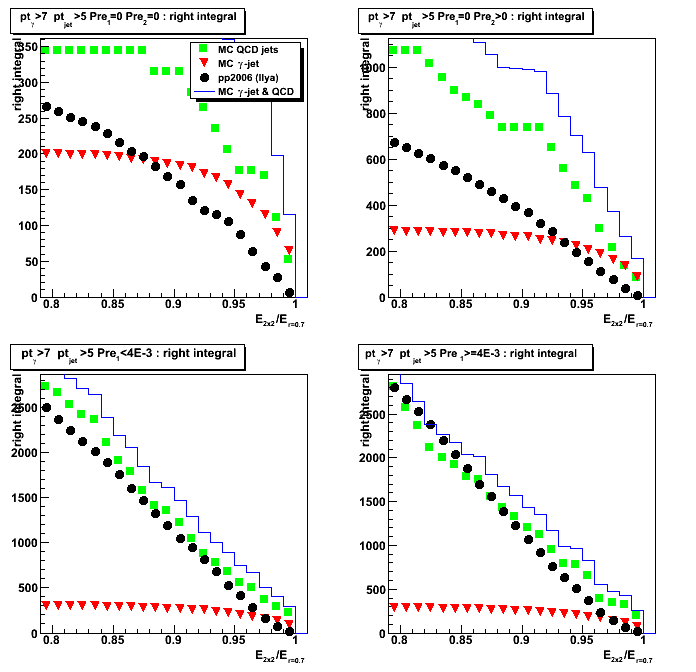
Figure 6a: 3x3/0.7 energy fraction [yield]
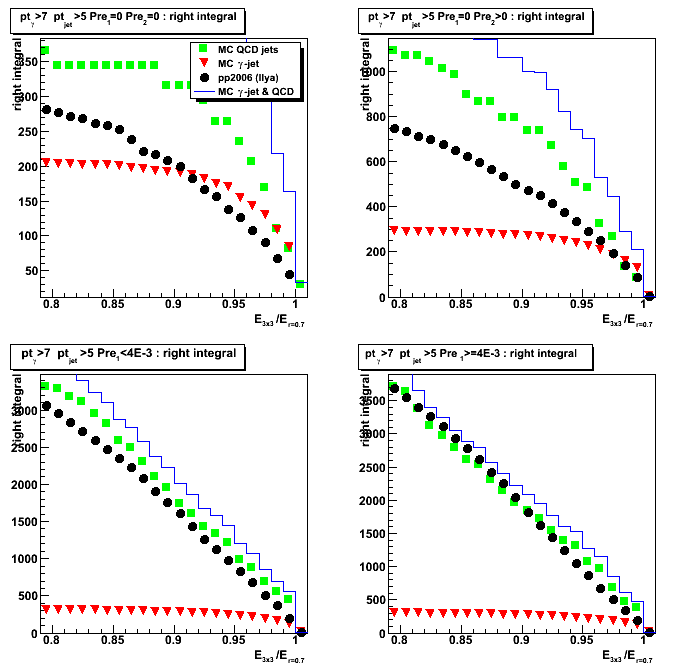
Cluster energy fraction in 0.7 radius: detector eta > 1.5
Energy fraction in NxN cluster within r=0.7 radius: detector eta < 1.5
Figure 1a: 2x1/0.7 energy fraction [number of counts per given fraction]

Figure 2a: 2x2/0.7 energy fraction [number of counts per given fraction]
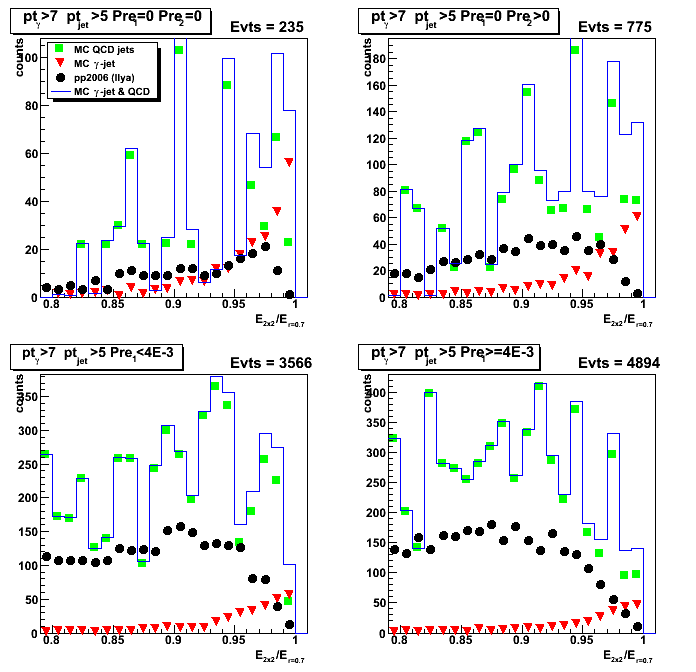
Figure 3a: 3x3/0.7 energy fraction [number of counts per given fraction]
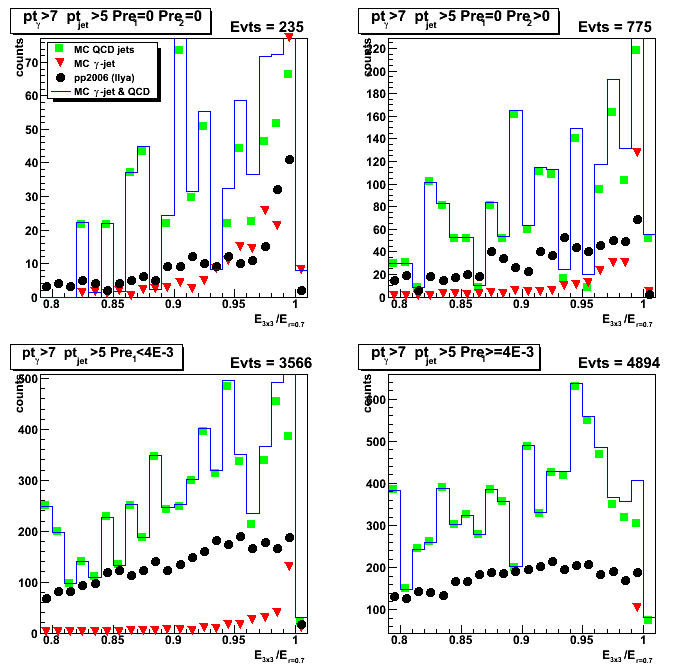
Yield vs. NxN cluster energy fraction in r=0.7: detector eta < 1.5
Figure 4a: 2x1/0.7 energy fraction [yield]
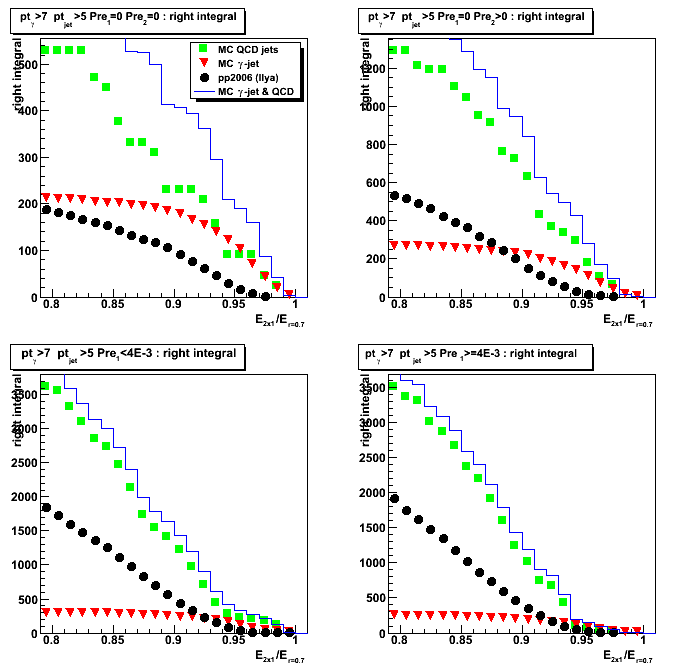
Figure 5a: 2x2/0.7 energy fraction [yield]
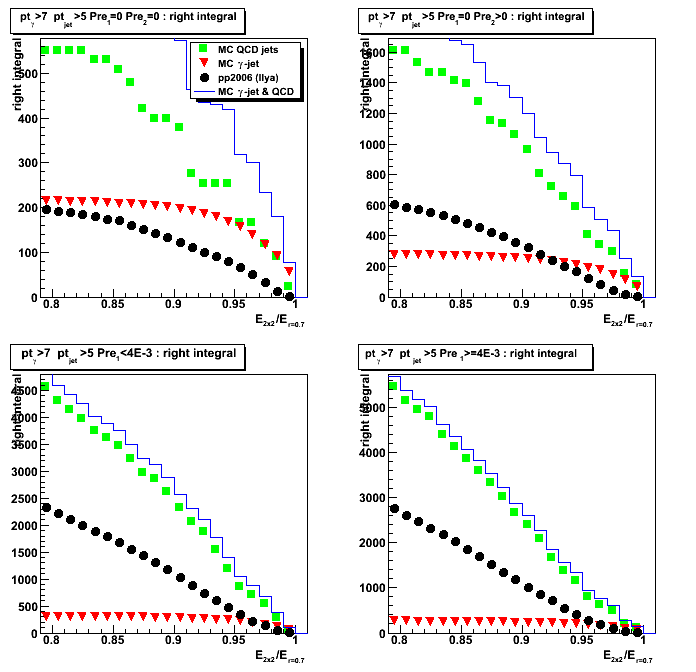
Figure 6a: 3x3/0.7 energy fraction [yield]

Cluster energy fraction in 3x3 patch: detector eta < 1.5
Energy fraction from NxN cluster in 3x3 patch: detector eta < 1.5
Figure 1a: 2x1/3x3 energy fraction [number of counts per given fraction]

Figure 2a: 2x2/3x3 energy fraction [number of counts per given fraction]
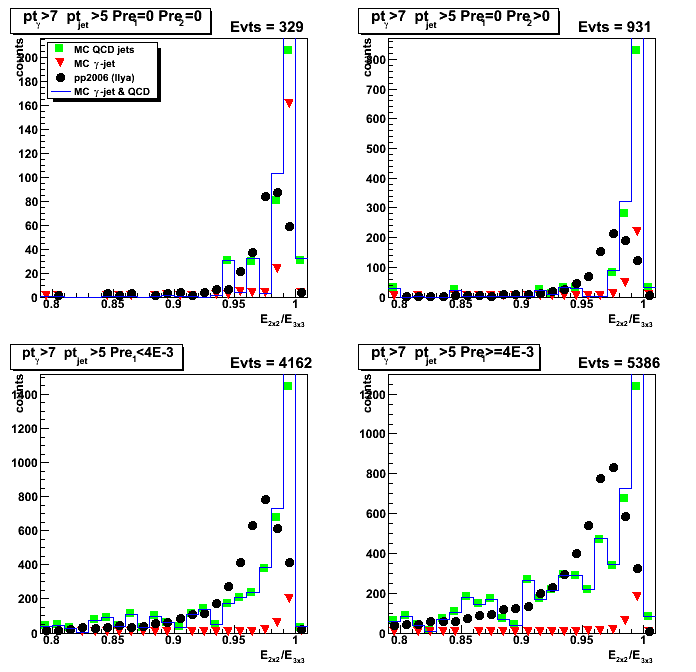
Yield vs. NxN cluster energy fraction in 3x3 patch: detector eta < 1.5
Figure 4a: 2x1/3x3 energy fraction [yield]
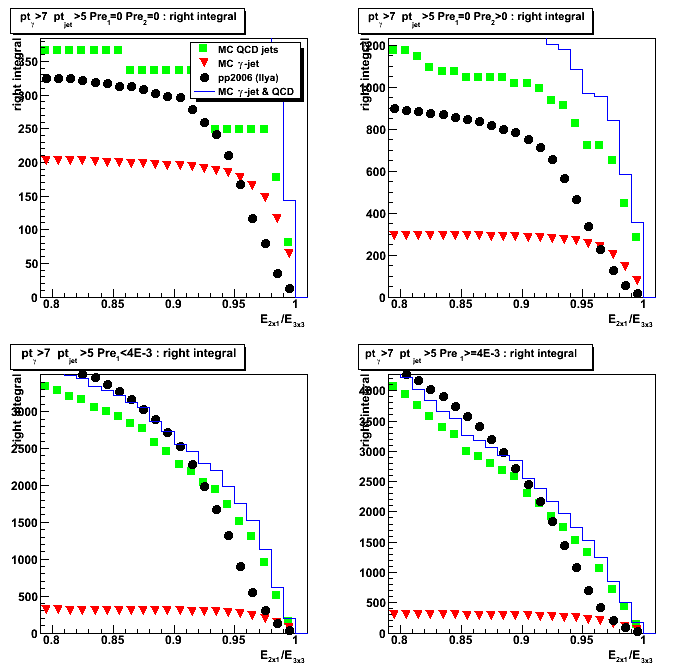
Figure 5a: 2x2/3x3 energy fraction [yield]
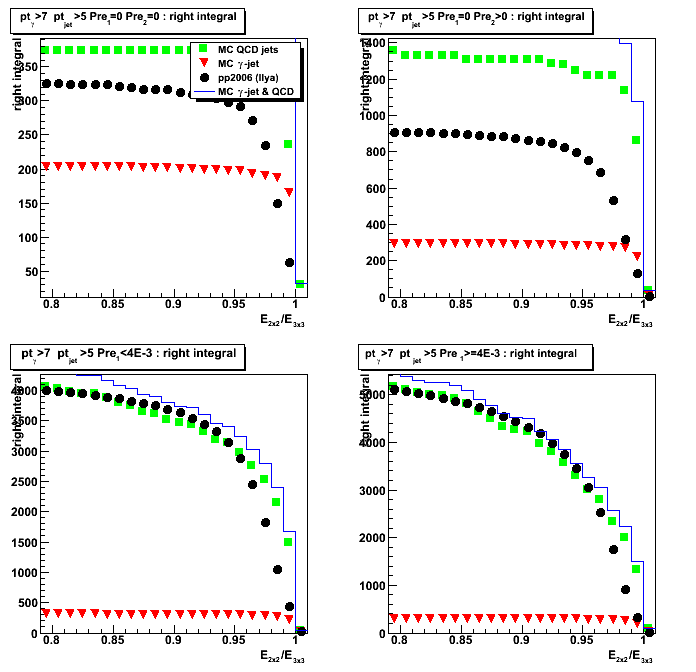
Cluster energy fraction in 3x3 patch: detector eta > 1.5
Energy fraction from NxN cluster in 3x3 patch: detector eta > 1.5
Figure 1a: 2x1/3x3 energy fraction [number of counts per given fraction]

Figure 2a: 2x2/3x3 energy fraction [number of counts per given fraction]
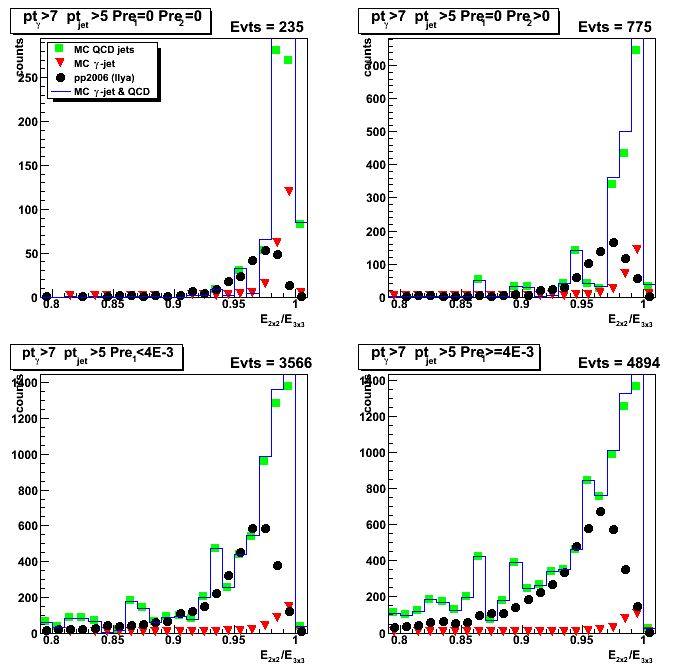
Yield vs. NxN cluster energy fraction in 3x3 patch: detector eta > 1.5
Figure 4a: 2x1/3x3 energy fraction [yield]

Figure 5a: 2x2/3x3 energy fraction [yield]

2008.11.25 Yiled vs. analysis cuts: eta dependence
Ilya Selyuzhenkov November 25, 2008
Data sets:
- pp2006 - STAR 2006 pp longitudinal data (~ 3.164 pb^1)
- gamma-jet[gamma-filtered] - data-driven Prompt Photon [p6410EemcGammaFilter] events.
Partonic pt range 2-25 GeV. - QCD jets[gamma-filtered] - data-driven QCD [p6410EemcGammaFilter] events.
Partonic pt range 2-25 GeV.
Some observation
- Fig. 1 [upper&lower left, 3rd bin] indicates that
cluster energy isolation is the most important cut
for signal/background separation - Fig.1 [lower right, 3rd bin] shows that
R_cluster cut is independent from (or orthogonal to) other cuts - Fig.1 [upper&lower left 4th bin] shows that
cut on neutral energy fraction for the away side jet
rejects more signal that background events
We probably need to reconsider that cut - Fig.2 [lower left, 5th bin] shows that
charge particle veto significantly improves
signal to background ratio - Fig.3 [lower left, 5th bin] shows that
in the region were we do not have TPC tracking (photon eta > 1.5)
charge particle veto is not efficient,
although there is still some improvement from this cut.
This probably due to tracks with eta <1.5
which fall into large isolation radius r=0.7.
Fig.2 [lower right, 5th bin] shows that
charge particle veto also independent from other cuts
Yield vs. various analysis cuts
List of cuts (sorted according to bin number in Figs. 1-3. [No SMD sided residual cuts]):
- N_events : total number of di-jet events found by the jet-finder
- cos(phi_gamma - phi_jet) < -0.8 : gamma-jet opposite in phi
- R_{3x3cluster}: Energy in 3x3 cluster of EEMC tower to the total jet energy
R_{3x3cluster}>0.9 for Fig. 1, and it is disabled in Fig. 2 and 3 - R_EM^jet < 0.9 : neutral energy fraction cut for on away side jet
- N_ch=0 : no charge tracks associated with a gamma candidate
- N_bTow = 0 : no barrel towers associated with a gamma candidate (gamma in the endcap)
- N_(5-strip cluster)^u > 2 : minimum number of strips in EEMC SMD u-plane cluster around peak
- N_(5-strip cluster)^v > 2 : minimum number of strips in EEMC SMD v-plane cluster around peak
- gamma-algo fail : my algorithm failed to match tower with SMD uv-intersection, etc...
- Tow:SMD match : SMD uv-intersection has a tower which is not in a 3x3 cluster
Figure 1: Number of accepted events vs. various analysis cuts
The starting number of events (shown in first bin of the plots) is
the number of di-jets with reconstructed gamma_pt>7 GeV and jet_pt>5 GeV
upper left: cuts applied independently
upper right: expept this cut fired
(event passed all other cuts and being rejected by this cut)
lower left: "cuts applied independently" normalized by the total number of events
lower right: "expept this cut fired" normalized by the total number of events

Figure 2: Same as Fig.1 except: no R_cluster cut and photon detector eta < 1.5
(eta region where we do have most of the TPC tracking)
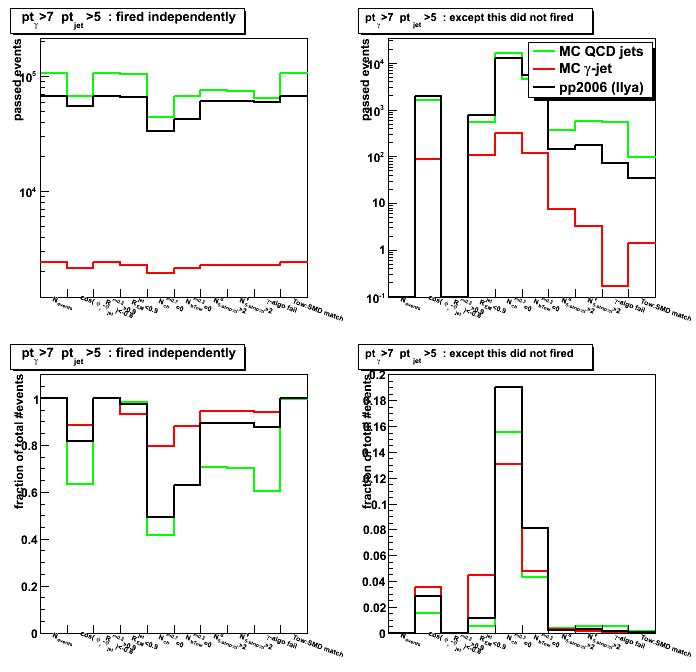
Figure 3: Same as Fig.1 except: no R_cluster cut and photon detector eta > 1.5

12 Dec
December 2008 posts
2008.12.08 Run 8 EEMC QA
Ilya Selyuzhenkov December 08, 2008
Data sets:
- pp2006 - STAR 2006 pp longitudinal data (~ 3.164 pb^1)
Trigger: eemc-http-mb-L2gamma [id:137641] - pp2008 - STAR 2008 pp data
Trigger: etot-mb-l2 [id:7]
Days: 53-70; ~0.5M triggered events (1/3 of available statistics)
Detector subsystems involved in analysis:
- TPC (vertex, jets, charge particle veto)
- Endcap EMC (triggering, photon candidate reconstruction)
- Barrel EMC (away side jet reconstruction)
Gamma-jet analysis cuts:
- Select only di-jet events
- cos(phi_gamma - phi_jet) < -0.8 : gamma-jet opposite in phi
- R_EM^jet < 0.9 : neutral energy fraction cut for the away side jet
- N_ch=0 : no charge tracks associated with a gamma candidate
- N_bTow = 0 : no barrel towers associated with a gamma candidate (gamma in the endcap)
- N_(5-strip cluster)^u > 2 : minimum number of strips in EEMC SMD u-plane cluster around peak
- N_(5-strip cluster)^v > 2 : minimum number of strips in EEMC SMD v-plane cluster around peak
- gamma-algo fail : my algorithm failed to match tower with SMD uv-intersection, etc...
- Tow:SMD match : SMD uv-intersection has a tower which is not in a 3x3 cluster
- R_{3x3cluster}: Energy in 3x3 cluster of EEMC tower to the total jet energy (not applied here)
Figure 1: EEMC x vs. y position of photon candidate for 2008 data sample
Problem with pre-shower layer in Sector 10 can been seen in the upper left corner
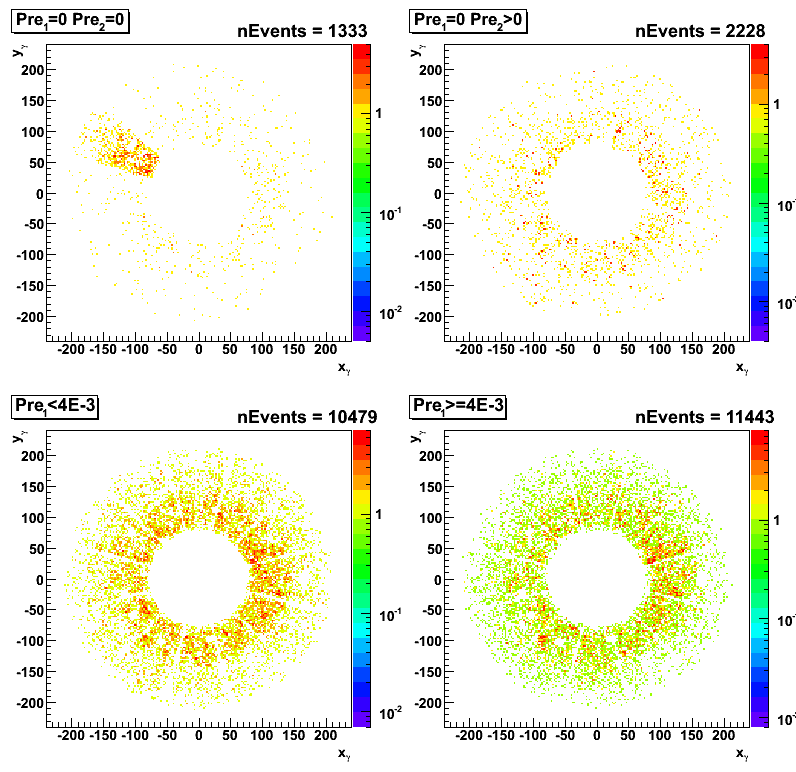
Figure 2: EEMC x vs. y position of photon candidate for 2006 data sample
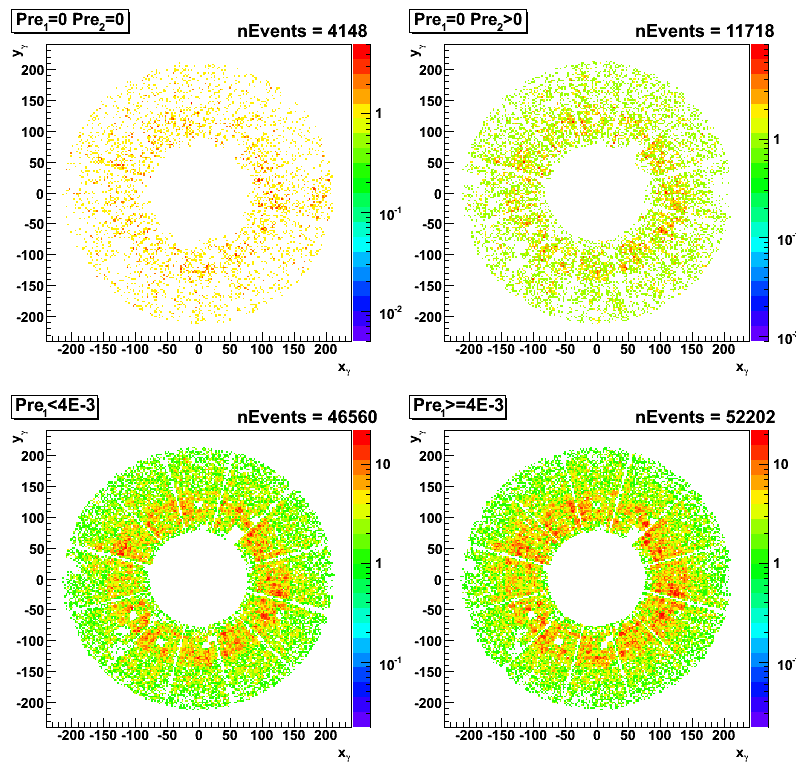
Figure 3: Average < E_pre1 * E_pre2 > for 3x3 cluster around high tower
vs run number for sectors 9, 10 and 11
Note, zero pre-shower energy for sector 10 (black points) for days 61, 62, 64, and 67.
All di-jet events for pp2008 data are shown (no gamma-jet cuts)
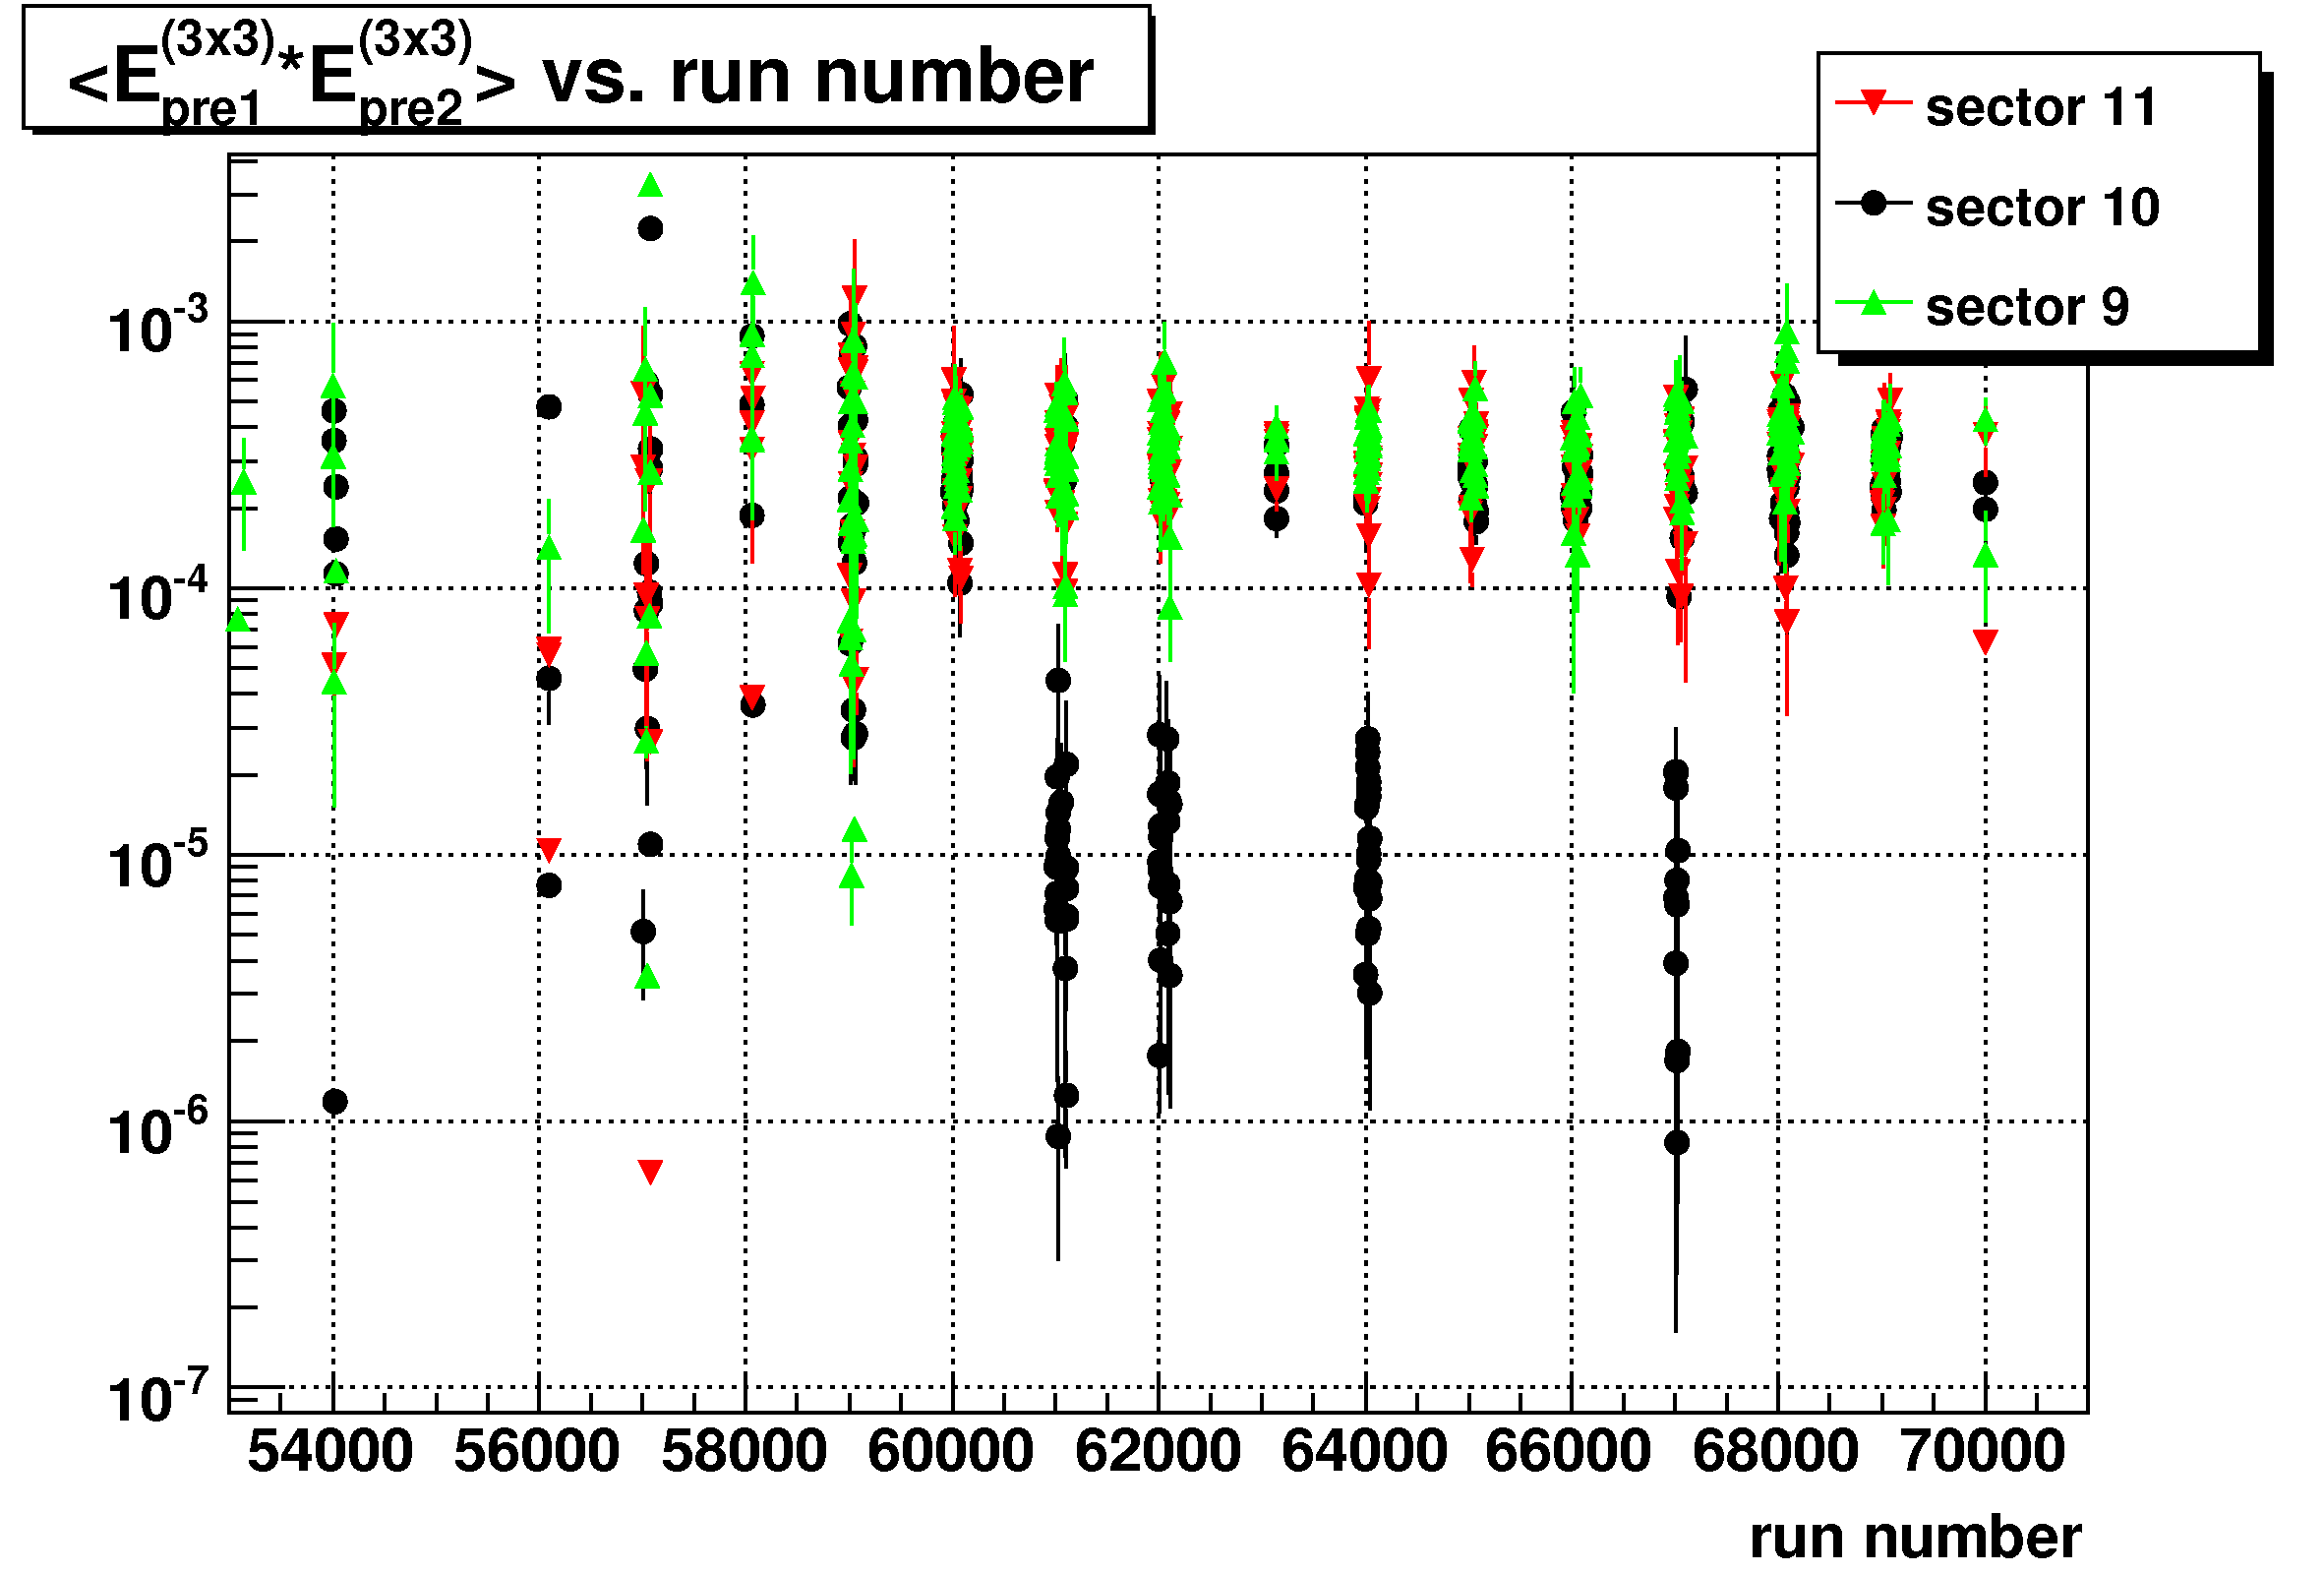
Figure 3a: Same as Fig.3, zoom into day 61
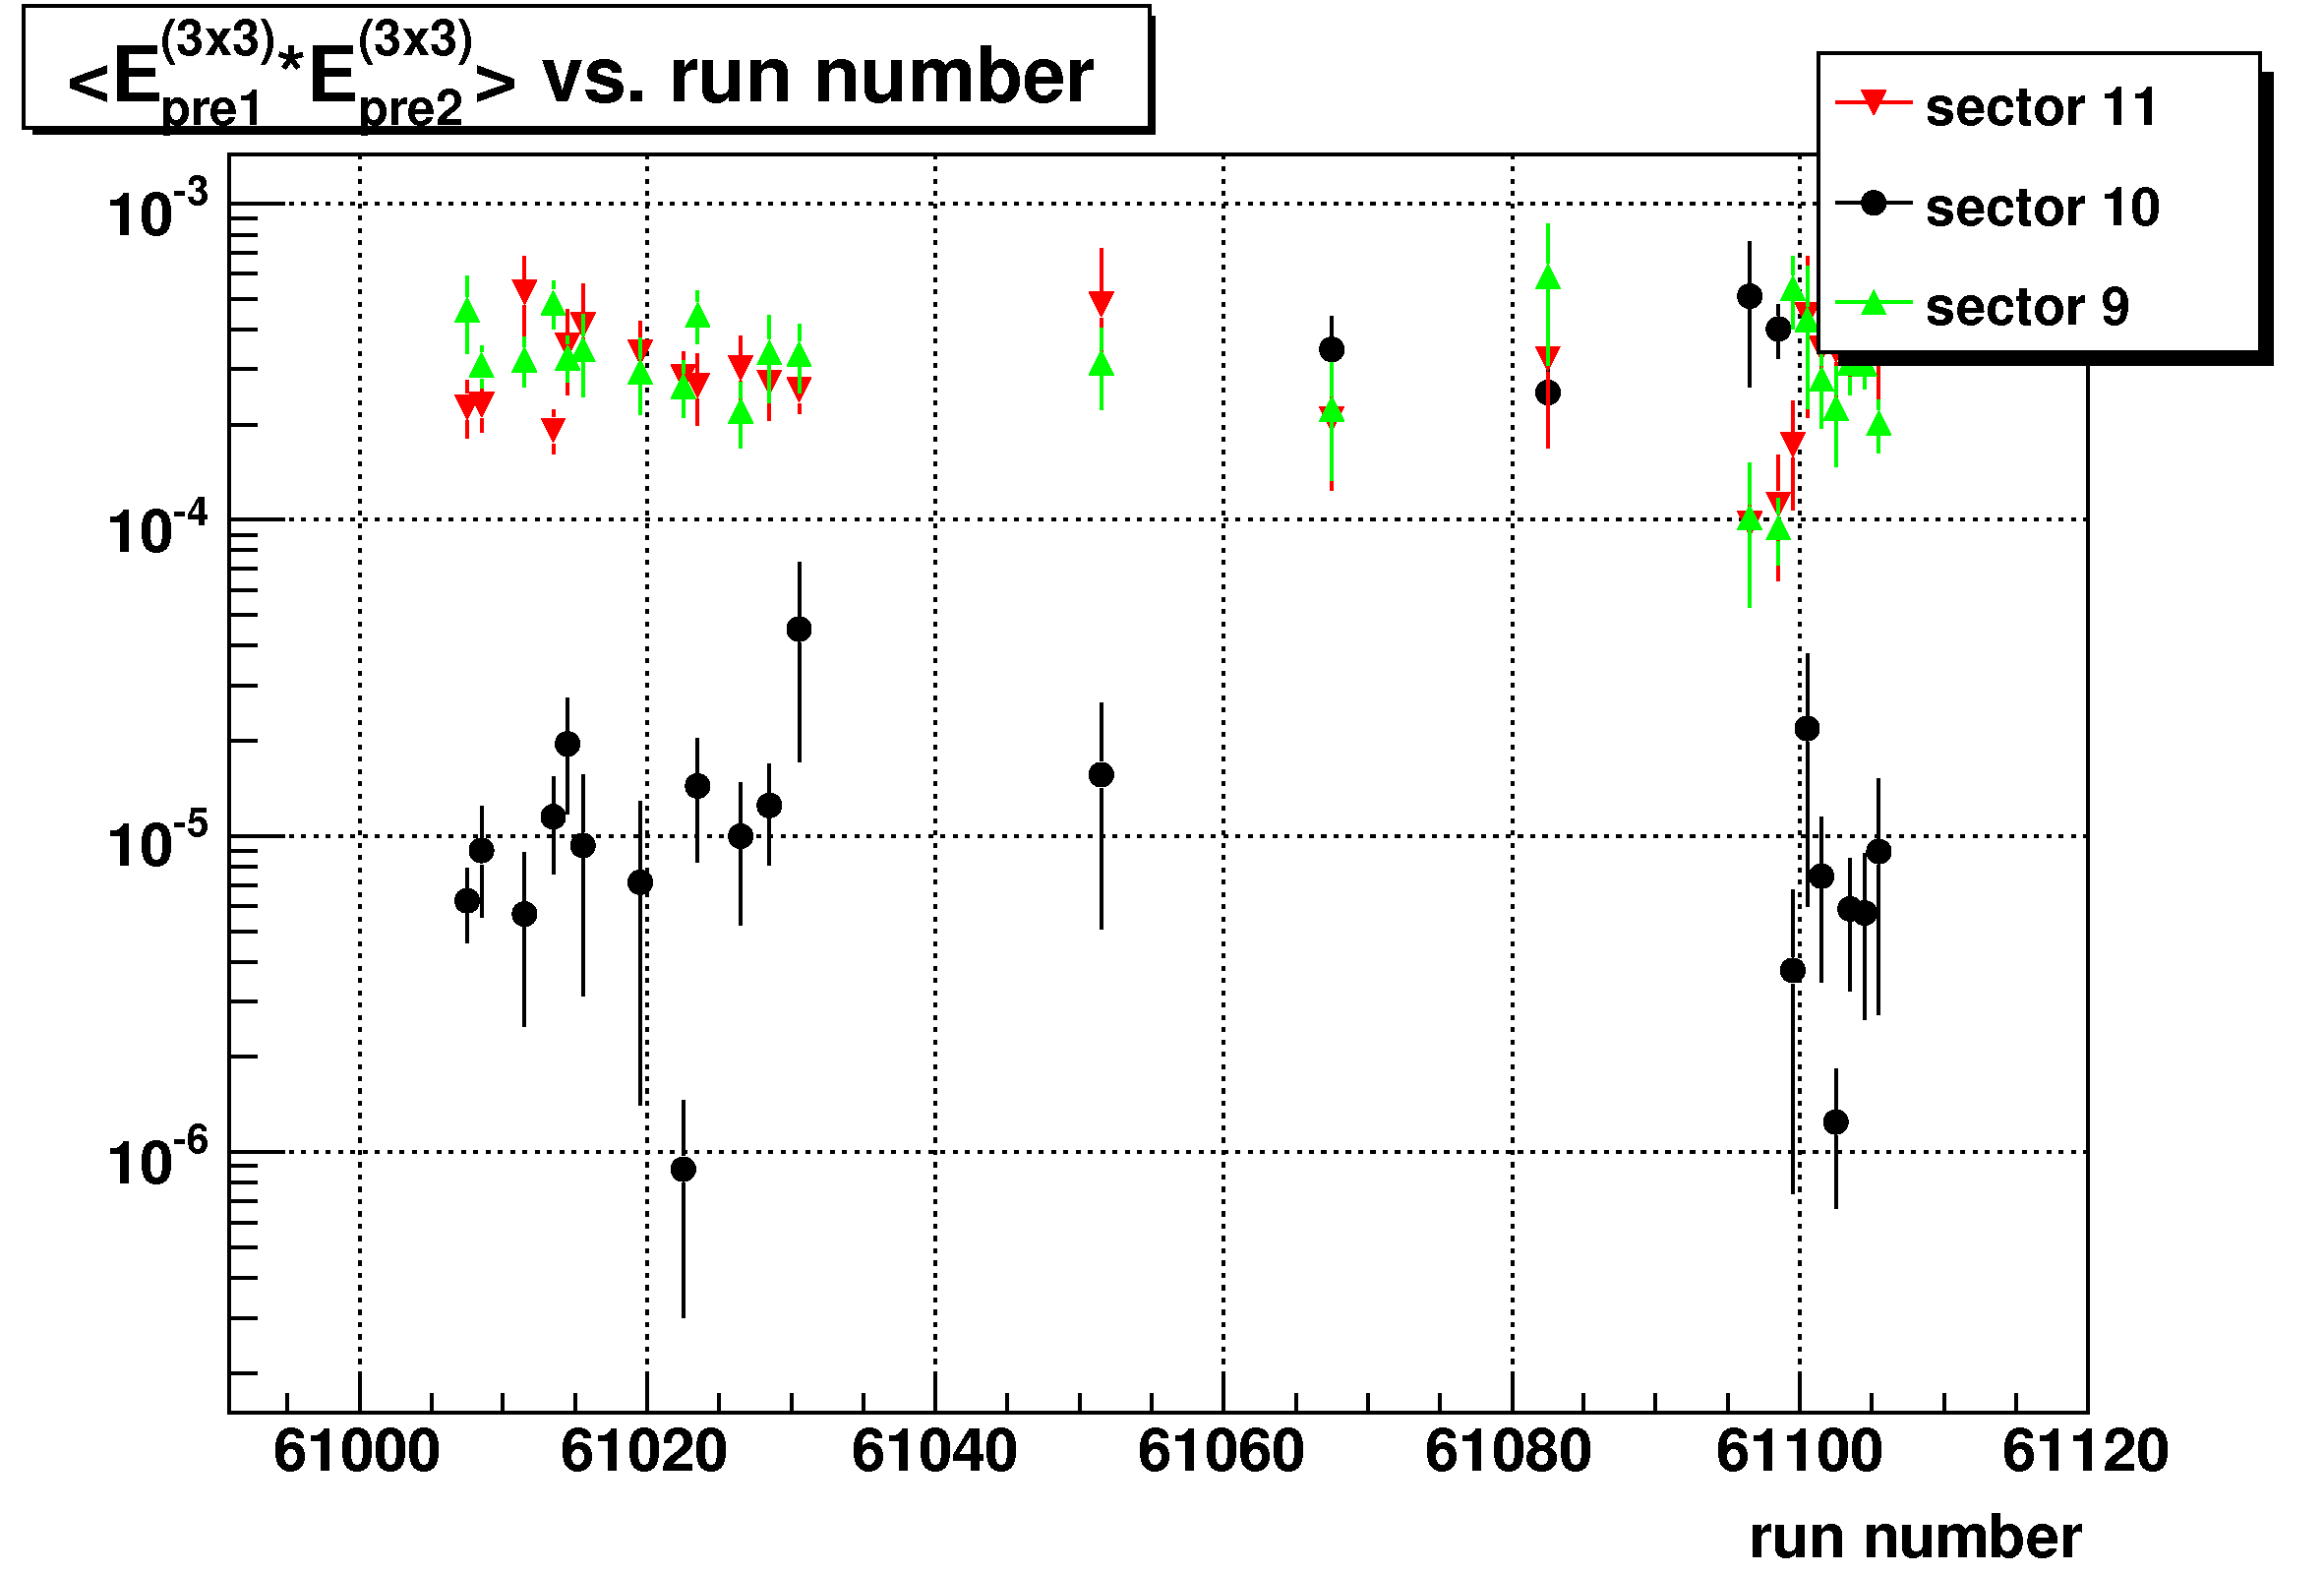
Figure 3b: Same as Fig.3, zoom into day 62
Figure 3c: Same as Fig.3, zoom into day 64
Figure 3d: Same as Fig.3, zoom into day 67
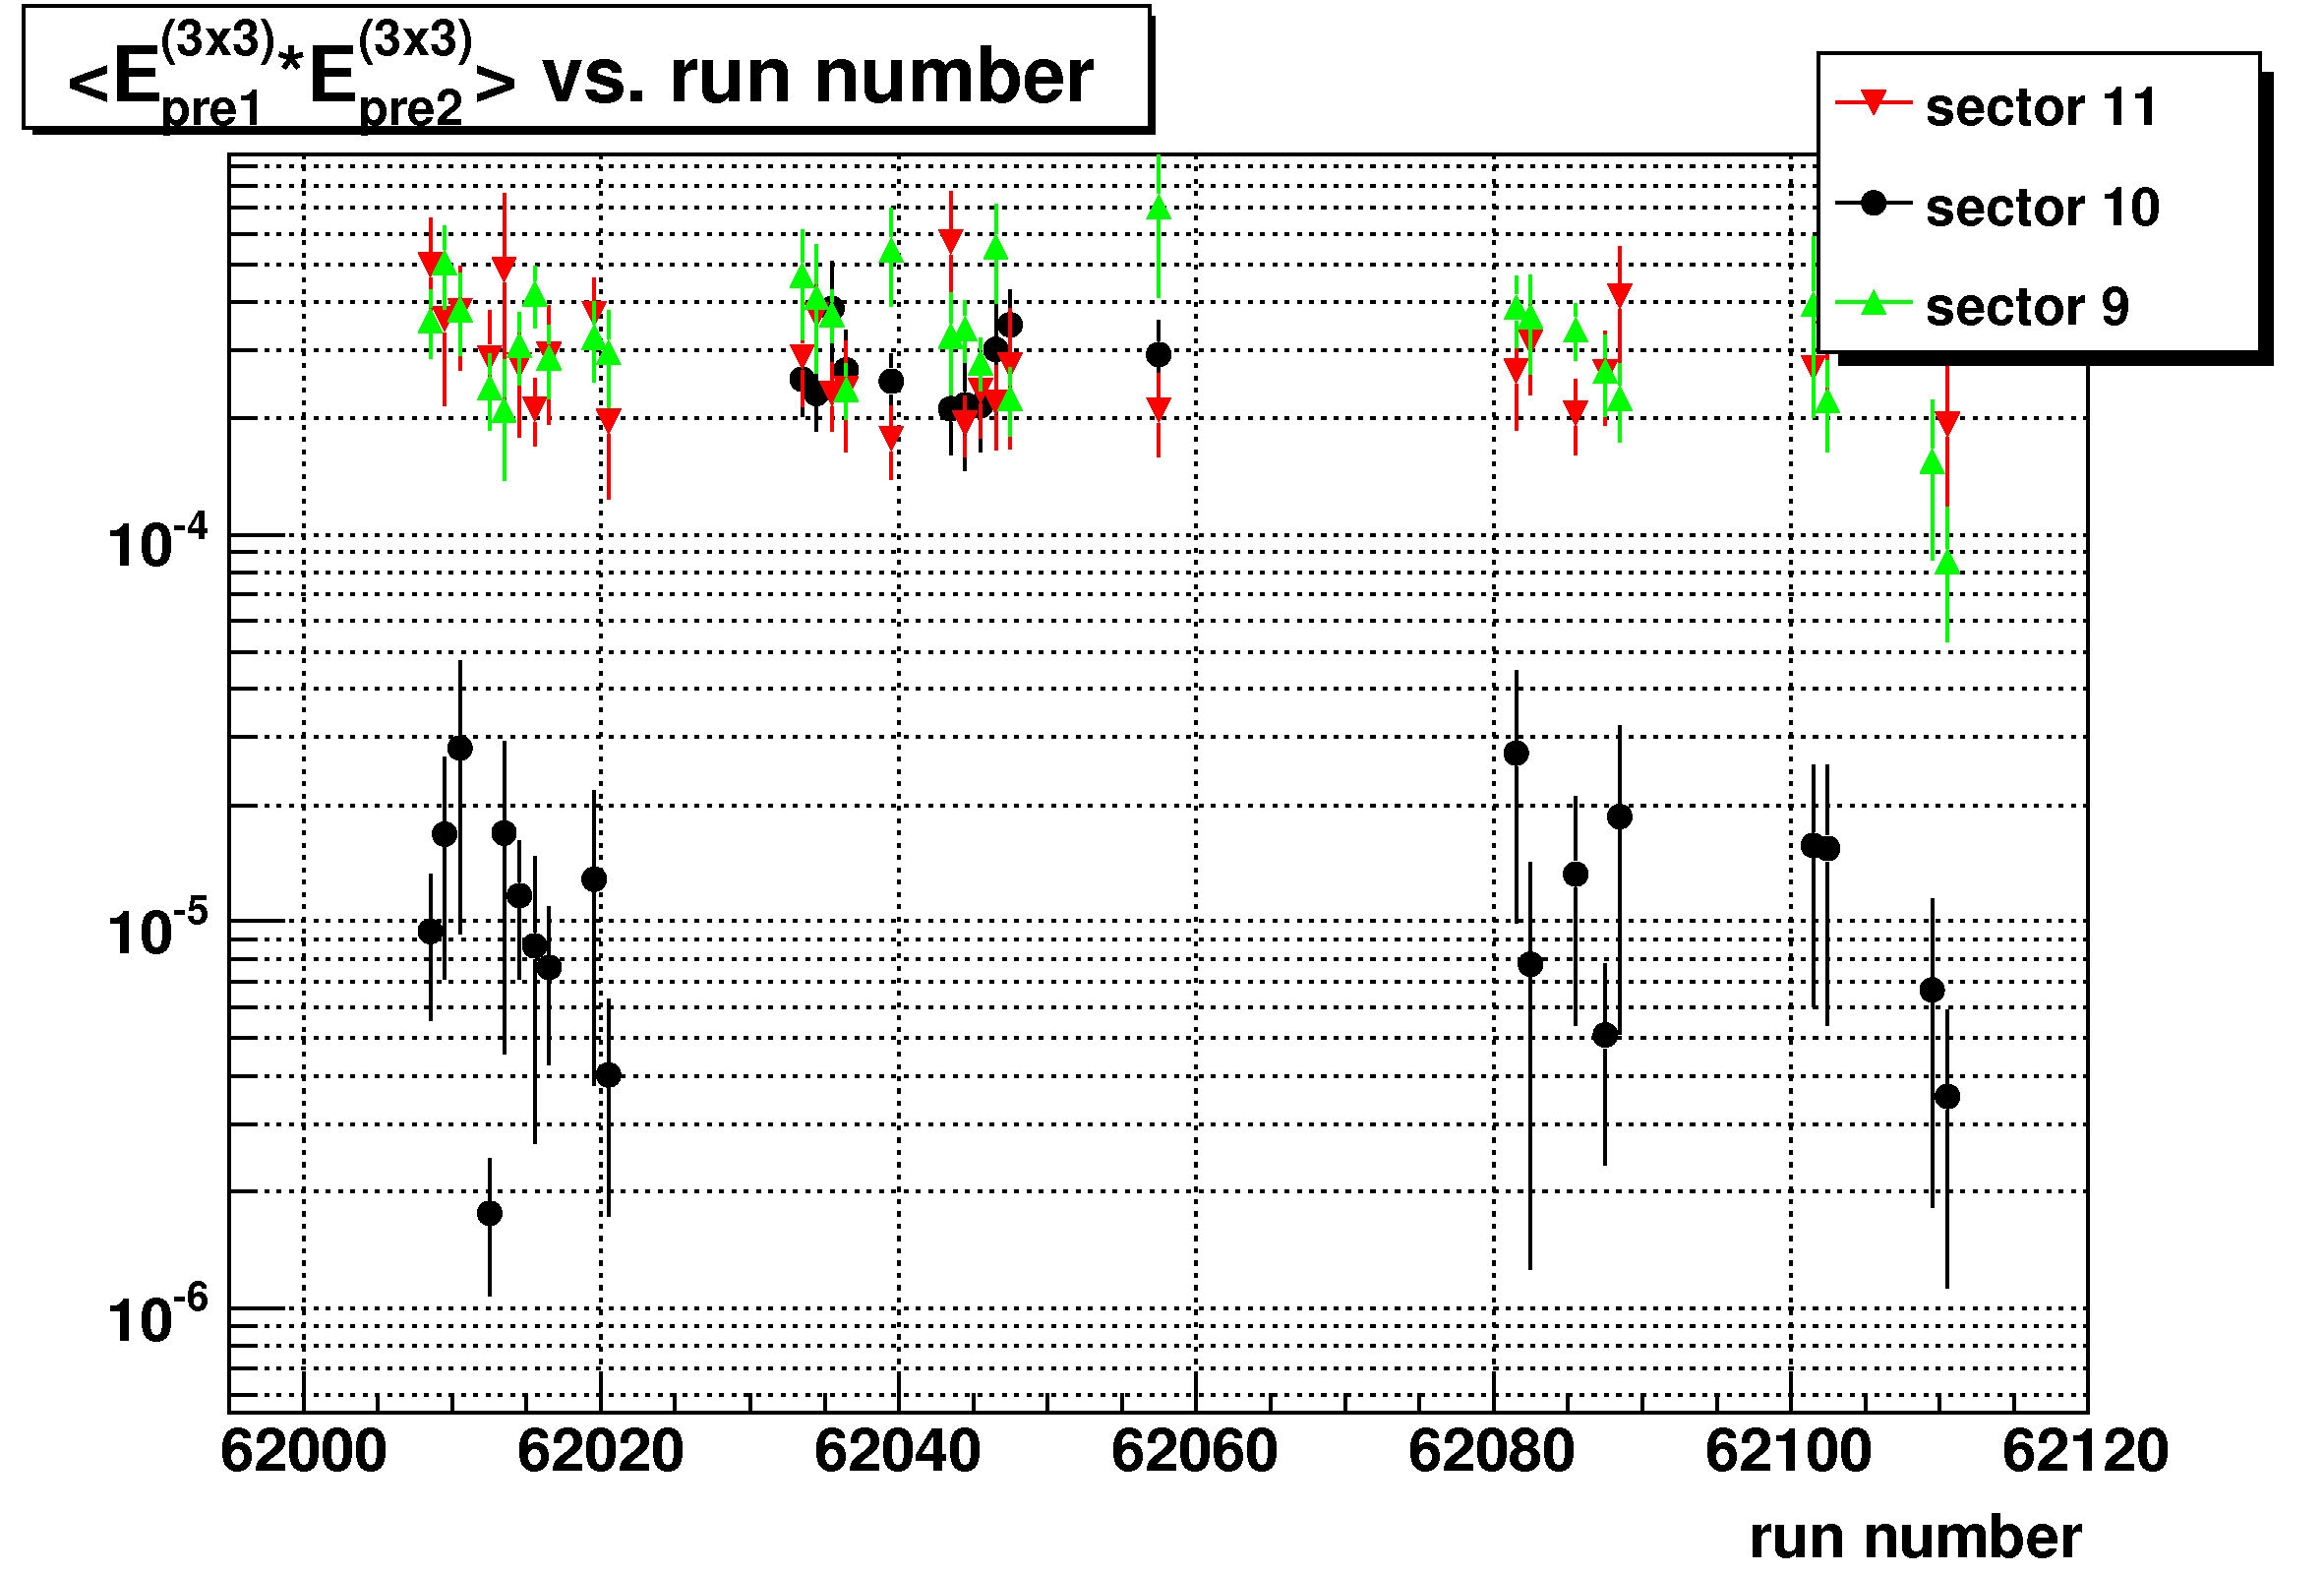
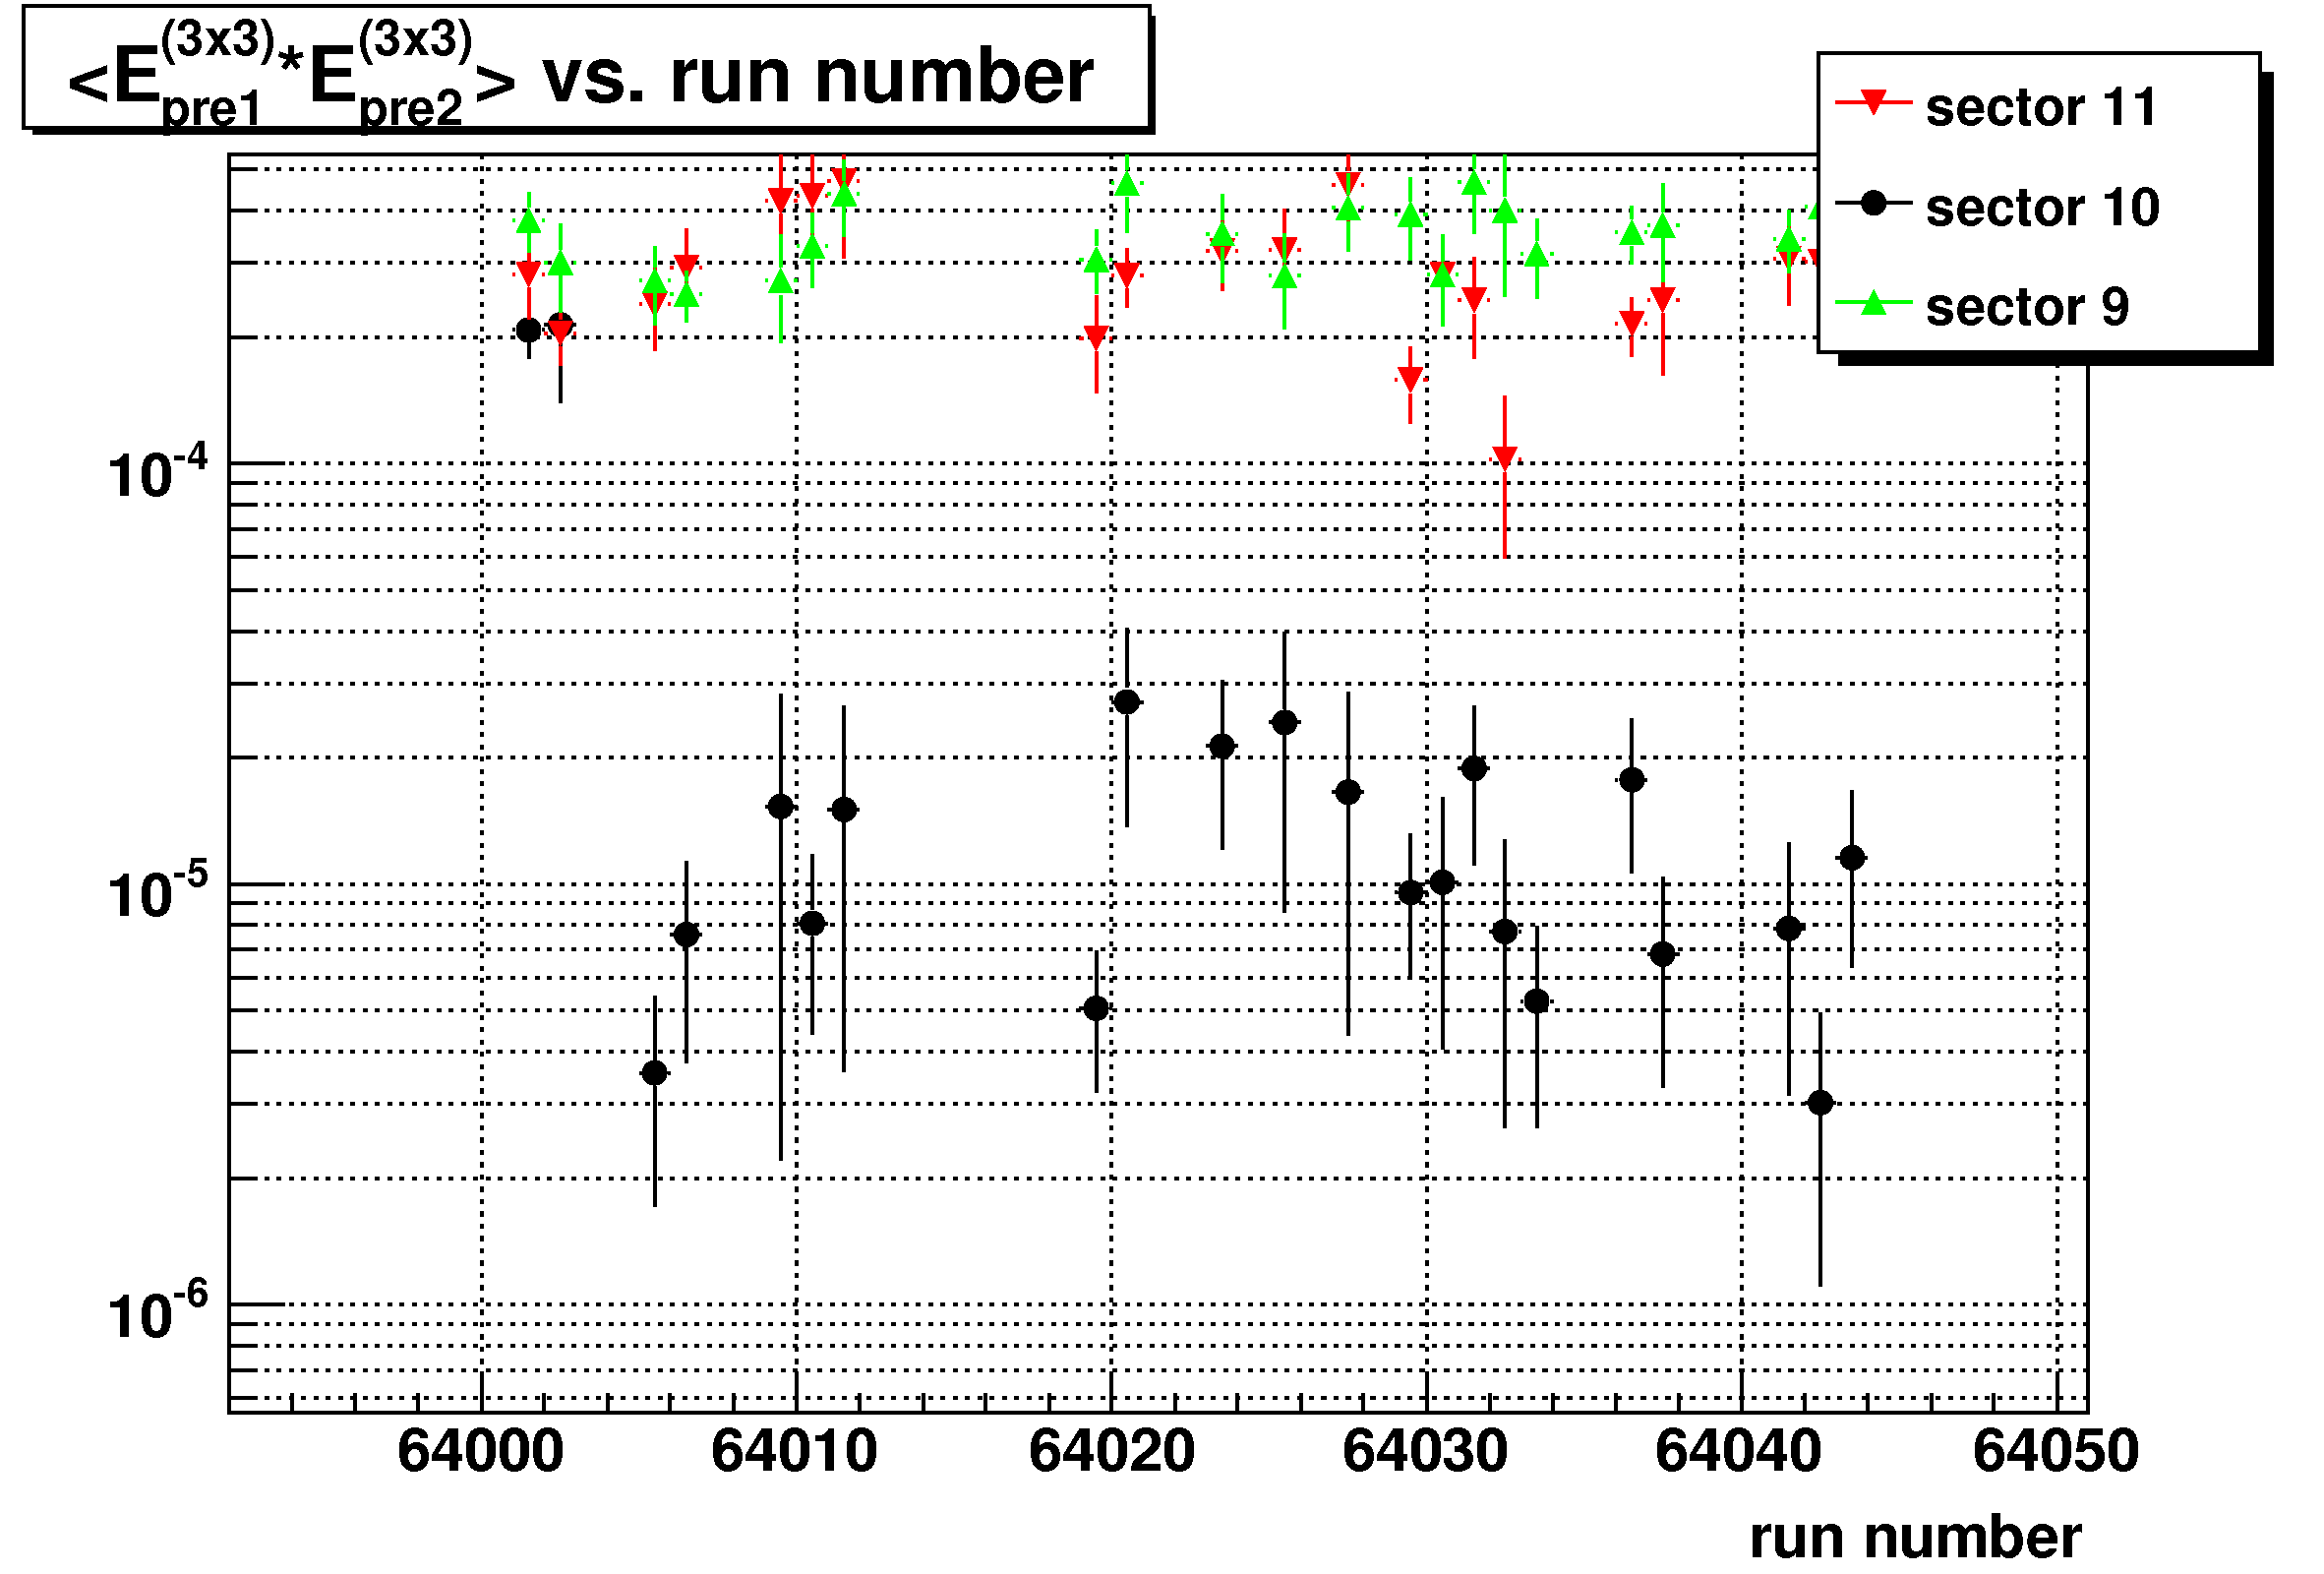
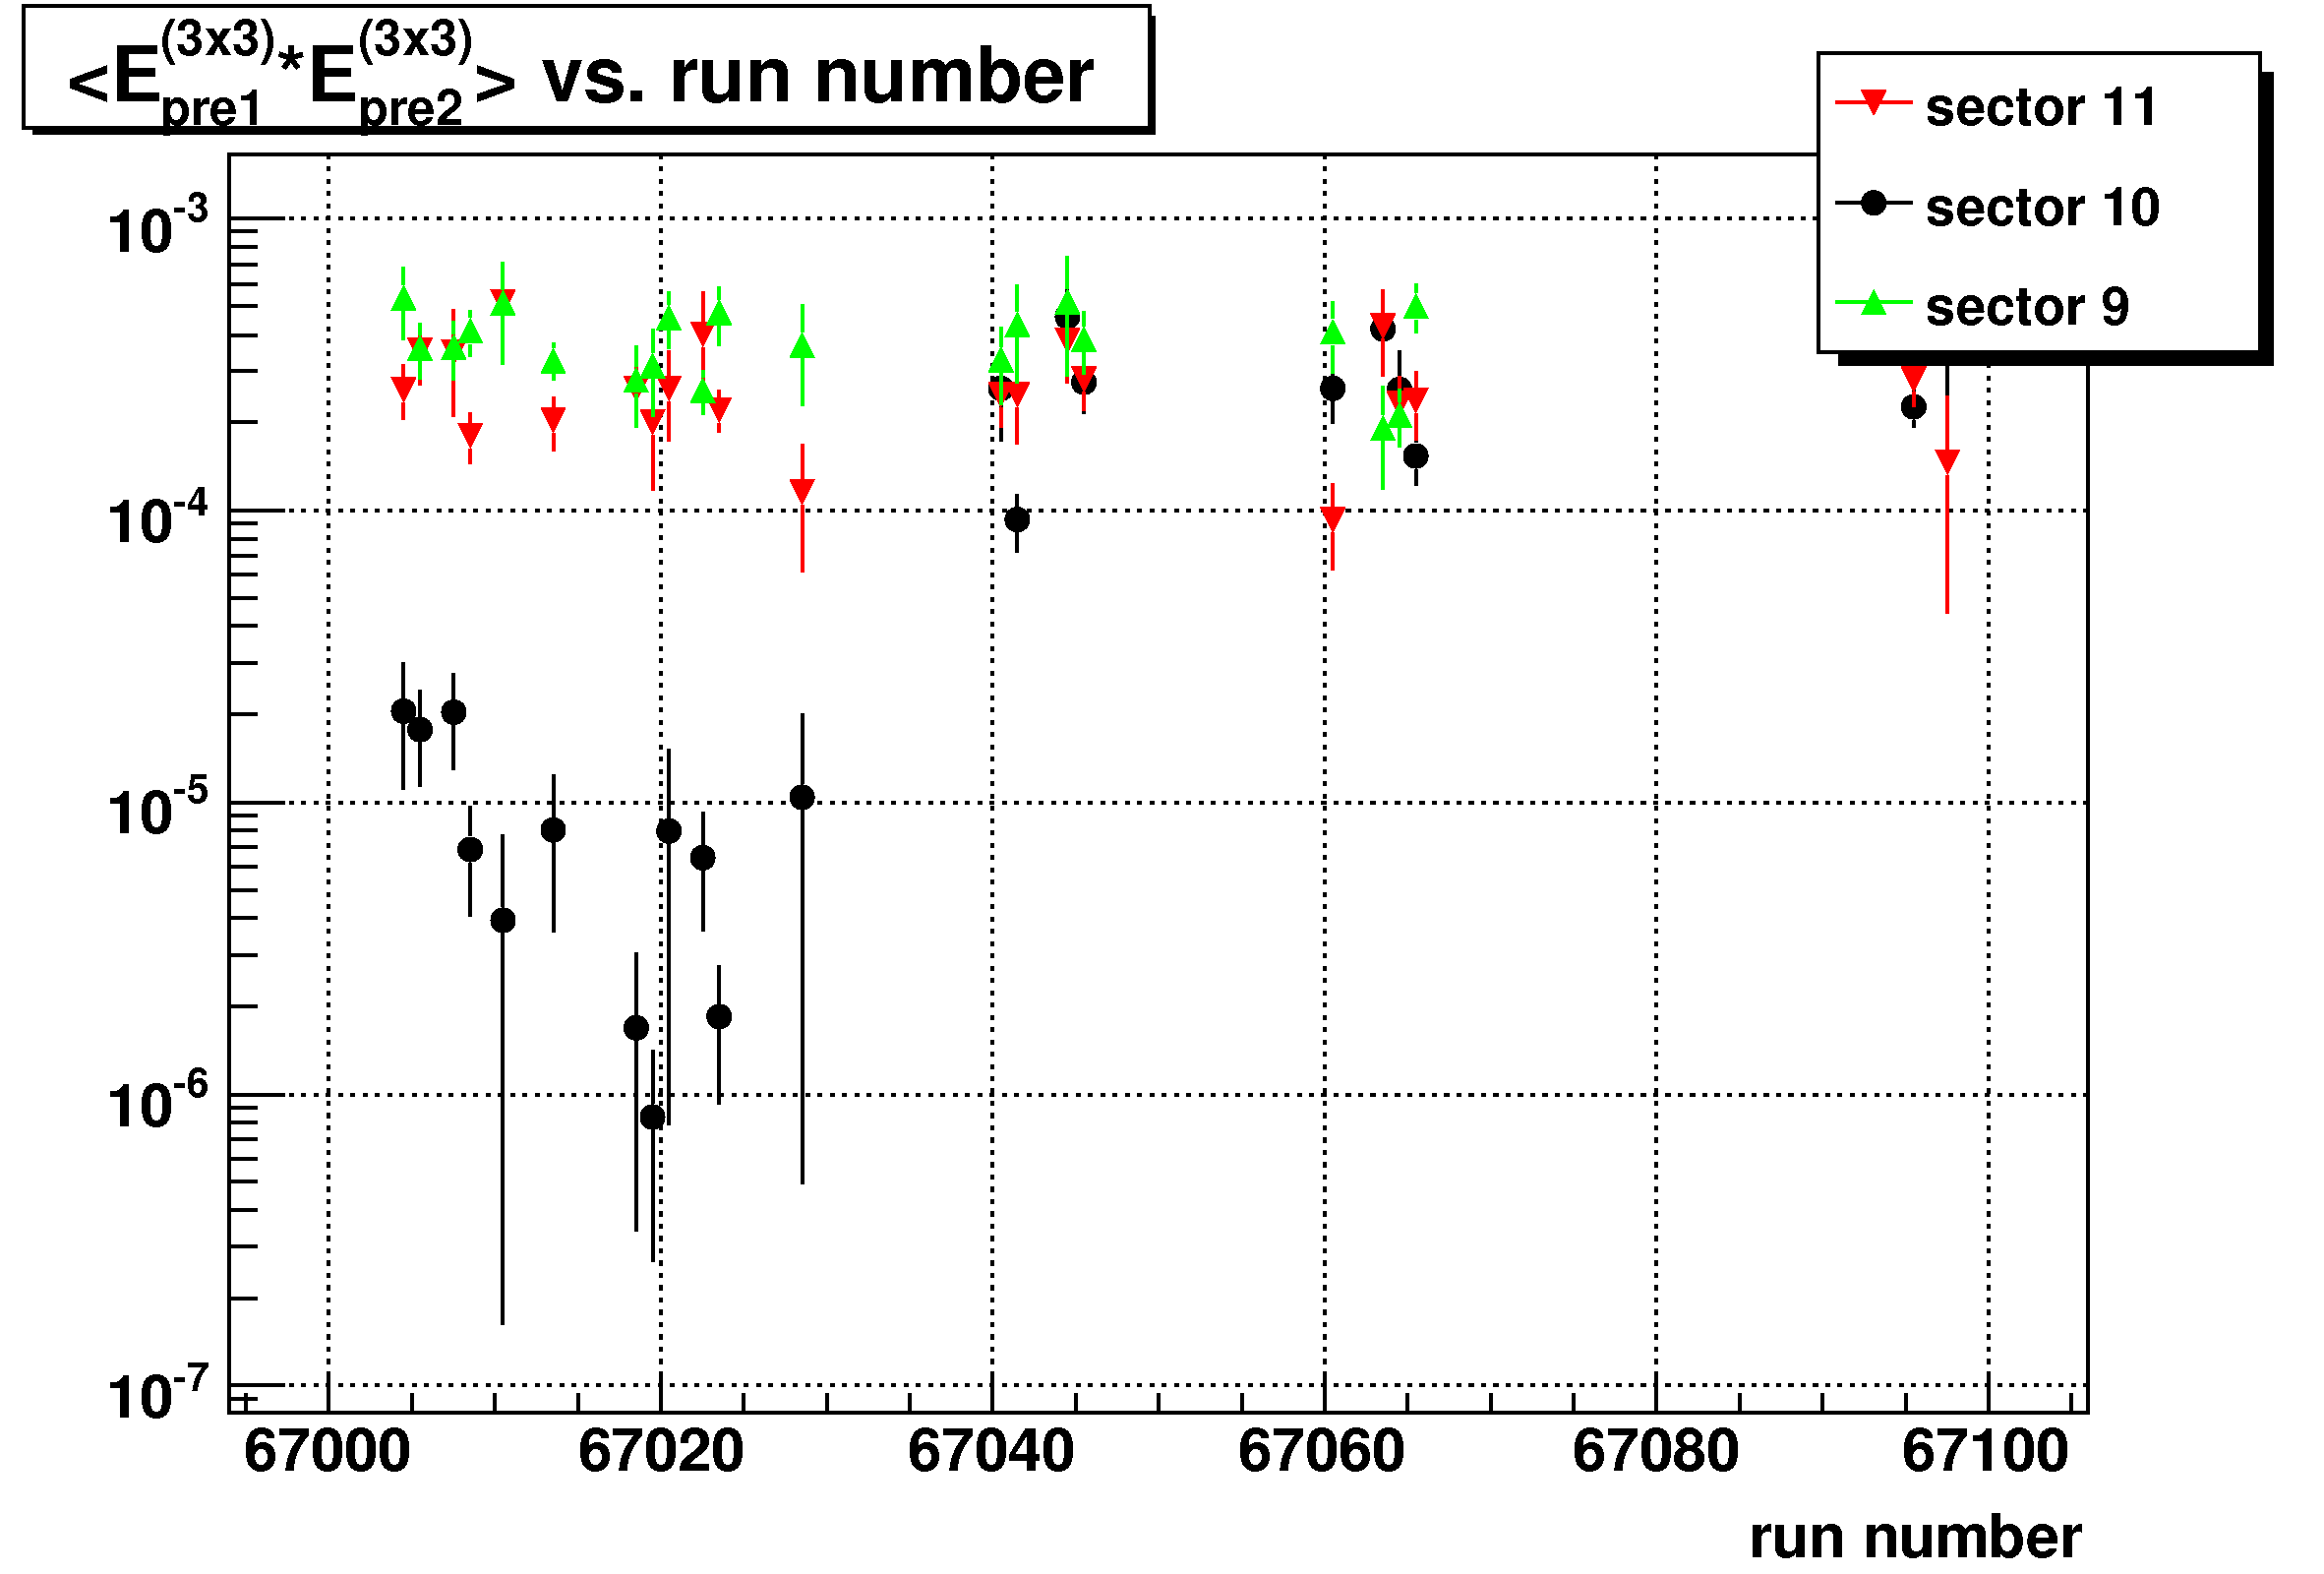
Figure 4: EEMC x vs. y position of photon candidate for 2008 data sample
Same as Fig. 1, but excluding days: 61, 62, 64, and 67
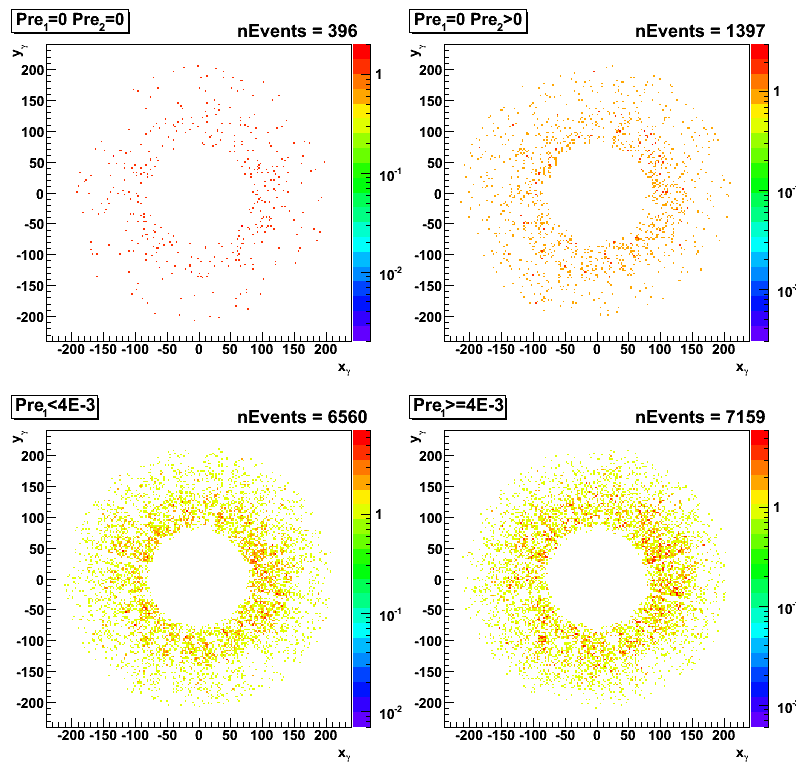
Conclusion on QA:
No problem with pp2008 data have been found,
except that for some runs (mostly on days 61, 62, 64, and 67)
EEMC pre-shower layer for sector 10 was off.
Comparison between 2006 and 2008 data
Figure 5: Vertex z distribution:
All gamma-jet cuts applied, plus pt_gamma>7 and pt_jet > 5 GeV (exlcuding days 61, 62, 64, and 67)
Results are shown for pp2008 data sample (black), vs. pp2006 data (red).
pp2008 data scaled to the same total number of candidates as in pp2006 data.
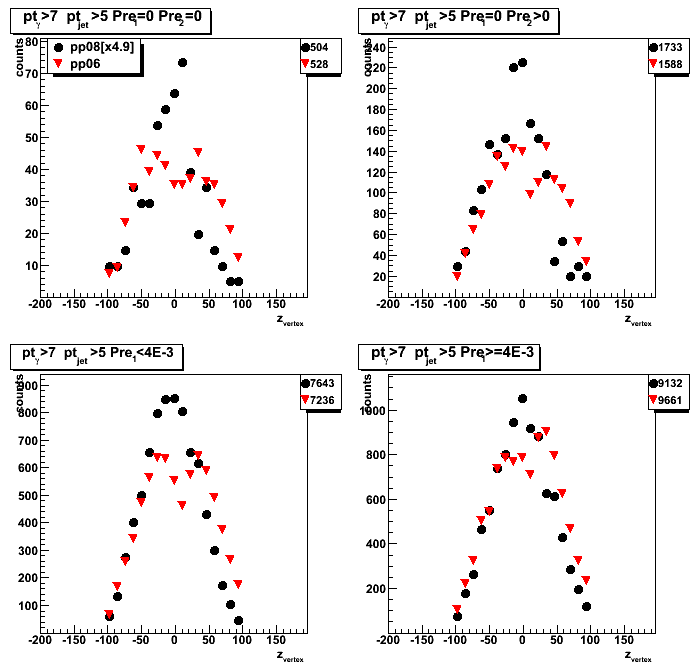
Figure 6: Shower shapes within +/- 30 strips from high strip (same cuts as in Fig. 5):

Figure 7: Shower shapes within +/- 5 strips from high strip
(same cuts as in Fig. 5, no scaling):
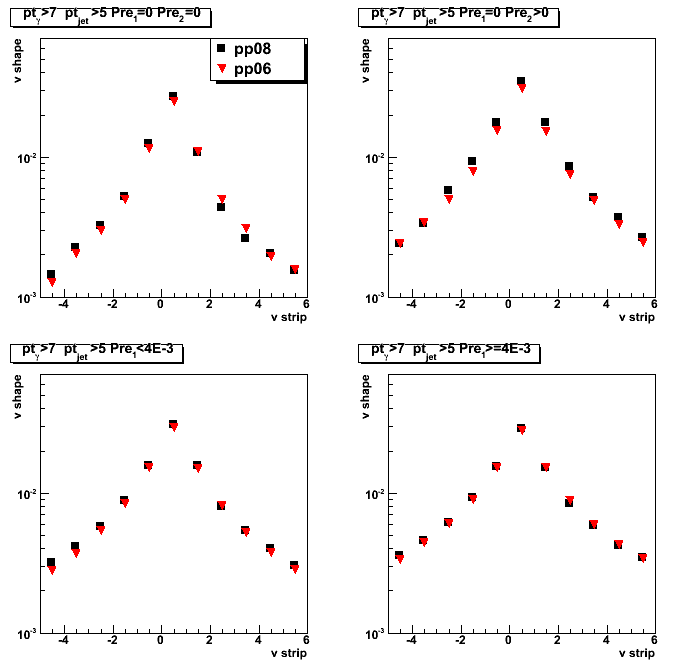
2008.12.09 pp Run 8 vs. Run 6 SMD shower shapes
Ilya Selyuzhenkov December 09, 2008
Data sets:
- pp2006 - STAR 2006 pp longitudinal data (~ 3.164 pb^1)
Trigger: eemc-http-mb-L2gamma [id:137641] - pp2008 - STAR 2008 pp data
Trigger: etot-mb-l2 [id:7]
Days: 53-70; ~0.5M triggered events (1/3 of available statistics)
Gamma-jet analysis cuts:
- Select only di-jet events
- cos(phi_gamma - phi_jet) < -0.8 : gamma-jet opposite in phi
- R_EM^jet < 0.9 : neutral energy fraction cut for the away side jet
- N_ch=0 : no charge tracks associated with a gamma candidate
- N_bTow = 0 : no barrel towers associated with a gamma candidate (gamma in the endcap)
- N_(5-strip cluster)^u > 2 : minimum number of strips in EEMC SMD u-plane cluster around peak
- N_(5-strip cluster)^v > 2 : minimum number of strips in EEMC SMD v-plane cluster around peak
- gamma-algo fail : my algorithm failed to match tower with SMD uv-intersection, etc...
- Tow:SMD match : SMD uv-intersection has a tower which is not in a 3x3 cluster
- R_{3x3cluster}: Energy in 3x3 cluster of EEMC tower to the total jet energy (not applied here)
Comparison between 2006 and 2008 data
Figure 1: Vertex z distribution:
All gamma-jet cuts applied, plus pt_gamma>7 and pt_jet > 5 GeV (exlcuding days 61, 62, 64, and 67)
Results are shown for pp2008 data sample (black), vs. pp2006 data (red).
pp2008 data scaled to the same total number of candidates as in pp2006 data.
Figure 2: Shower shapes within +/- 30 strips from high strip (same cuts as in Fig. 1):
Figure 3: Shower shapes within +/- 5 strips from high strip
(same cuts as in Fig. 1, no scaling):
Conclusion:
2008.12.09 pp Run 8 vs. Run 6 shower shapes
Ilya Selyuzhenkov December 09, 2008
Data sets:
- pp2006 - STAR 2006 pp longitudinal data (~ 3.164 pb^1)
Trigger: eemc-http-mb-L2gamma [id:137641] - pp2008 - STAR 2008 pp data
Trigger: etot-mb-l2 [id:7]
Days: 53-70; ~0.5M triggered events (1/3 of available statistics)
Gamma-jet analysis cuts:
- Select only di-jet events
- cos(phi_gamma - phi_jet) < -0.8 : gamma-jet opposite in phi
- R_EM^jet < 0.9 : neutral energy fraction cut for the away side jet
- N_ch=0 : no charge tracks associated with a gamma candidate
- N_bTow = 0 : no barrel towers associated with a gamma candidate (gamma in the endcap)
- N_(5-strip cluster)^u > 2 : minimum number of strips in EEMC SMD u-plane cluster around peak
- N_(5-strip cluster)^v > 2 : minimum number of strips in EEMC SMD v-plane cluster around peak
- gamma-algo fail : my algorithm failed to match tower with SMD uv-intersection, etc...
- Tow:SMD match : SMD uv-intersection has a tower which is not in a 3x3 cluster
- R_{3x3cluster}: Energy in 3x3 cluster of EEMC tower to the total jet energy (not applied here)
Comparison between 2006 and 2008 data
Figure 1: Vertex z distribution:
All gamma-jet cuts applied, plus pt_gamma>7 and pt_jet > 5 GeV (exlcuding days 61, 62, 64, and 67)
Results are shown for pp2008 data sample (black), vs. pp2006 data (red).
pp2008 data scaled to the same total number of candidates as in pp2006 data.
Figure 2: Shower shapes within +/- 30 strips from high strip (same cuts as in Fig. 1):
Figure 3: Shower shapes within +/- 5 strips from high strip
(same cuts as in Fig. 1, no scaling):
2008.12.11 Run 8 EEMC QA (presentation for Spin PWG)
Ilya Selyuzhenkov December 11, 2008
Run 8 QA with EEMC gamma-jet candidates
Presentation in pdf or open office file format
2008.12.16 Effect of L2gamma trigger in simulations
Ilya Selyuzhenkov December 16, 2008
Data sets
- pp2006 - STAR 2006 pp longitudinal data (~ 3.164 pb^1)
Trigger: eemc-http-mb-L2gamma [id:137641] - gamma-jet[gamma-filtered] - data-driven Prompt Photon [p6410EemcGammaFilter] events.
Partonic pt range 2-25 GeV. - QCD jets[gamma-filtered] - data-driven QCD [p6410EemcGammaFilter] events.
Partonic pt range 2-25 GeV.
Cuts applied
Gamma-jet isolation cuts except 3x3/r=0.7 energy isolation cut
Data driven shower shape replacement maker fix
Figure 1: (reproducing old results with dd-maker fix)
transverse momentum and vertex z distributions
before (with ideal gains/pedestals) and
after (with realistic gains/pedestal tables) dd-maker fix are in a good agreement.
For details on "dd-maker problem", read these hyper news threads:
emc2:2905, emc2:2900, and phana:294
Now we can run L2gamma trigger emulation and Eemc SMD ddMaker
in the same analysis chain.
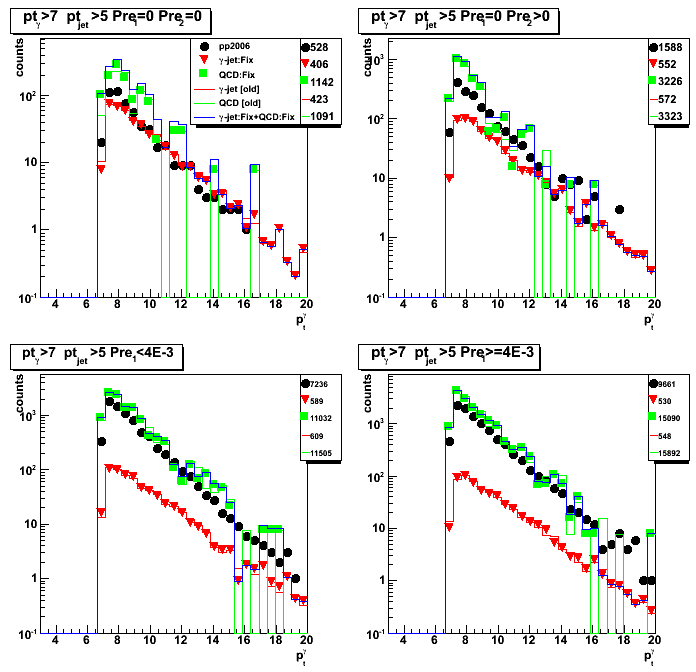
l2-gamma trigger effect in simulation
Figure 2: Vertex z distribution with and without trigger condition in simulations
(emulated trigger: eemc-http-mb-L2gamma [id:137641]).
Solid red/green symbols show results with l2gamma condition applied,
while red/green lines show results for the same analysis cuts but without trigger condition.
Note, good agreement between MC QCD jets with trigger condition on (green solid squared)
and pp2006 data (black solid circles) for pre-shower1>0 case.

Figure 3: pt distribution with/without trigger condition in simulations.
Same color coding as in Fig. 2
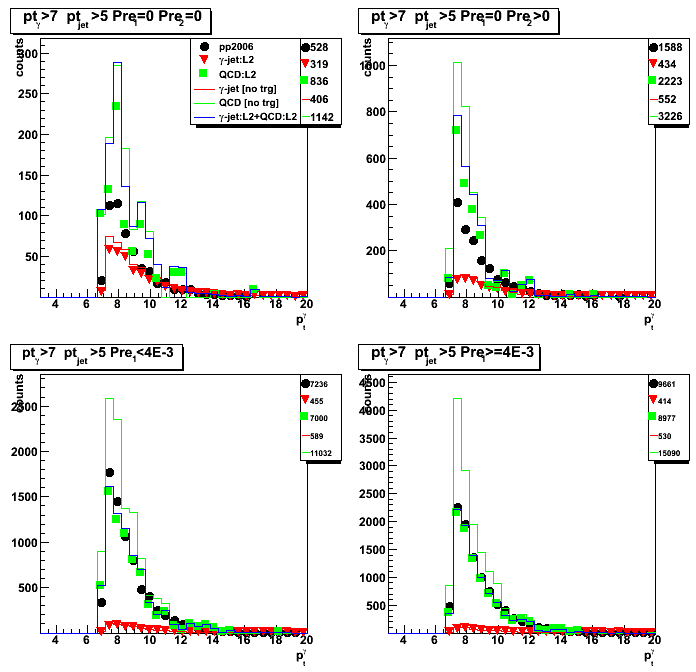
Figure 4: Same as Fig. 3 just on a log scale
One can clearly see large trigger effect when applied for QCD jet events,
and a little effect for direct gammas.

Figure 5: gamma candidate pt QCD (right) and prompt photon (left) Monte-Carlo:
no (upper) with (lower) L2e-gamma trigger condition
No photon pt and no jet pt cuts
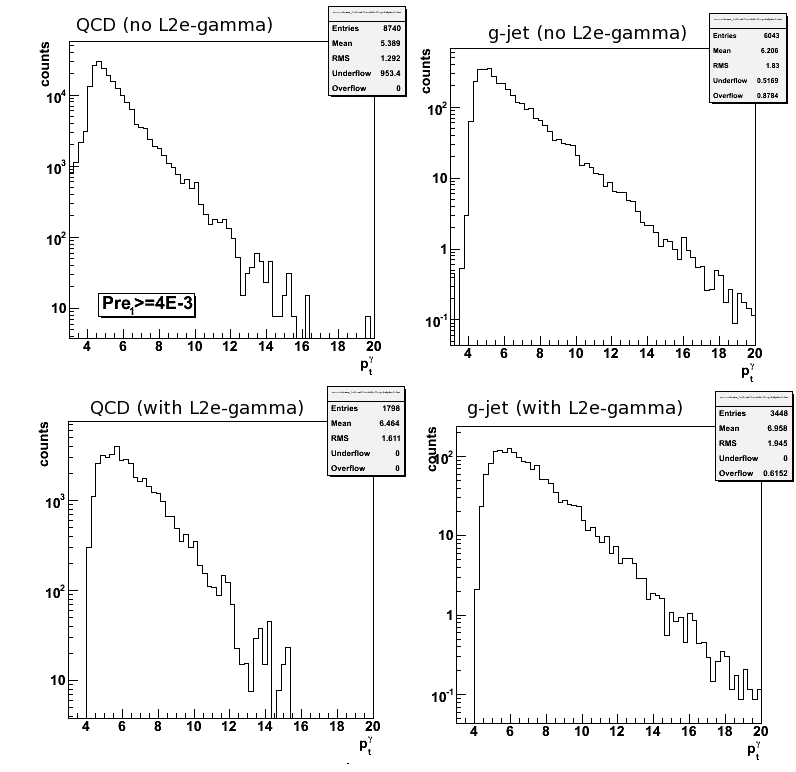
Figure 6: gamma candidate pt for QCD Monte-Carlo: no L2e-gamma trigger condition
No photon pt and no jet pt cuts
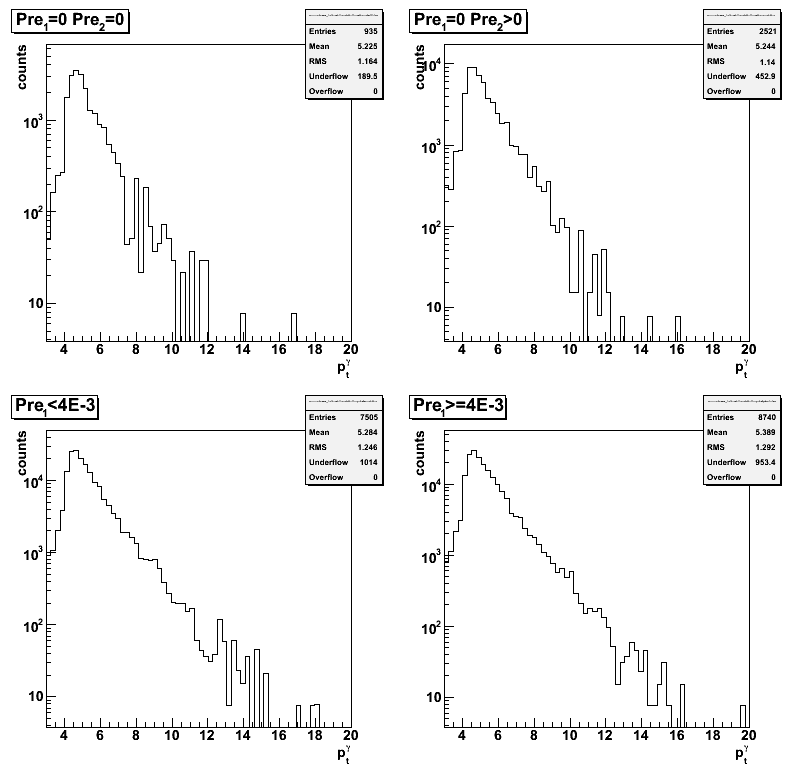
Figure 7: gamma candidate pt for QCD Monte-Carlo: L2e-gamma trigger condition applied (id:137641)
No photon pt and no jet pt cuts

2008.12.19 Parton pt distribution for Pythia QCD and gamma-jet events
Ilya Selyuzhenkov December 19, 2008
Data sets
- gamma-jet[gamma-filtered] - data-driven Prompt Photon [p6410EemcGammaFilter] events.
Partonic pt range 2-25 GeV. - QCD jets[gamma-filtered] - data-driven QCD [p6410EemcGammaFilter] events.
Partonic pt range 2-25 GeV.
Cuts applied
Gamma-jet isolation cuts except 3x3/r=0.7 energy isolation cut
Figure 1: Parton pt distibution for gamma-jet candidates from Pythia QCD sample
with various pt and l2gamma trigger conditions
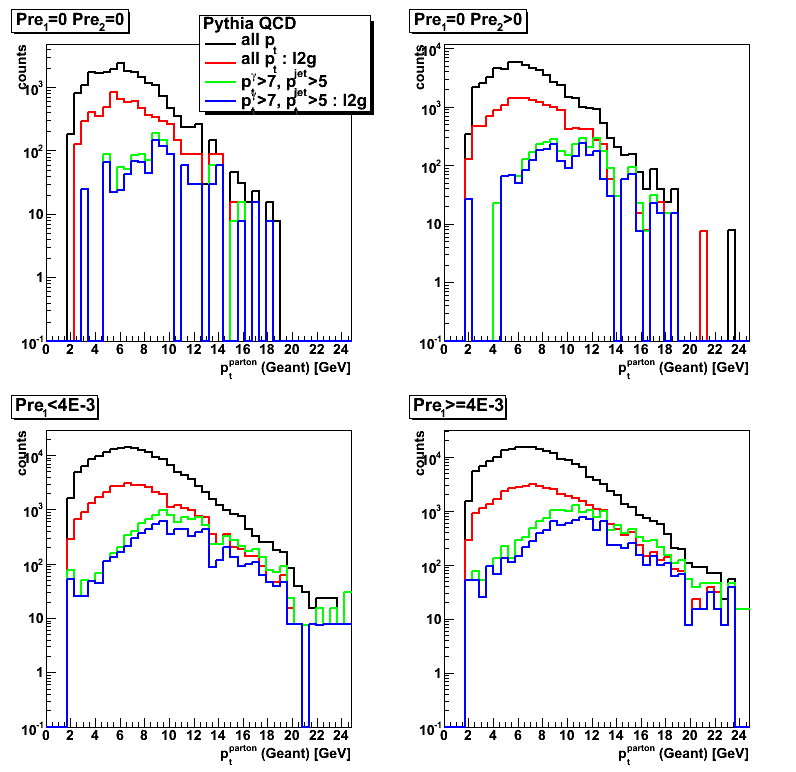
Figure 2: Parton pt distibution for gamma-jet candidates from Pythia prompt photon sample
with various pt and l2gamma trigger conditions
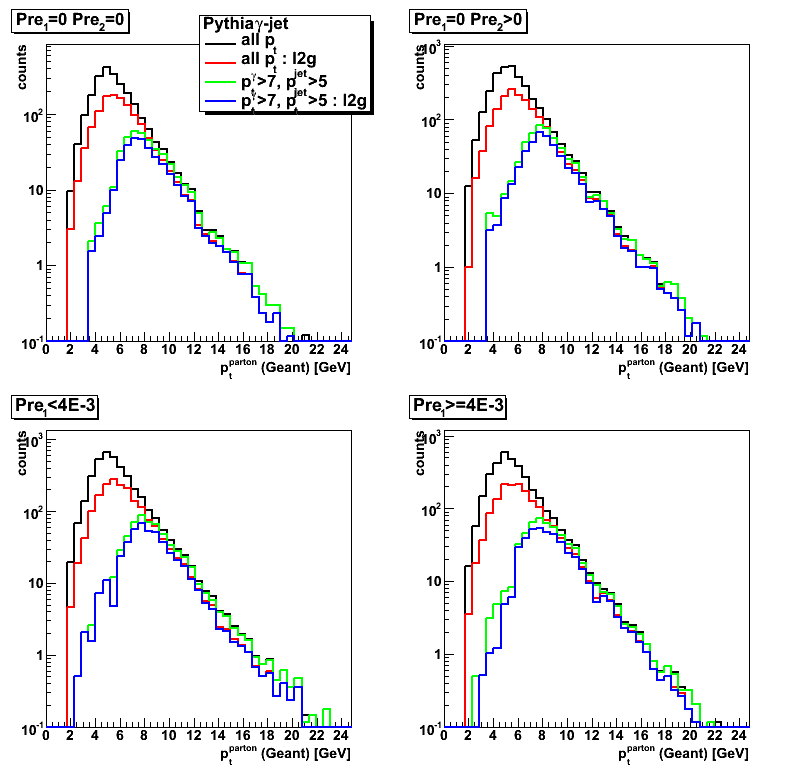
2009
Year 2009 posts
01 Jan
January 2009 posts
2009.01.08 Away side jet pt vs. photon pt
Ilya Selyuzhenkov January 08, 2009
Data sets
- pp2006 - STAR 2006 pp longitudinal data (~ 3.164 pb^1)
Trigger: eemc-http-mb-L2gamma [id:137641] - gamma-jet[gamma-filtered] - data-driven Prompt Photon [p6410EemcGammaFilter] events.
Partonic pt range 2-25 GeV. - QCD jets[gamma-filtered] - data-driven QCD [p6410EemcGammaFilter] events.
Partonic pt range 2-25 GeV.
Cuts applied
- Di-jet events
- Require to reconstruct photon momentum (no gamma-jet isolation cuts)
- Gamma pt > 7GeV
- L2gamma emulation in Monte-Carlo
- L2gamma triggered pp2006 events
Comments
(concentrated on pre-shower1>0 case
which has better statistics for QCD Monte-Carlo):
- Fig.1, lower plots
Vertex z distributions from QCD MC and pp2006 data are different in the negative region - Fig.2, lower plots
For the away side jet pt < 8GeV region
QCD Monte-Carlo underestimates the data. - Fig.4, lower plots
gamma-jet pt asymmetry plot shows
that in QCD MC photon and jet pt's are better correlated than in the data - Fig.5, lower plots
Most of the differences between QCD MC and pp2006 data for pre-shower1>0 case
are probably from the lower gamma and jet pt region
Figures
Figure 1: Vertex z distribution
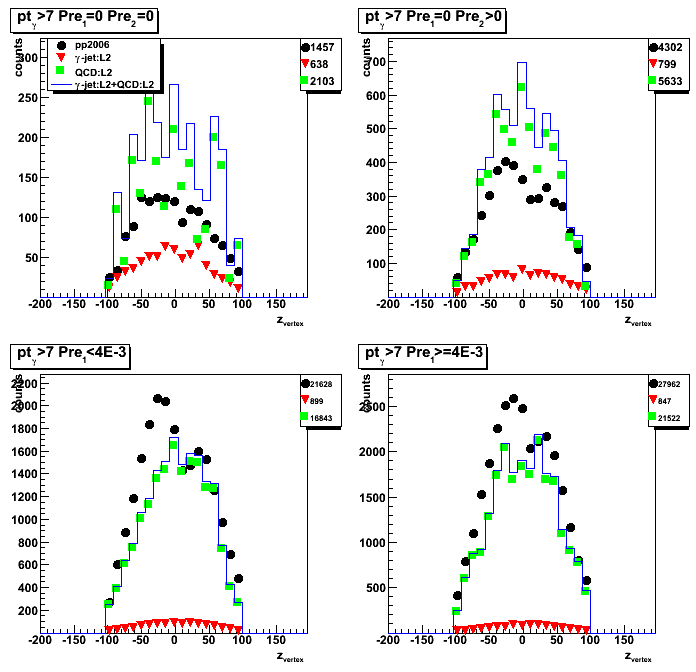
Figure 2: Away side jet pt
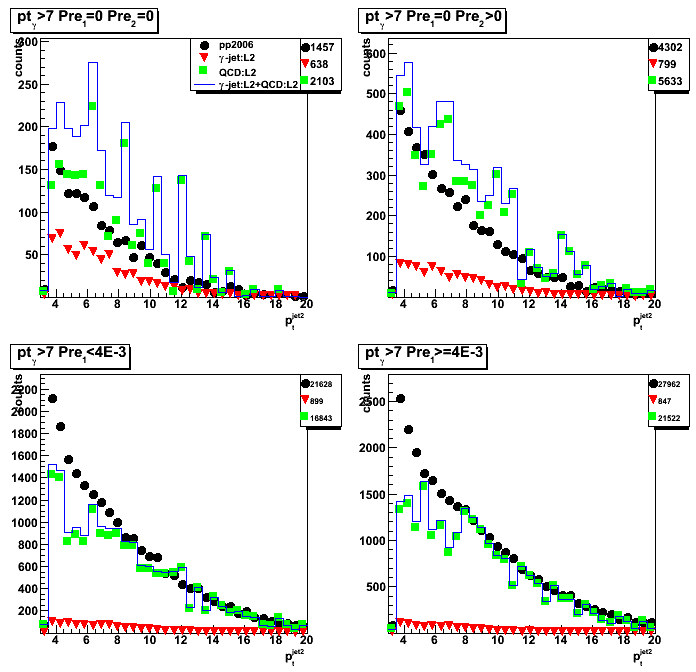
Figure 3: Photon pt
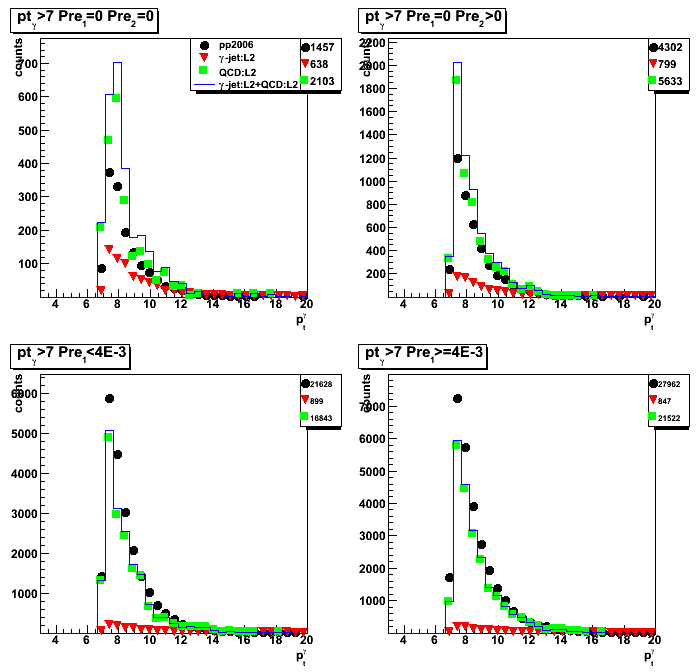
Figure 4: gamma-jet pt asymmetry: (pt_gamma - pt_jet)/pt_gamma
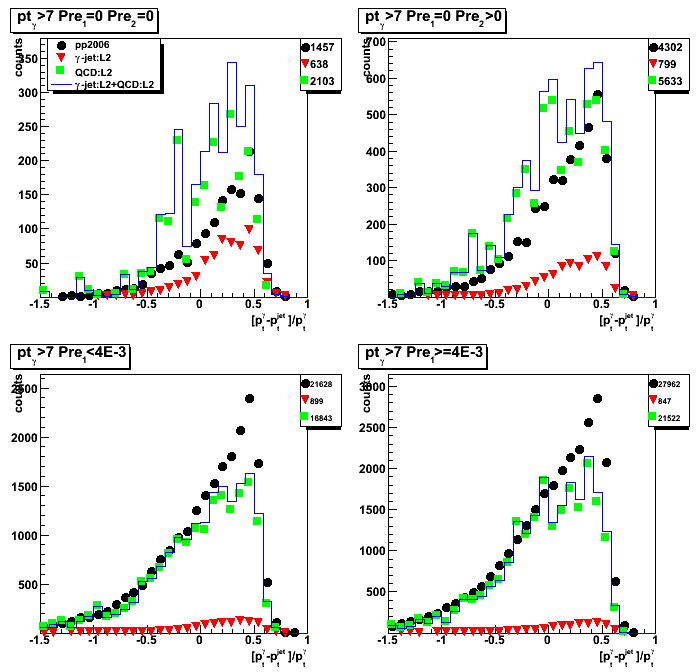
Figure 5: gamma pt vs. away side jet pt
1st column: triggered pp2006 data
2nd column: gamma-jet MC (l2gamma trigger on)
3rd column: QCD background MC (l2gamma trigger on)
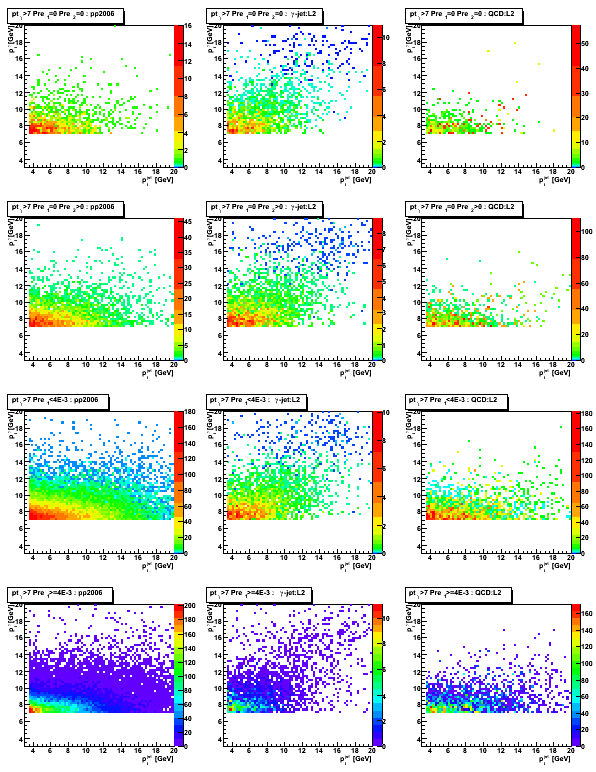
2009.01.20 Away side jet pt vs. photon pt: more stats for QCD pt_parton 9-15GeV
Ilya Selyuzhenkov January 20, 2009
Note:
this is an update with 10x more statitstics for QCD 9-15GeV parton pt bin.
See this post for old results.
Data sets
- pp2006 - STAR 2006 pp longitudinal data (~ 3.164 pb^1)
Trigger: eemc-http-mb-L2gamma [id:137641] - gamma-jet[gamma-filtered] - data-driven Prompt Photon [p6410EemcGammaFilter] events.
Partonic pt range 2-25 GeV. - QCD jets[gamma-filtered] - data-driven QCD [p6410EemcGammaFilter] events.
Partonic pt range 2-25 GeV.
Cuts applied
- Di-jet events
- Require to reconstruct photon momentum (no gamma-jet isolation cuts)
- Gamma pt > 7GeV
- L2gamma emulation in Monte-Carlo
- L2gamma triggered pp2006 events
Comments
- Vertex z distributions from QCD MC and pp2006 data
are different in the negative region (see Fig.1) - pp2006 data to Monte-Carlo ratio
does not depends on reconstructed photon pt,
but it has some vertex z dependence
(see data to MC ratio in Fig.6 for pre-shower1 > 4MeV case)
Figures
Figure 1: Vertex z distribution

Figure 2: Away side jet pt

Figure 3: Photon pt

Figure 4: gamma-jet pt asymmetry: (pt_gamma - pt_jet)/pt_gamma

Figure 5: gamma pt vs. away side jet pt
1st column: triggered pp2006 data
2nd column: gamma-jet MC (l2gamma trigger on)
3rd column: QCD background MC (l2gamma trigger on)
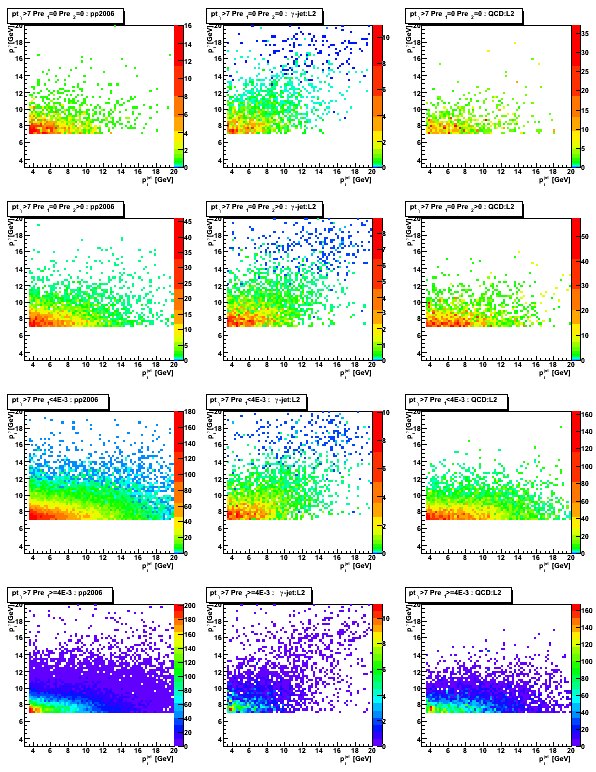
Data to Monte_Carlo normalization
Figure 6: pp2006 data to Monte -Carlo sum [QCD + gamma-jet] ratio
for pre-shower1>4MeV (most of statistics)
Left: data to MC ratio vs. reconstructed gamma pt.
Solid line shows constant line fit (p0 ~ 1.3)
Right: data to MC ratio vs. reconstructed vertex position

2009.01.27 gamma and jet pt plots with detector |eta|_jet < 0.8, pt_jet > 7
Ilya Selyuzhenkov January 27, 2009
Data sets
- pp2006 - STAR 2006 pp longitudinal data (~ 3.164 pb^1)
Trigger: eemc-http-mb-L2gamma [id:137641] - gamma-jet[gamma-filtered] - data-driven Prompt Photon [p6410EemcGammaFilter] events.
Partonic pt range 2-25 GeV. - QCD jets[gamma-filtered] - data-driven QCD [p6410EemcGammaFilter] events.
Partonic pt range 2-25 GeV.
Cuts applied
- Di-jet events
- Require to reconstruct photon momentum (no gamma-jet isolation cuts)
- jet pt > 7GeV
- Gamma pt > 7GeV or no pt cuts
- L2gamma emulation in Monte-Carlo
- L2gamma triggered pp2006 events
- cos (phi_jet - phi_gamma) < -0.8
- detector |eta_jet|< 0.8
- |v_z| < 100
Figures
All figures:
- All pre-shower conditions combined, pre1<10MeV
- Left plots: no gamma pt cut
Right plots: pt_gamma >7GeV - Thick blue line shows MC sum: QCD + gamma-jet
- Thin solid color lines shows distributions from various partonic pt bins for QCD MC
See figures legend for color coding
Figure 1: Vertex z distribution
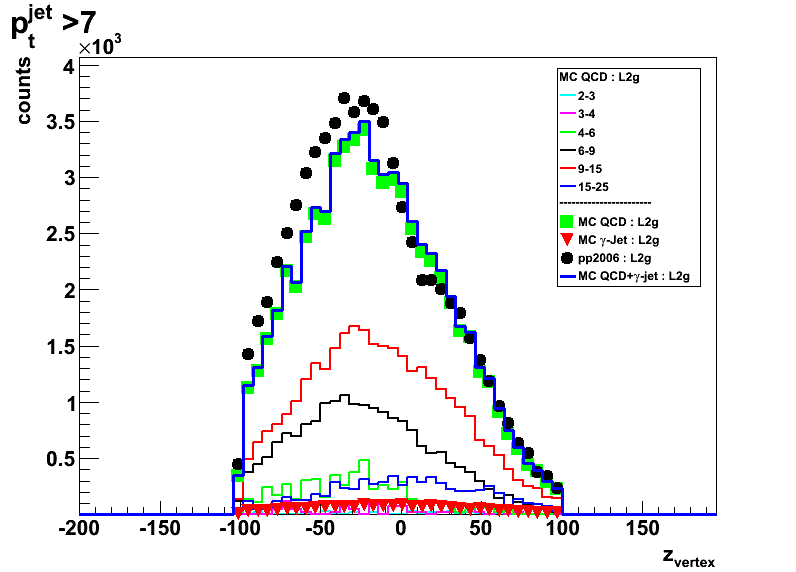
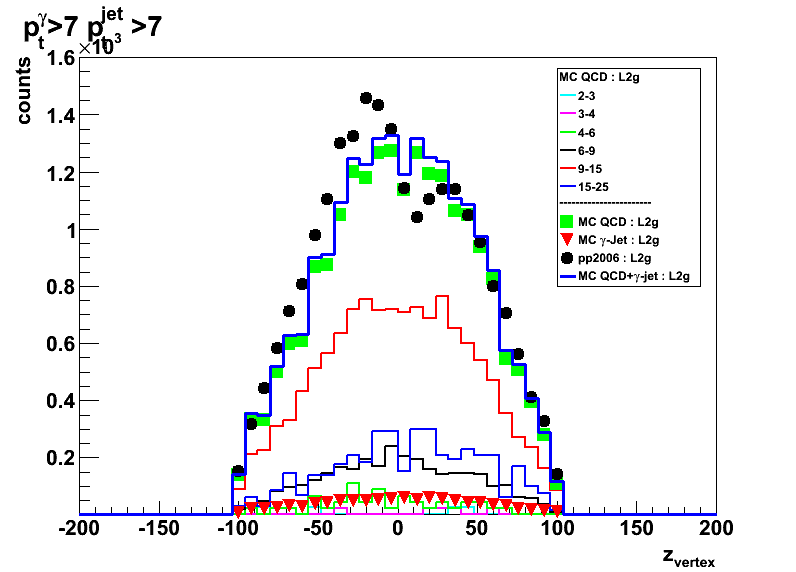
Figure 2: Photon eta
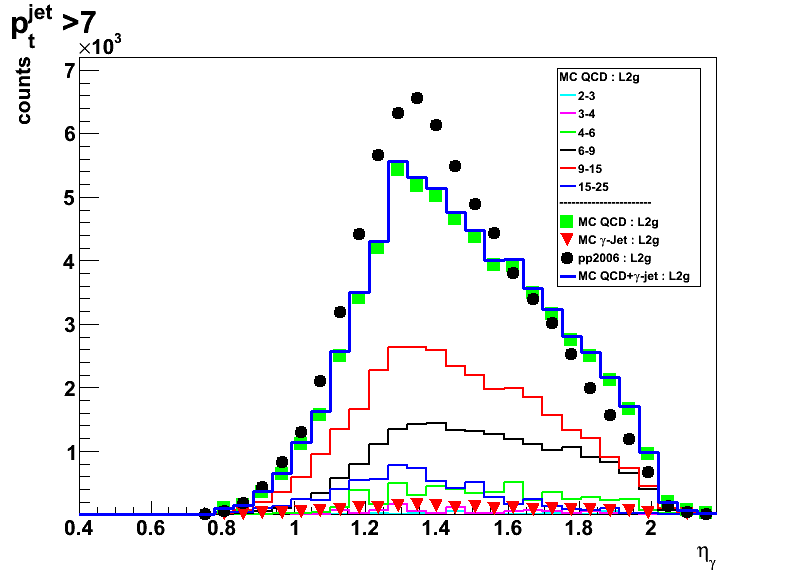
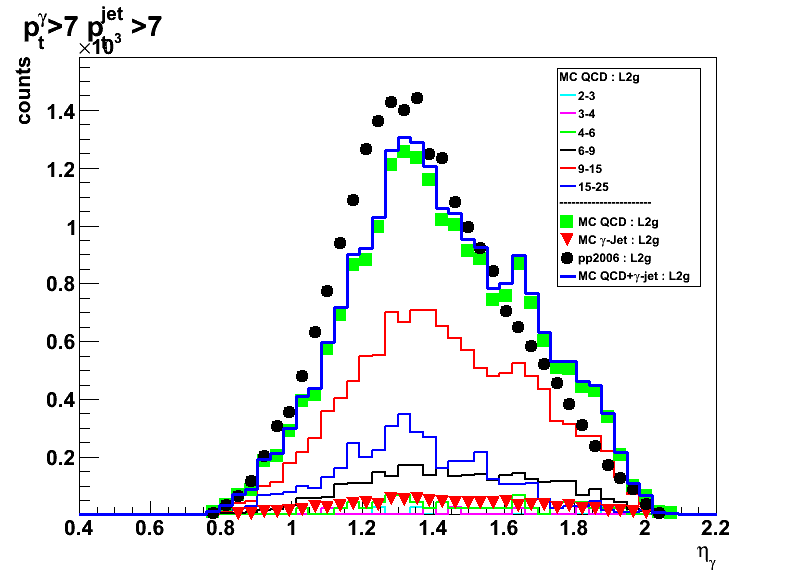
Figure 3: Away side jet eta

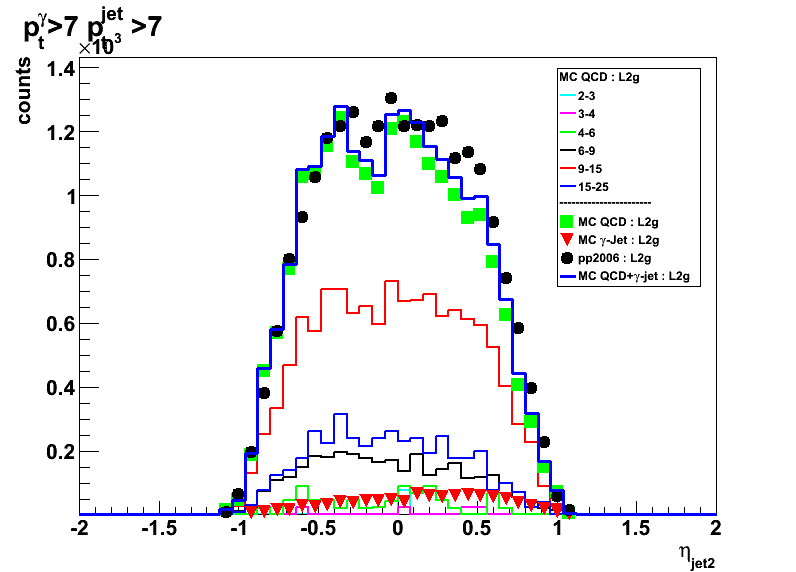
Figure 4:Photon pt
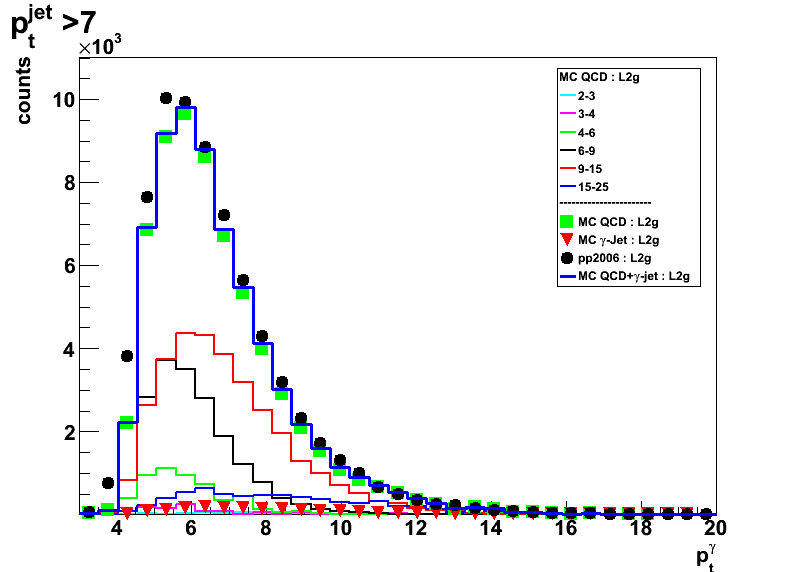

Figure 5: Away side jet pt
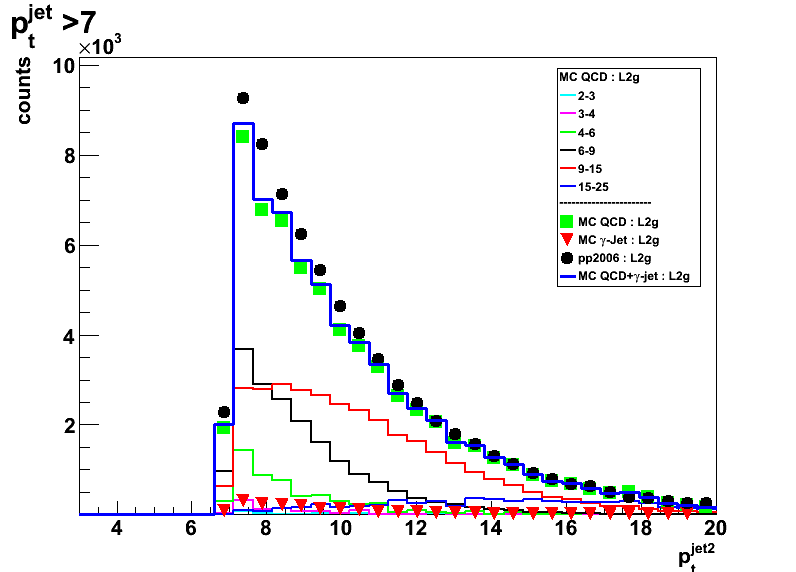
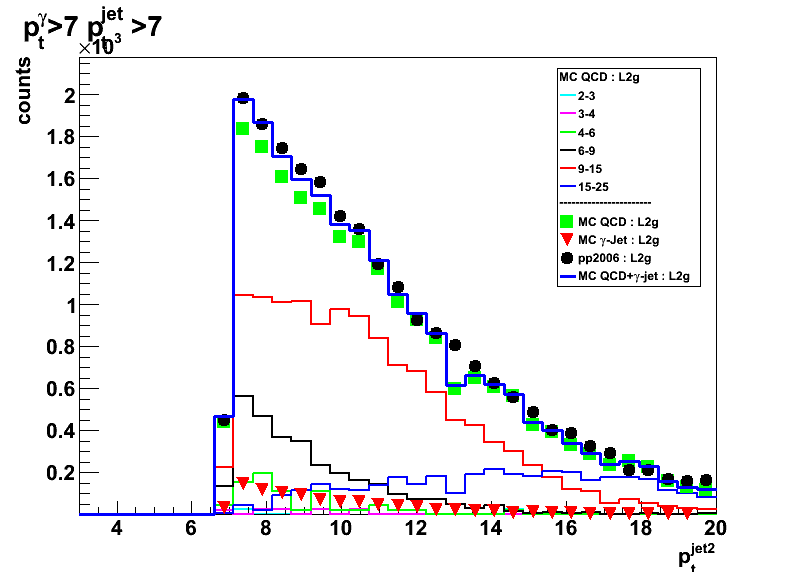
Figure 6: Away side jet detector eta
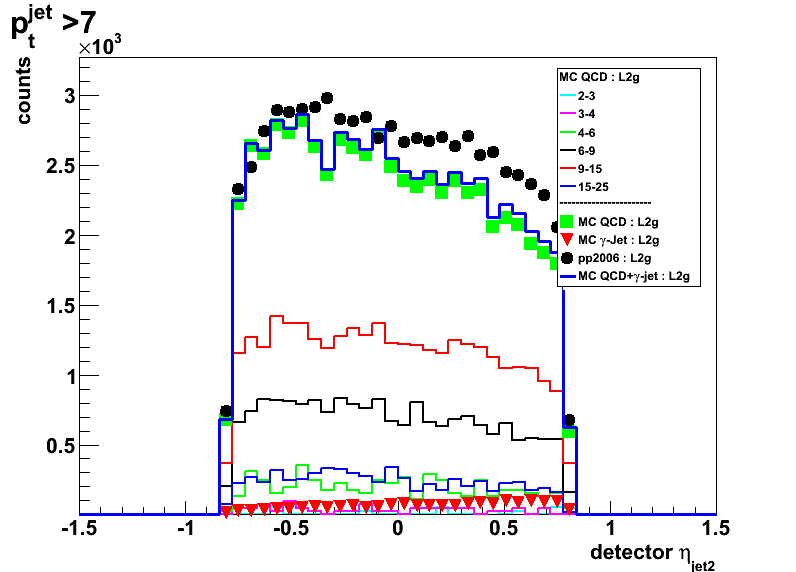
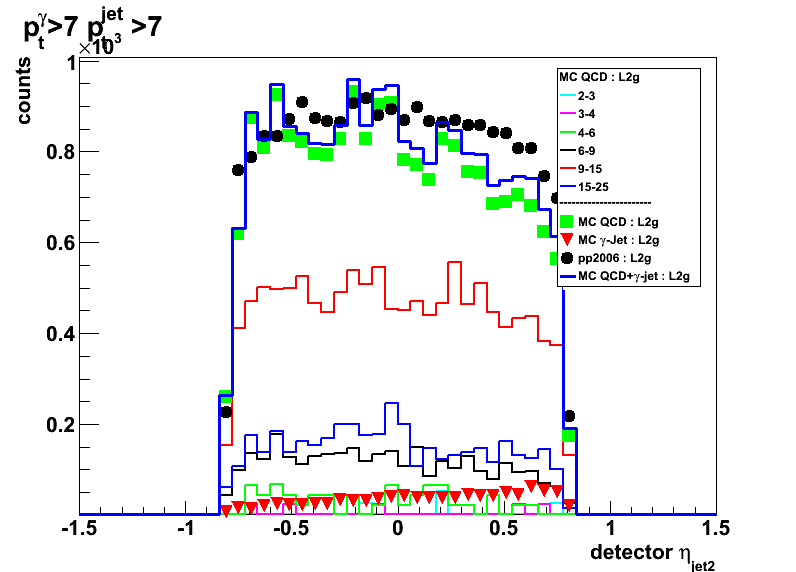
2009.01.27 gamma and jet pt plots with |eta|_jet < 0.7
Ilya Selyuzhenkov January 27, 2009
Data sets
- pp2006 - STAR 2006 pp longitudinal data (~ 3.164 pb^1)
Trigger: eemc-http-mb-L2gamma [id:137641] - gamma-jet[gamma-filtered] - data-driven Prompt Photon [p6410EemcGammaFilter] events.
Partonic pt range 2-25 GeV. - QCD jets[gamma-filtered] - data-driven QCD [p6410EemcGammaFilter] events.
Partonic pt range 2-25 GeV.
Cuts applied
- Di-jet events
- Require to reconstruct photon momentum (no gamma-jet isolation cuts)
- Gamma pt > 7GeV or no pt cuts
- L2gamma emulation in Monte-Carlo
- L2gamma triggered pp2006 events
- cos (phi_jet - phi_gamma) < -0.8
- |eta_jet|< 0.7
- |v_z| < 100
Figures
All figures:
- All pre-shower conditions combined, pre1<10MeV
- Left plots: no gamma pt cut
Right plots: pt_gamma >7GeV - Thick blue line shows MC sum: QCD + gamma-jet
- Thin solid color lines shows distributions from various partonic pt bins for QCD MC
See figures legend for color coding
Figure 1: Vertex z distribution
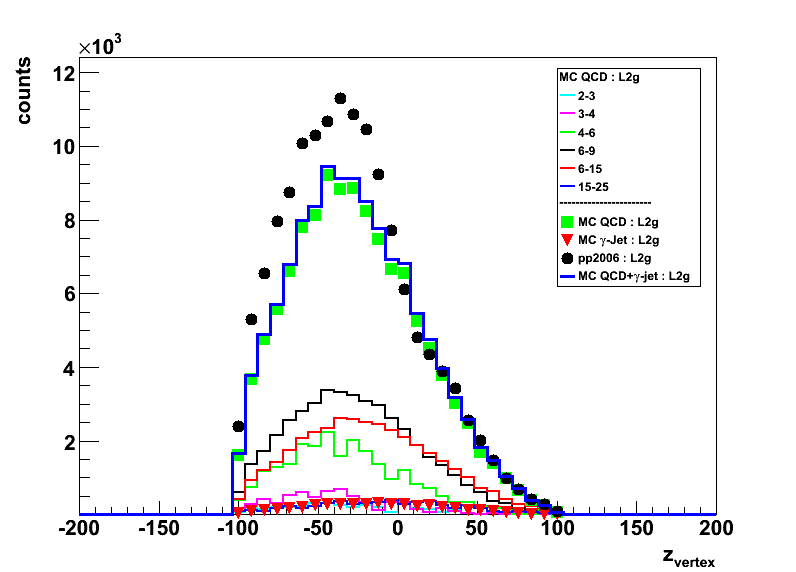
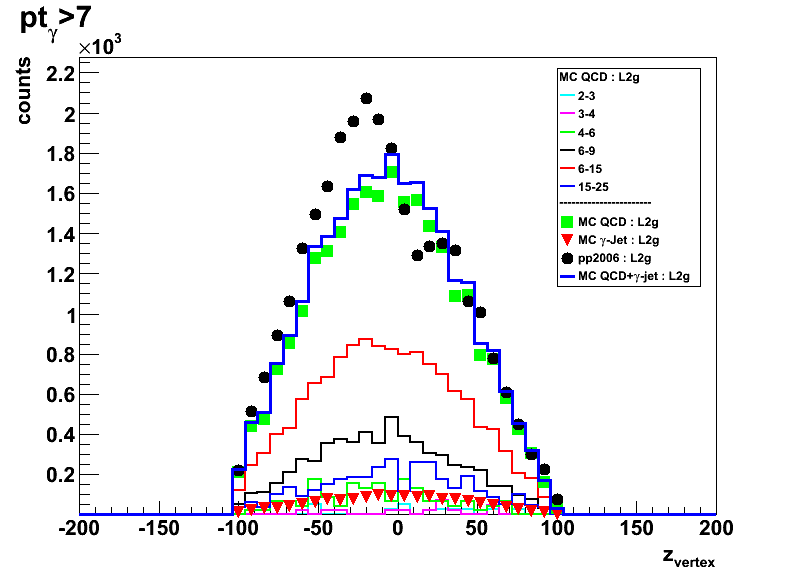
Figure 2: Photon eta
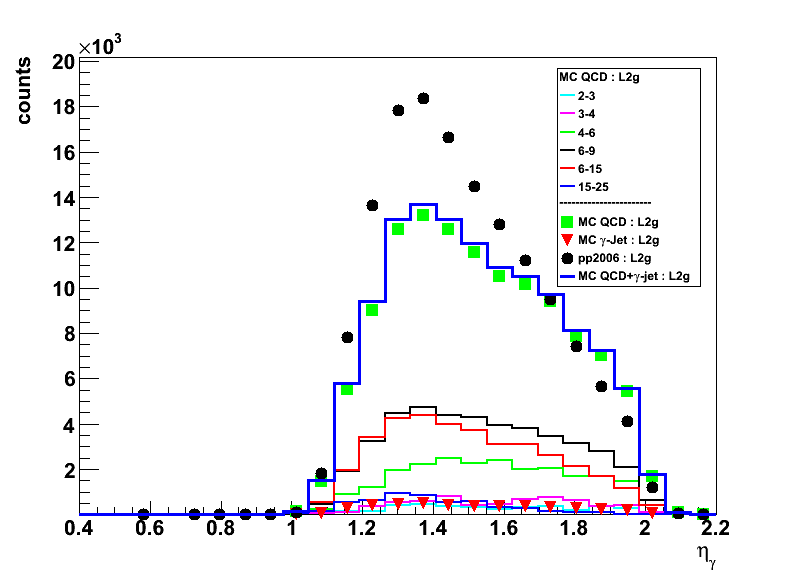
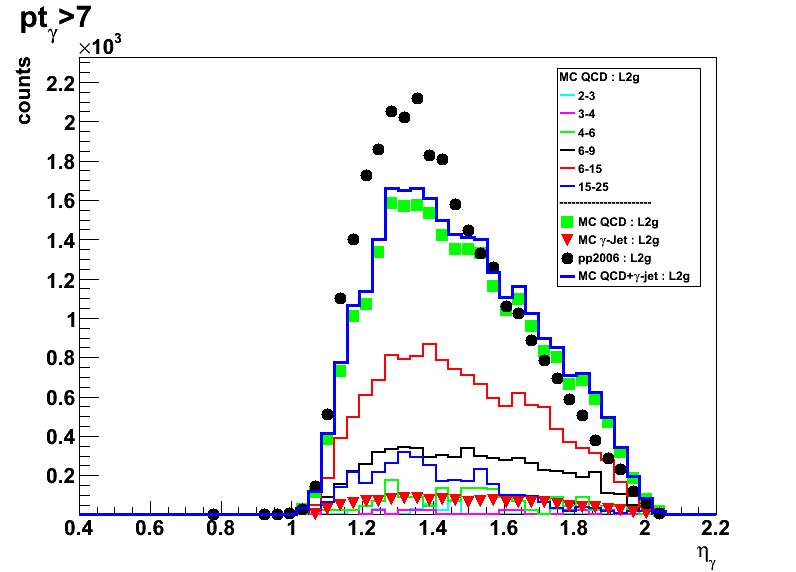
Figure 3: Away side jet eta
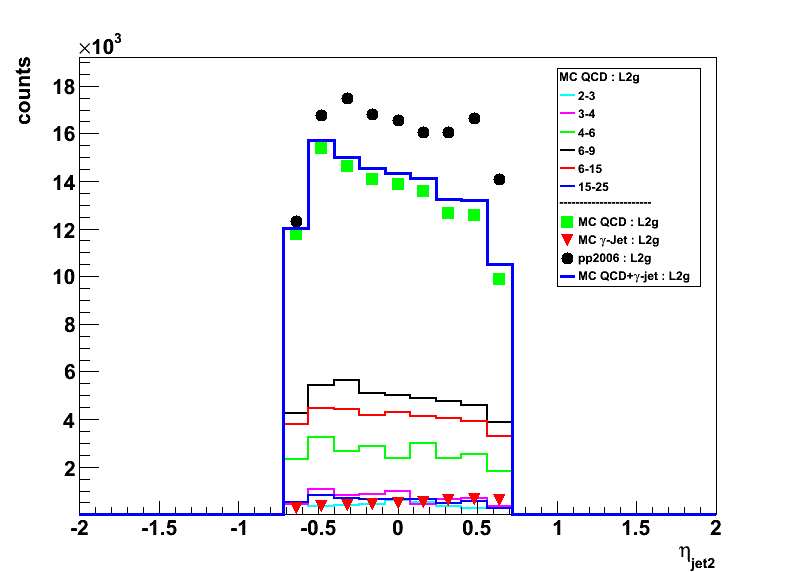
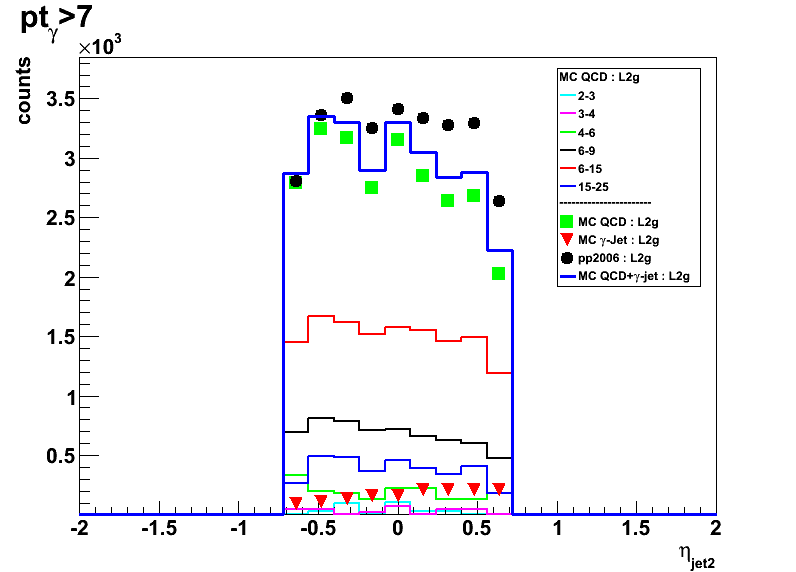
Figure 4:Photon pt

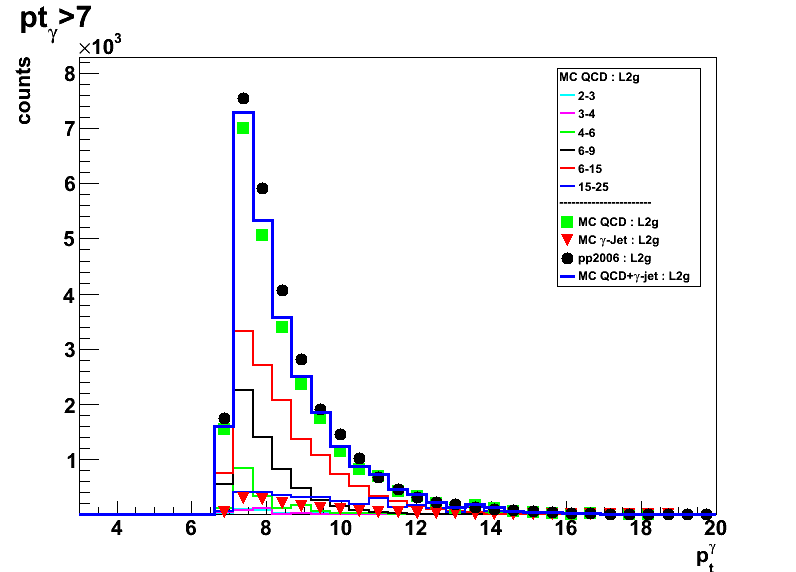
Same as in Fig.4 on a log scale: no gamma pt cut and pt>7GeV
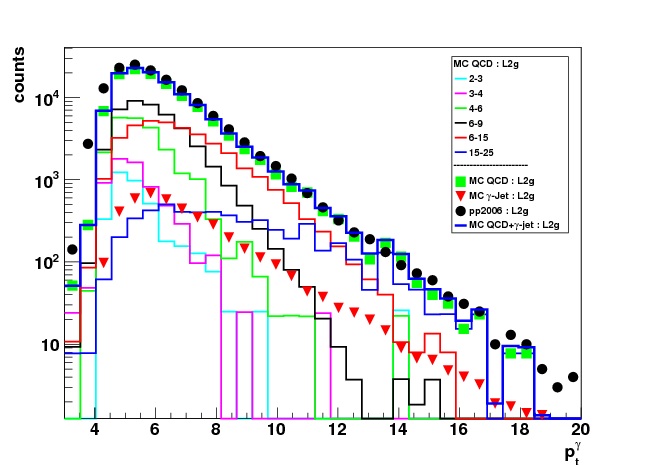
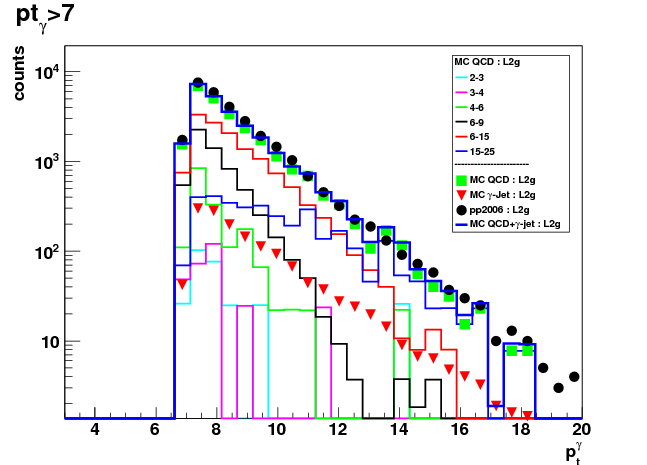
Figure 5: Away side jet pt

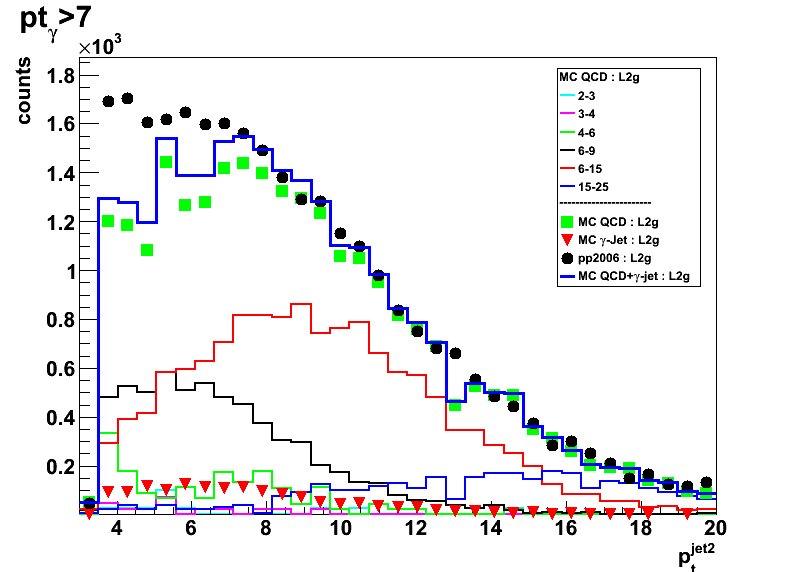
Same as in Fig.5 on a log scale: no gamma pt cut and pt>7GeV
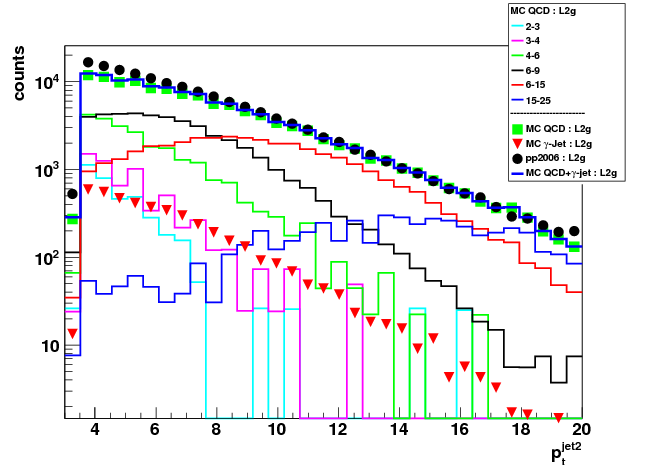
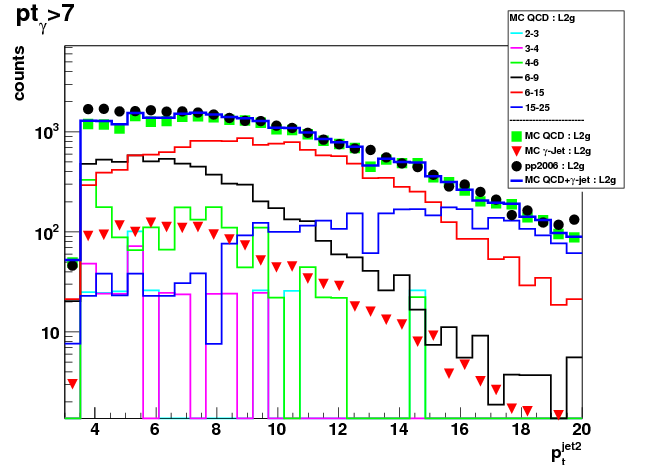
02 Feb
February 2009 posts
2009.02.02 No pre-shower cuts, Normalization fudge factor 1.24
Ilya Selyuzhenkov February 02, 2009
Data sets
- pp2006 - STAR 2006 pp longitudinal data (~ 3.164 pb^1)
Trigger: eemc-http-mb-L2gamma [id:137641] - gamma-jet[gamma-filtered] - data-driven Prompt Photon [p6410EemcGammaFilter] events.
Partonic pt range 2-25 GeV. - QCD jets[gamma-filtered] - data-driven QCD [p6410EemcGammaFilter] events.
Partonic pt range 2-25 GeV.
Cuts applied
- Di-jet events
- Require to reconstruct photon momentum (no gamma-jet isolation cuts)
- Gamma pt > 7GeV
- L2gamma emulation in Monte-Carlo
- L2gamma triggered pp2006 events
- cos (phi_jet - phi_gamma) < -0.8
- detector |eta_jet|< 0.8
- |v_z| < 100
Figures
All figures:
- All pre-shower conditions combined, No pre-shower cuts
- Thick blue line shows MC sum: QCD + gamma-jet
- Black solid circles: pp2006 data
- Monte-Carlo results first scaled to 3.164 pb^-1 according to Pythia luminosity
and then an additional fudge factor of 1.24 has been applied.
Fudge factor is defined as the yields ratio from data to scaled with Pythia luminosity Monte-Carlo
for pt_jet>7GeV and pt_gamma>7 candidates
Figure 1: Vertex z distribution with pt_jet>7 cut (left) and without pt_jet cut (rigth)
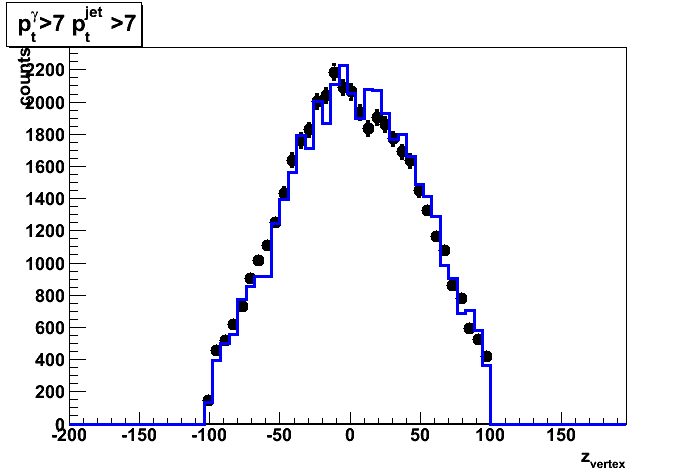
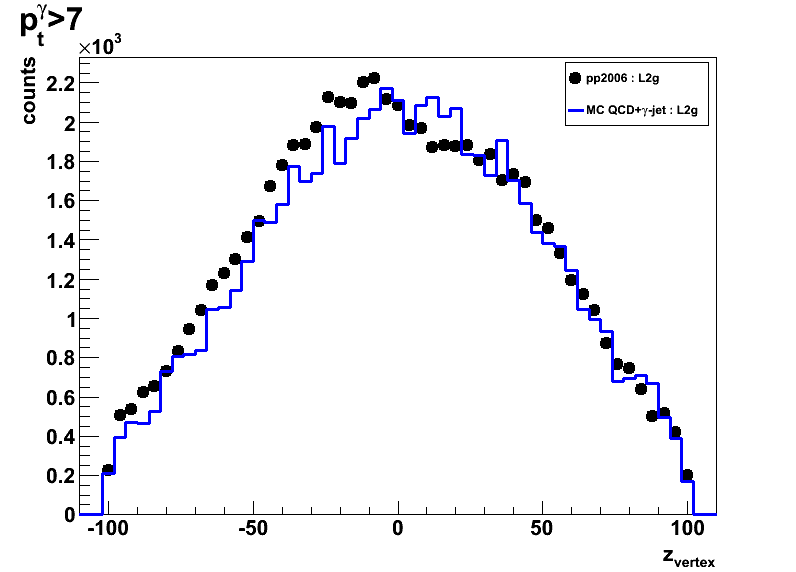
Figure 2: Photon (left) and away side jet (right) pt
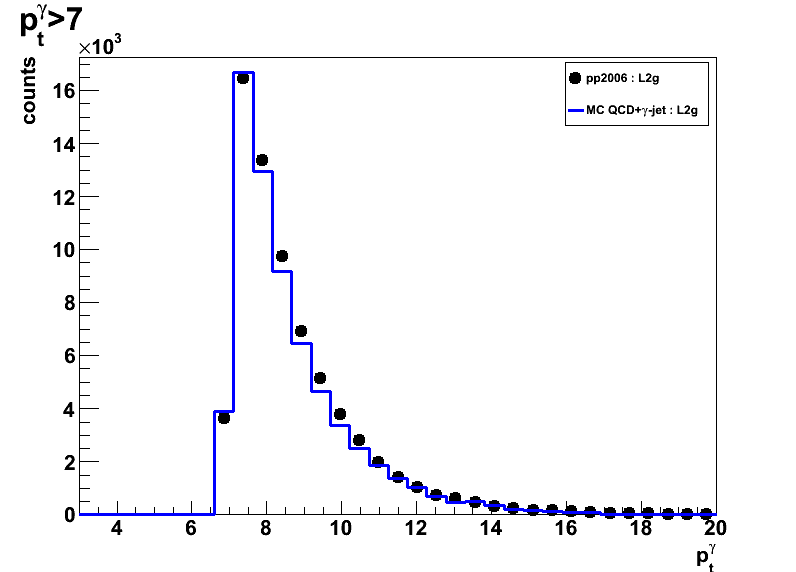
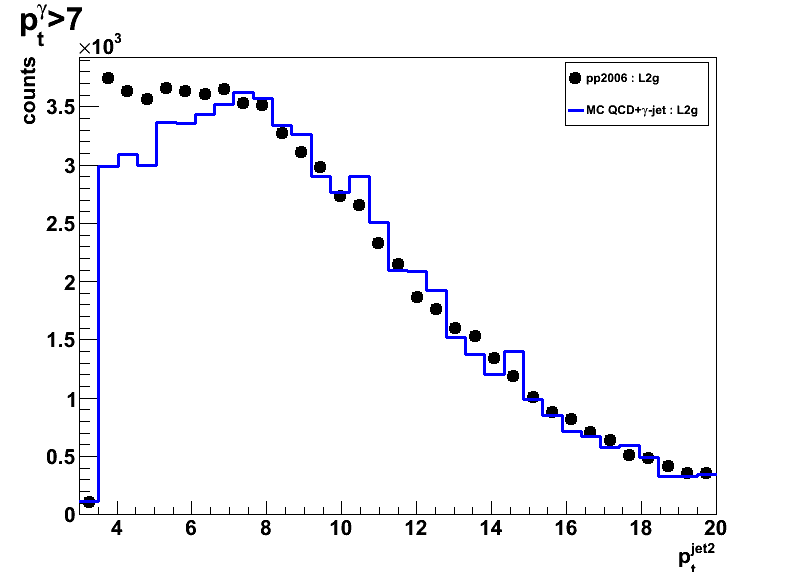
Figure 3: Photon detector eta (left) and corrected for vertex eta (right)
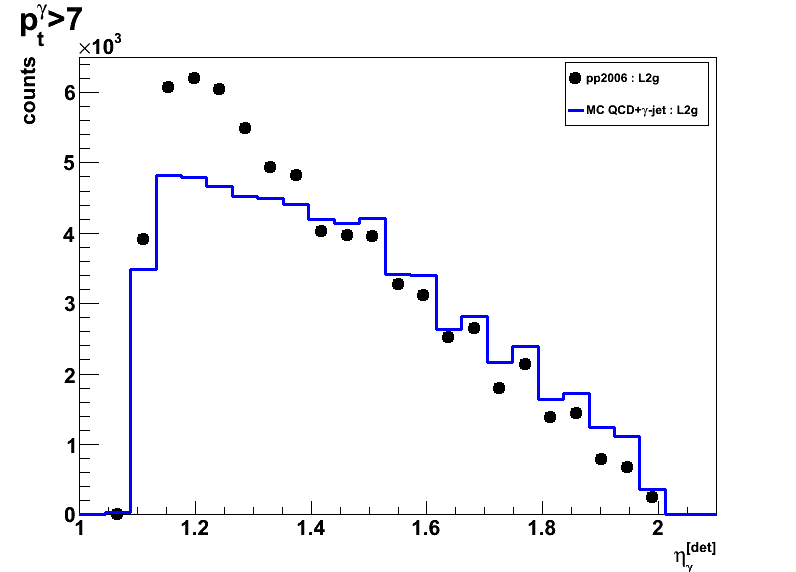
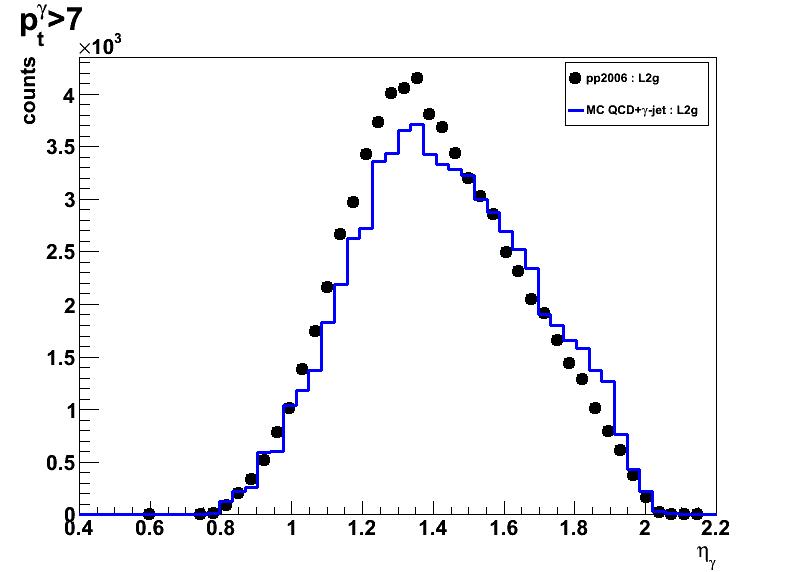
Figure 4: Away side jet detector eta (left) and corrected for vertex eta (right)
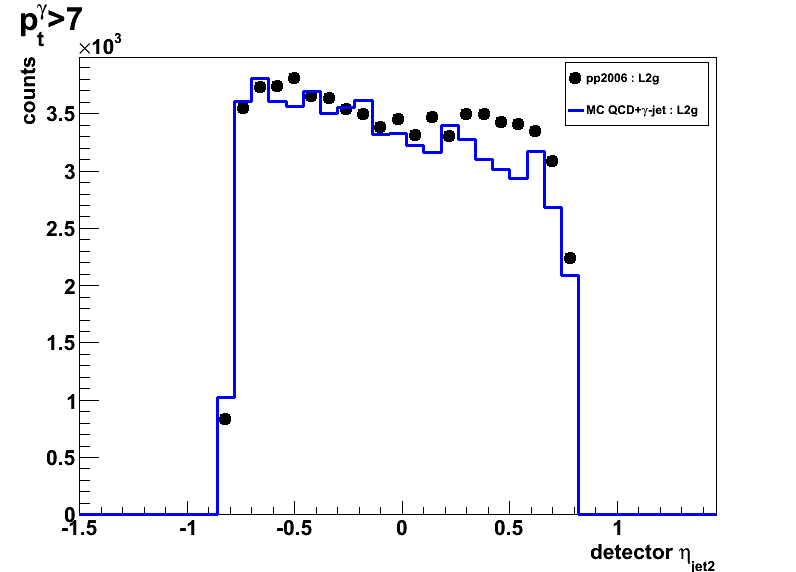

Figure 5: Preshower 1 (left) and Pre-shower2 (right) energy
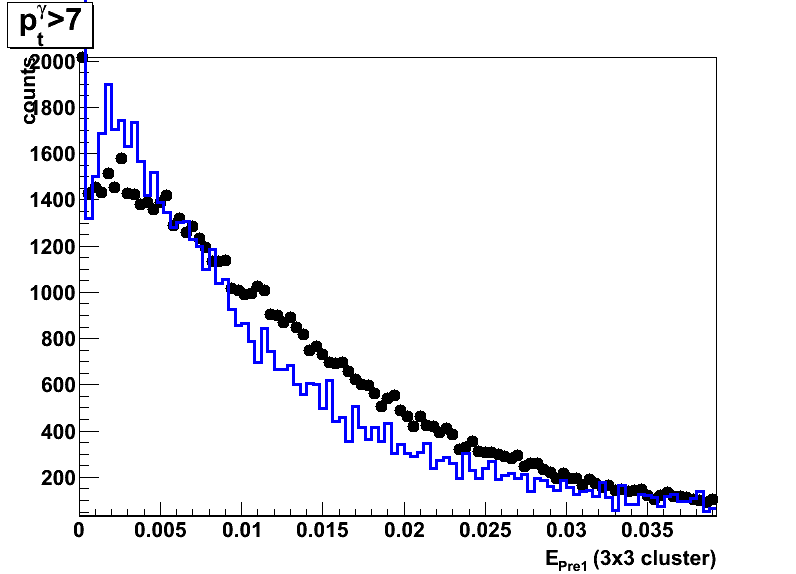

2009.02.03 No pre-shower cuts, pt_jet >7 vs. No pt_jet cuts
Ilya Selyuzhenkov February 03, 2009
Data sets
- pp2006 - STAR 2006 pp longitudinal data (~ 3.164 pb^1)
Trigger: eemc-http-mb-L2gamma [id:137641] - gamma-jet[gamma-filtered] - data-driven Prompt Photon [p6410EemcGammaFilter] events.
Partonic pt range 2-25 GeV. - QCD jets[gamma-filtered] - data-driven QCD [p6410EemcGammaFilter] events.
Partonic pt range 2-25 GeV.
Cuts applied
- Di-jet events
- Require to reconstruct photon momentum (no gamma-jet isolation cuts)
- Gamma pt > 7GeV
- L2gamma emulation in Monte-Carlo
- L2gamma triggered pp2006 events
- cos (phi_jet - phi_gamma) < -0.8
- detector |eta_jet|< 0.8
- |v_z| < 100
Figures
Each figure has:
- All pre-shower conditions combined, No pre-shower cuts
- Thick blue line shows MC sum: QCD + gamma-jet
- Black solid circles shows pp2006 data
- Left plots: pt_jet>7GeV
Right plots: no cuts on pt_jet - Monte-Carlo results for QCD and gamma-jet samples are first
scaled to 3.164 pb^-1 according to Pythia luminosity,
added together, and then an additional fudge factor of 1.24 applied.
Fudge factor is defined as pp2006 to Monte-Carlo sum ratio
for pt_jet>7GeV and pt_gamma>7 candidates
Figure 1: Vertex z distribution
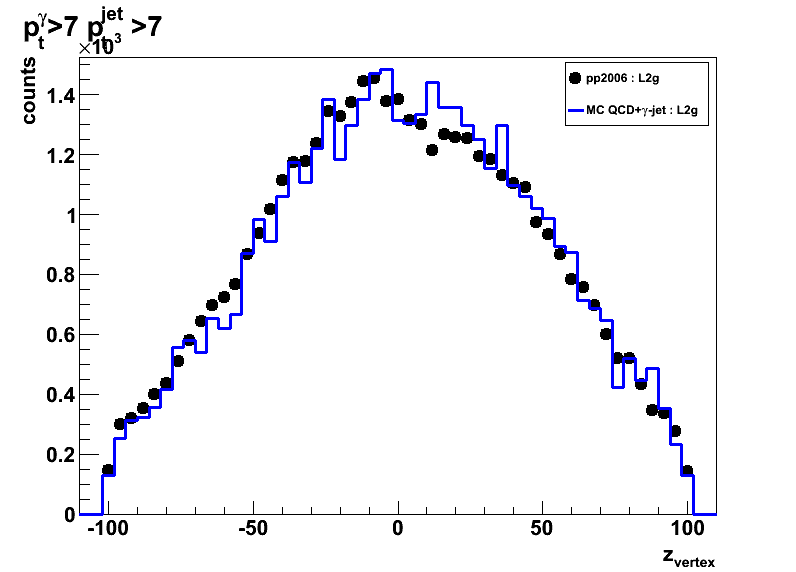

Figure 2: Photon detector eta
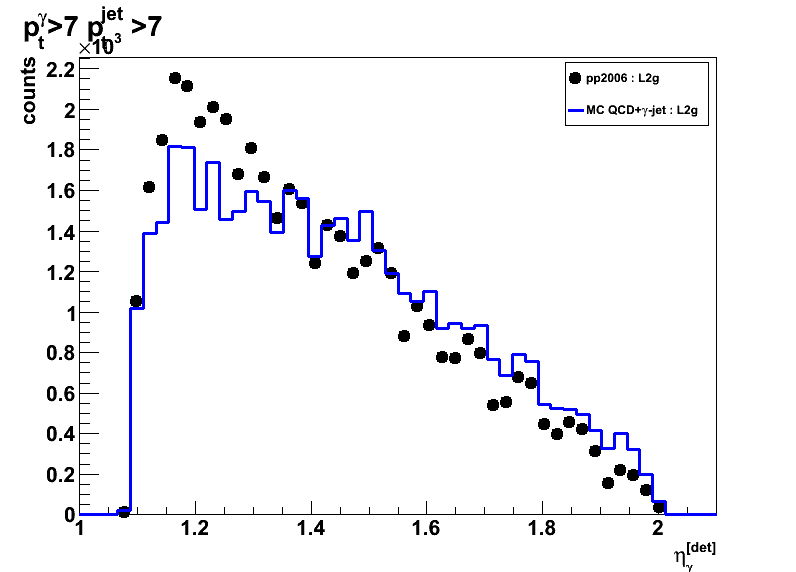

Figure 3: Corrected for vetrex photon eta


Figure 4: Away side jet detector eta
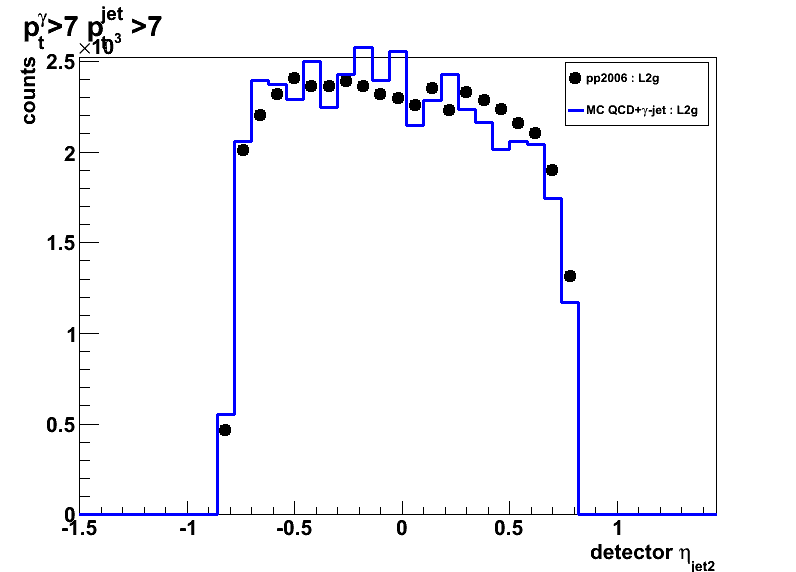

Figure 5: Corrected for vetrex away side jet eta
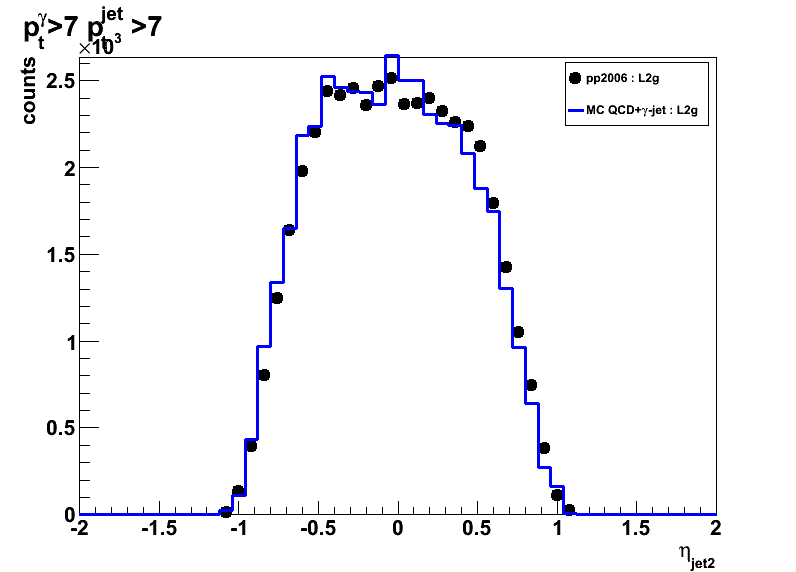
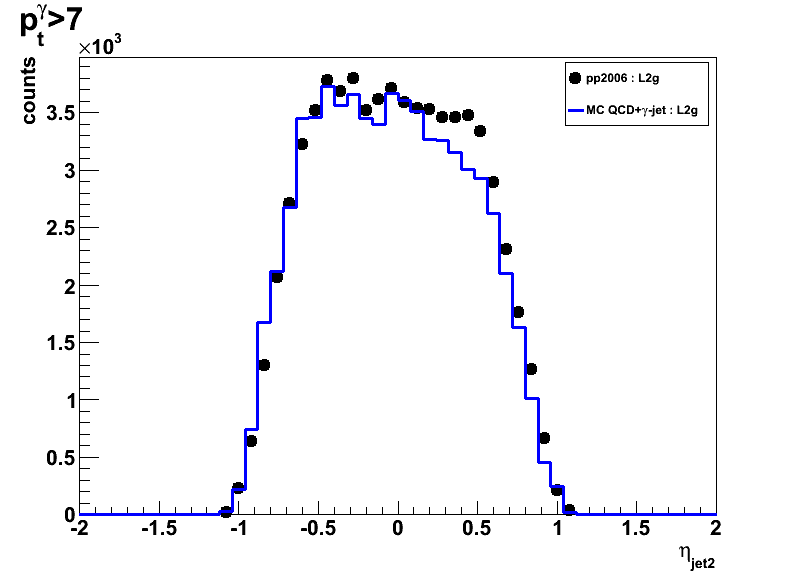
Figure 6:Photon pt


Figure 7: Away side jet pt


Figure 8: Pre-shower 1 energy
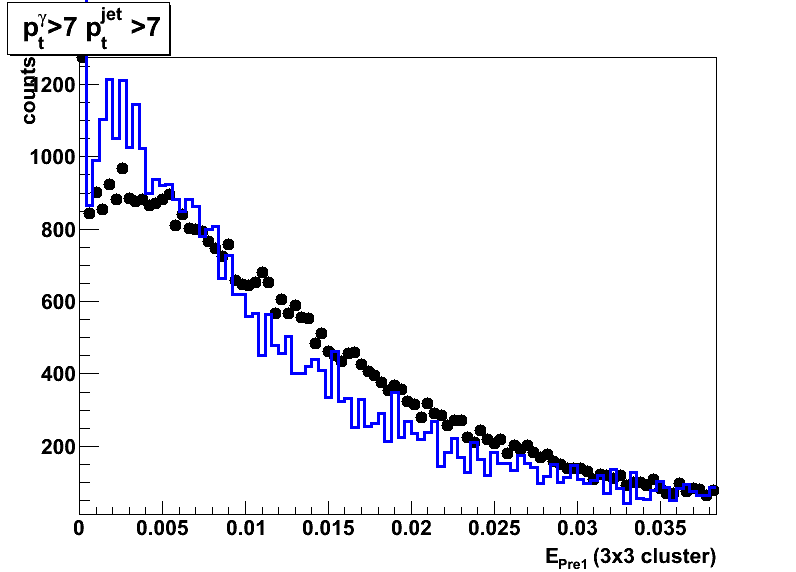
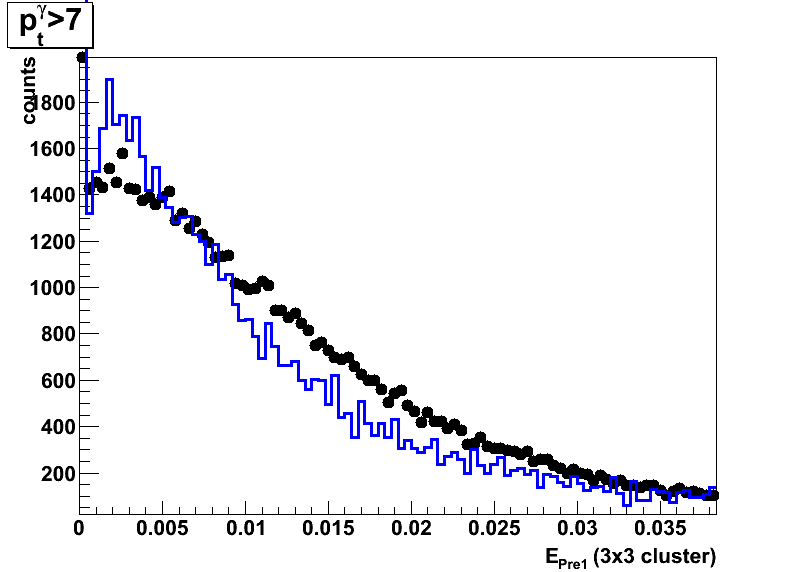
Figure 9: Pre-shower 2 energy
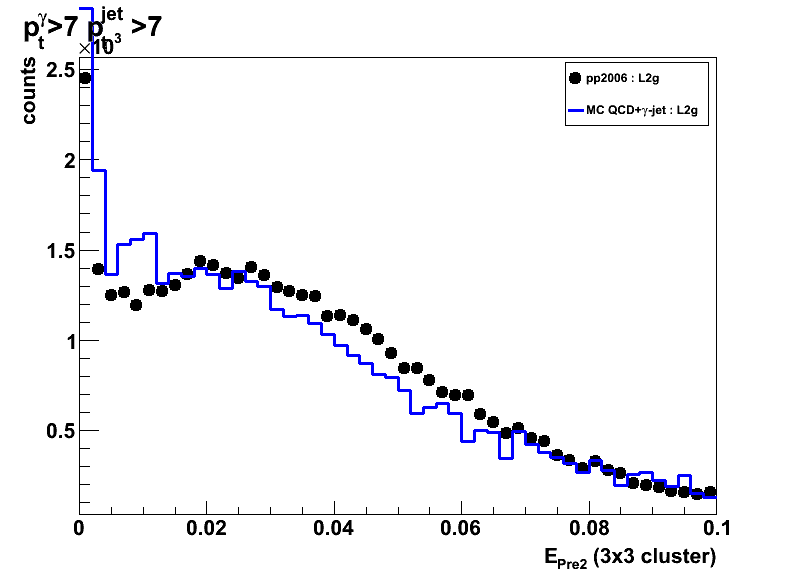
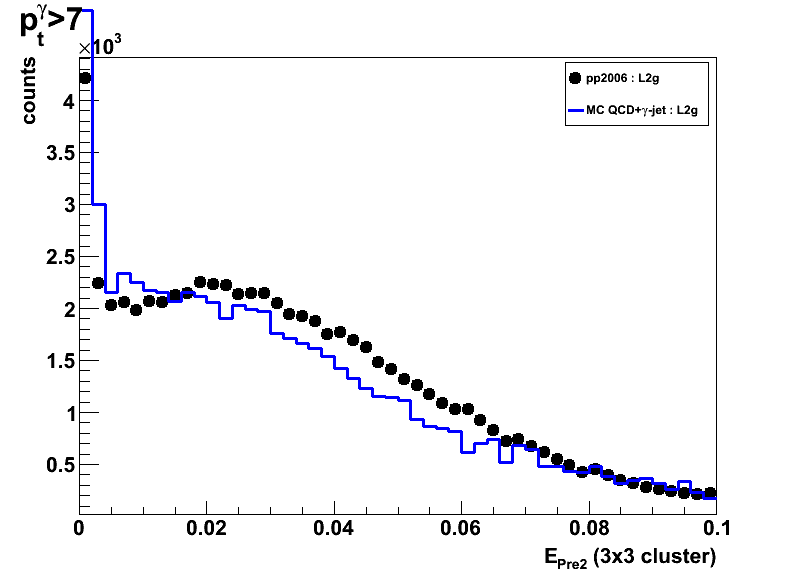
2009.02.06 Pre-shower energy distribution Run6 vs. Run8 geometry
Ilya Selyuzhenkov February 06, 2009
Data sets
- pp2006 - STAR 2006 pp longitudinal data (~ 3.164 pb^1)
Trigger: eemc-http-mb-L2gamma [id:137641] - mc2006: gamma-jet+QCD jets [p6410EemcGammaFilter] events.
- pp2008 - STAR 2008 pp data
Trigger: etot-mb-l2 [id:7]
Partonic pt range 2-25 GeV.
Cuts applied
- Di-jet events
- Require to reconstruct photon momentum (no gamma-jet isolation cuts)
- Gamma pt > 7GeV, jet pt > 7GeV
- L2gamma emulation in Monte-Carlo
- L2gamma triggered for pp2006 and pp2008 events
- cos (phi_jet - phi_gamma) < -0.8
- detector |eta_jet|< 0.8
- |v_z| < 100
Figures
Each figure has:
- All pre-shower conditions combined, No pre-shower cuts
- Red circles show pp2006 data
- Black triangles show pp2008 data
Data scaled to match the integraled yield from pp2006 data - Green line shows MC sum: QCD + gamma-jet
Monte-Carlo results for QCD and gamma-jet samples are first
scaled to 3.164 pb^-1 according to Pythia luminosity,
added together, and then an additional fudge factor of 1.24 applied.
Fudge factor is defined as pp2006 to Monte-Carlo sum ratio
for pt_jet>7GeV and pt_gamma>7 candidates
Observations
- Pre-shower energy distributions from pp2008 data set
are narrower than that for pp2006 data.
This corresponds to smaller amount of material budget in y2008 STAR geometry. - Pre-shower energy distribution from Monte-Carlo with y2006 geometry
closer follows the distribution from pp2008 data set, rather than that from pp2006 data.
This indicates the lack of material budget in y2006 Monte-Carlo.
Note: There is a "pre-shower sector 10 problem" for pp2008 data,
which results in migration of small fraction of events with pre-shower>0 into
pre-shower=0 bin (first zero bins in Fig.1 and 2. below).
For pre-shower>0 case this only affects overall normalization of pp2008 data,
but not the shape of pre-shower energy distributions.
I'm running jet-finder+my software to get more statistics from pp2008 data set,
and after more QA will produce list of runs with "pre-shower sector 10 problem",
so to exclude them in the next iteration of my plots.
Figure 1: Pre-shower1 energy distribution
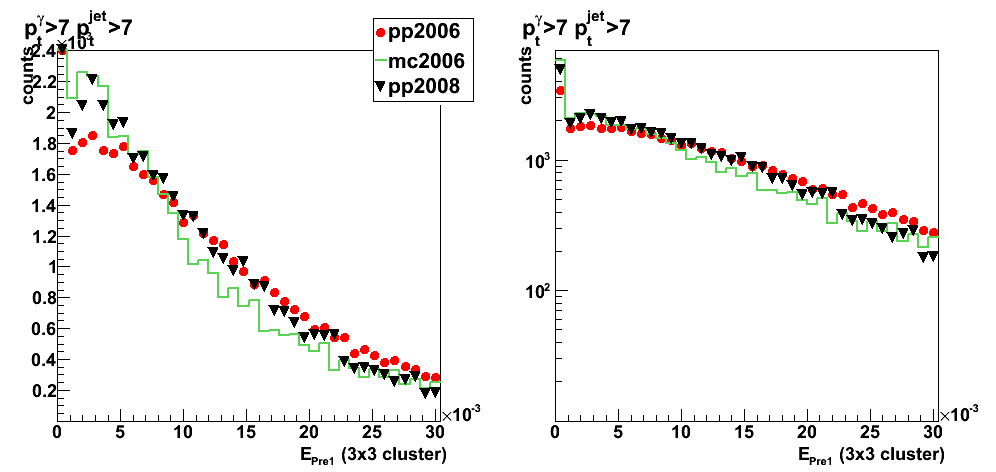
Figure 2: Pre-shower2 energy distribution
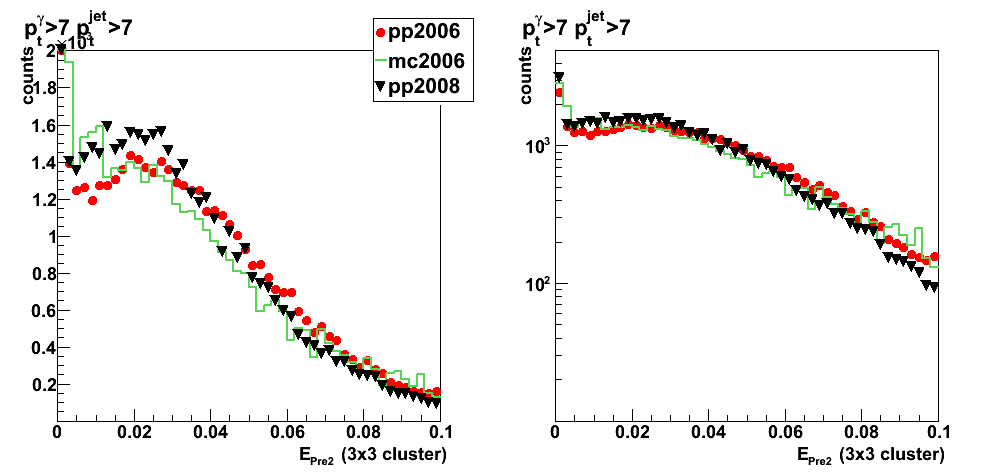
2009.02.09 pp2006, pp2008, amd mc2006 comparison
Ilya Selyuzhenkov February 06, 2009
Data sets
- pp2006 - STAR 2006 pp longitudinal data (~ 3.164 pb^1)
Trigger: eemc-http-mb-L2gamma [id:137641] - mc2006: gamma-jet+QCD jets [p6410EemcGammaFilter] events.
- pp2008 - STAR 2008 pp data
Trigger: etot-mb-l2 [id:7]
Partonic pt range 2-25 GeV.
Cuts applied
- Di-jet events
- Require to reconstruct photon momentum (no gamma-jet isolation cuts)
- Gamma pt > 7GeV, jet pt > 7GeV
- L2gamma emulation in Monte-Carlo
- L2gamma triggered for pp2006 and pp2008 events
- cos (phi_jet - phi_gamma) < -0.8
- detector |eta_jet|< 0.8
- |v_z| < 100
Figures
Each figure has:
- All pre-shower conditions combined, No pre-shower cuts
- Red circles show pp2006 data
- Black triangles show pp2008 data
Data scaled to match the integraled yield from pp2006 data - Green line shows MC sum: QCD + gamma-jet
Monte-Carlo results for QCD and gamma-jet samples are first
scaled to 3.164 pb^-1 according to Pythia luminosity,
added together, and then an additional fudge factor of 1.24 applied.
Fudge factor is defined as pp2006 to Monte-Carlo sum ratio
for pt_jet>7GeV and pt_gamma>7 candidates
Kinematics
Figure 1: vertex z
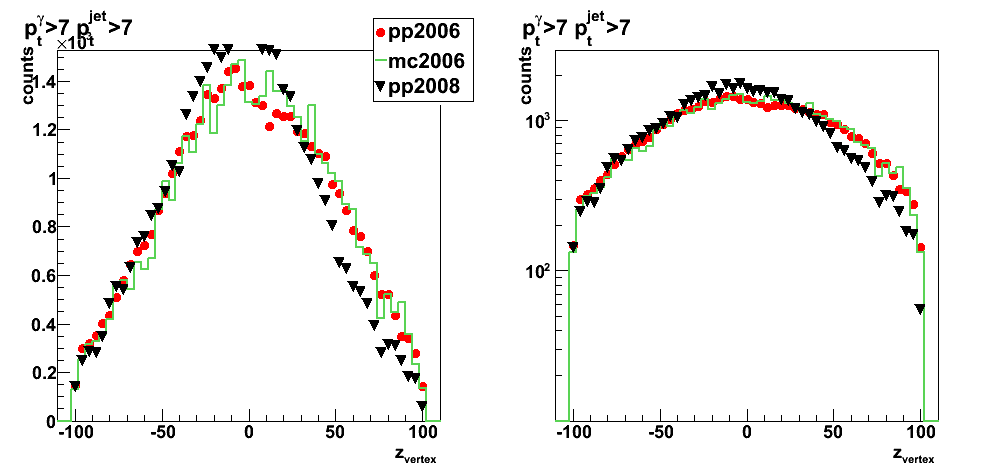
Figure 2: photon detector eta
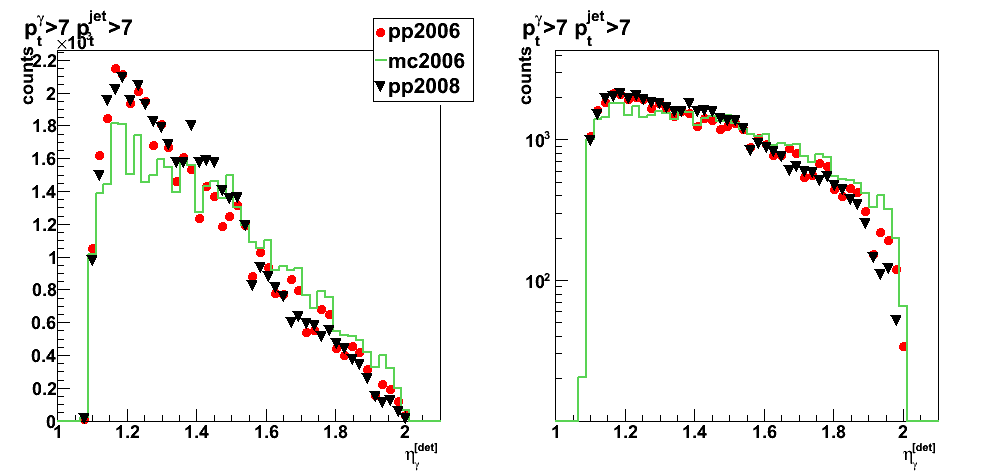
Figure 3: jet detector eta

Figure 4: photon pt

Figure 5: jet pt

Figure 6: gamma-jet pt balance
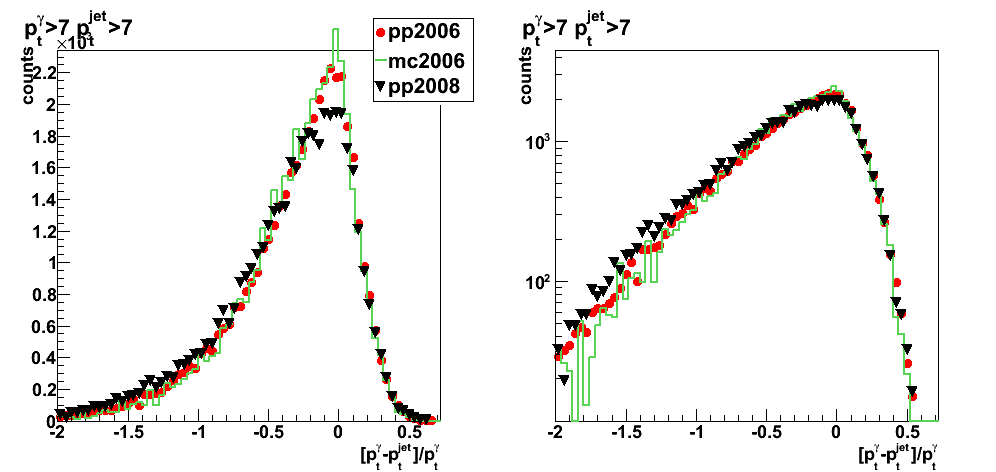
Figure 7: Photon neutral energy fraction
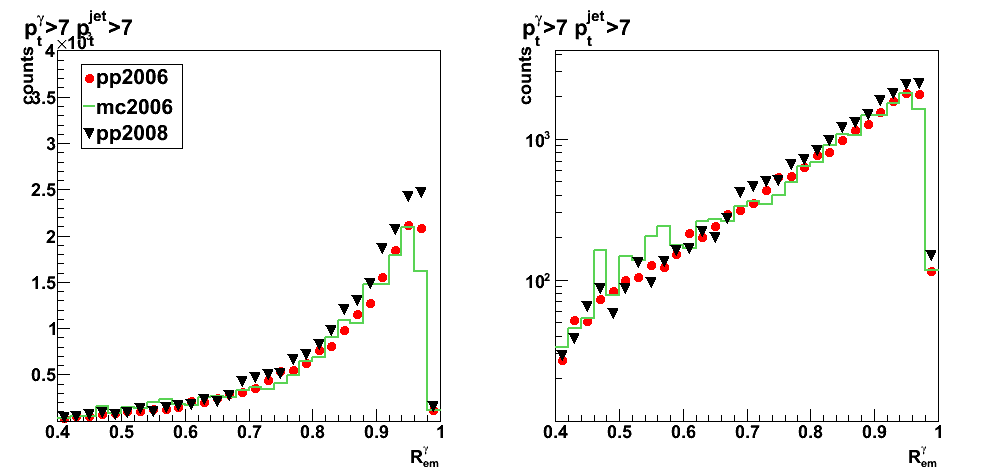
Figure 8: Jet neutral energy fraction

Figure 9: cos(phi_gamma-phi_jet)
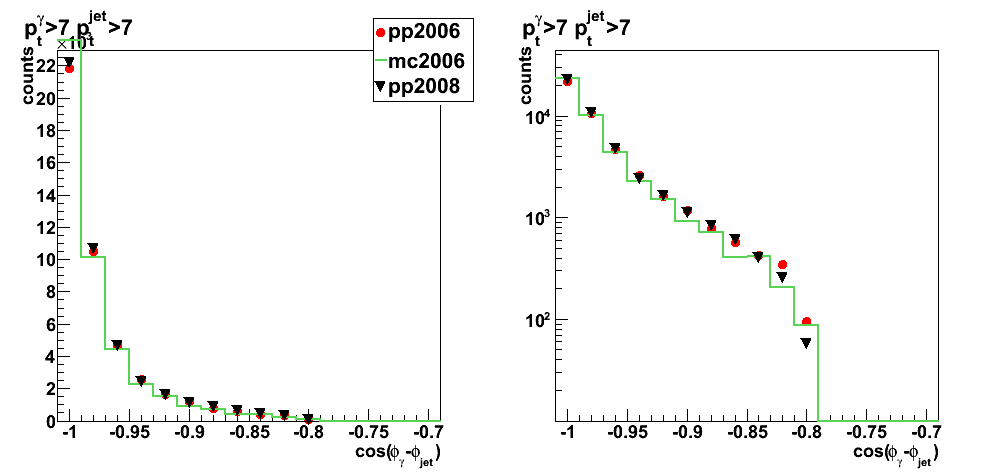
Photon candidate's 2x1, 2x2, and 3x3 tower cluser energy
Figure 10: 3x3 cluster energy
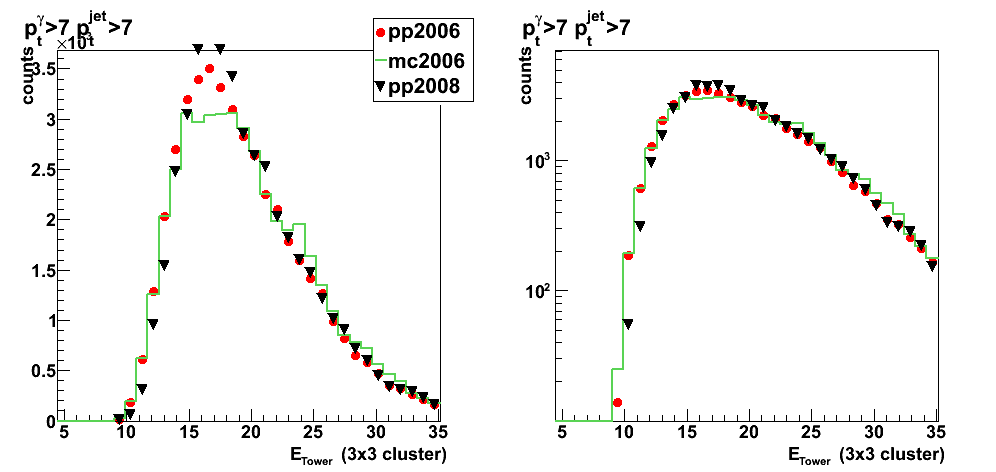
Figure 11: 2x1 cluster energy
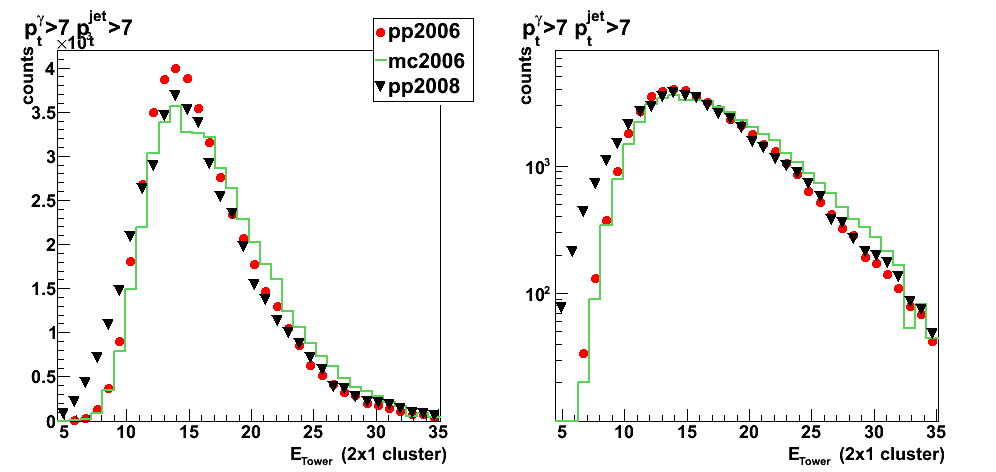
Figure 12: 2x2 cluster energy
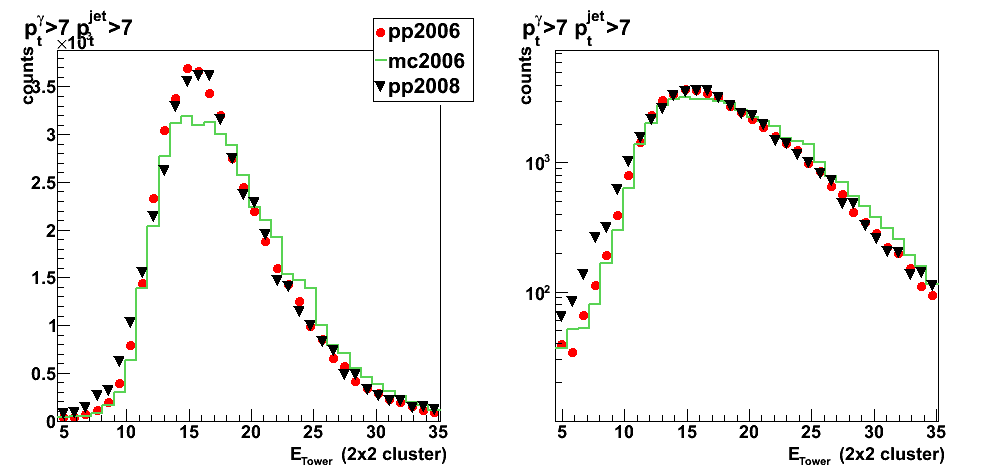
Number of charge tracks, Barrel and Endcap towers within r=0.7 for photon and gamma
Figure 13: Number of charged track associated with photon candidate

Figure 14: Number of Barrel towers associated with photon candidate
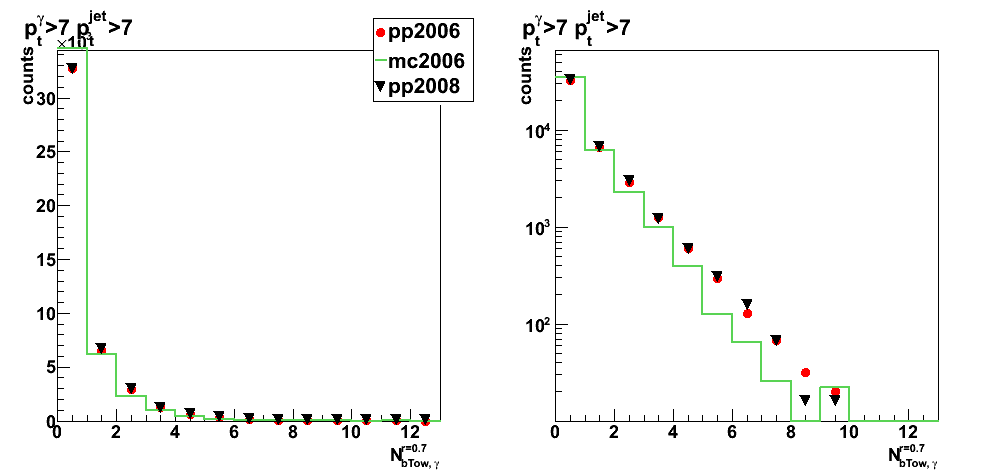
Figure 15: Number of Endcap towers associated with photon candidate
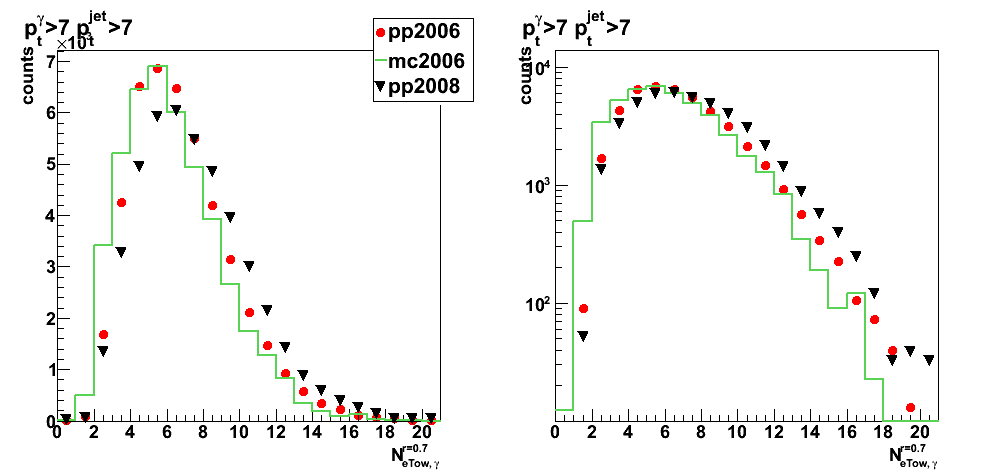
Jet energy composition
Figure 16: Jet energy part from Barrel towers
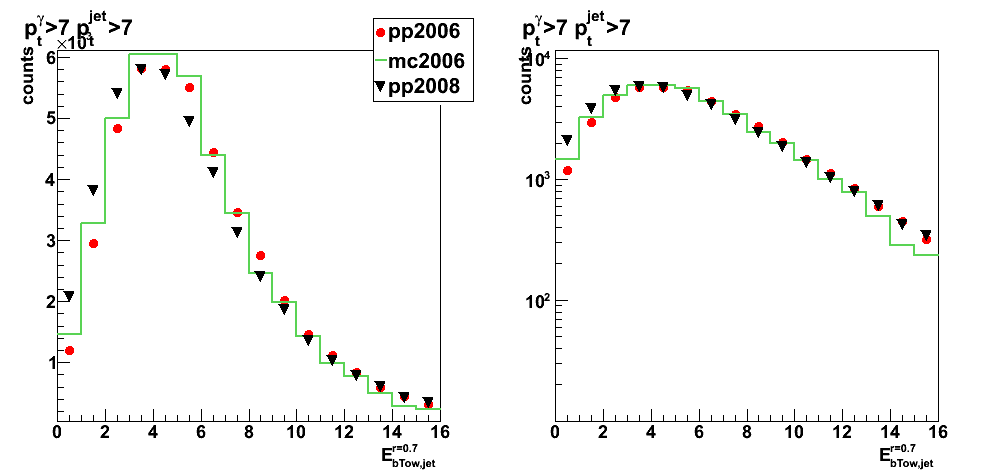
Figure 17: Jet energy part from charge tracks
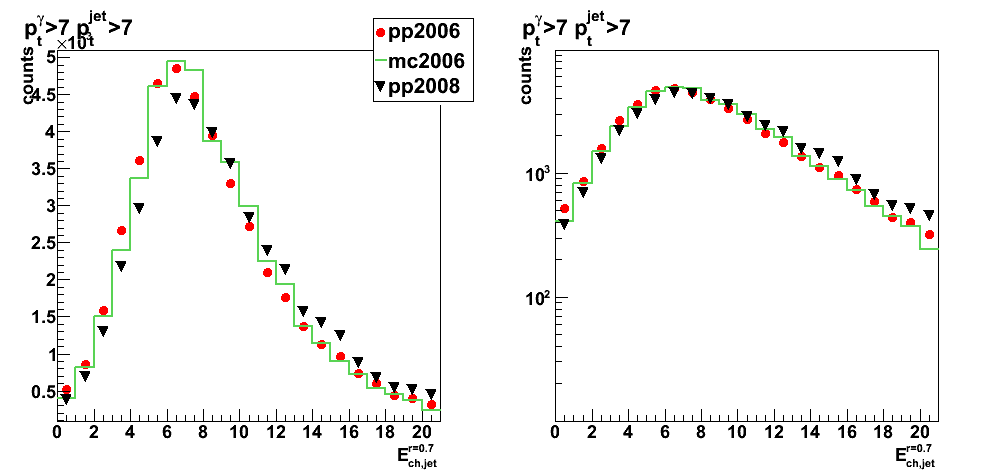
2009.02.16 pt_jet>5GeV: pre-shower sorting with new normalization
Ilya Selyuzhenkov February 16, 2009
Data sets
- pp2006 - STAR 2006 pp longitudinal data (~ 3.164 pb^1)
Trigger: eemc-http-mb-L2gamma [id:137641] - mc2006: gamma-jet+QCD jets [p6410EemcGammaFilter] events.
- pp2008 - STAR 2008 pp data
Trigger: etot-mb-l2 [id:7]
Partonic pt range 2-25 GeV.
Cuts applied
- Di-jet events
- Require to reconstruct photon momentum (no gamma-jet isolation cuts)
- Gamma pt > 7GeV, jet pt > 7GeV
- L2gamma emulation in Monte-Carlo
- L2gamma triggered for pp2006 and pp2008 events
- cos (phi_jet - phi_gamma) < -0.8
- detector |eta_jet|< 0.8
- |v_z| < 100
Figures
Each figure has:
- pp2008 data scaled to match the integraled yield from pp2006 data
- mc2006 stand for MC sum: QCD + gamma-jet
Monte-Carlo results for QCD and gamma-jet samples are first
scaled to 3.164 pb^-1 according to Pythia luminosity,
added together, and then an additional fudge factor of 1.24 applied.
Fudge factor is defined as pp2006 to Monte-Carlo sum ratio
for pt_jet>7GeV and pt_gamma>7 candidates
plots for pt_gamma>7GeV, pt_jet > 5GeV
- All pre-shower combined: 1D distributions
- All pre-shower combined: 2D correlations
- Pre-shower sorting 1D distributions
2009.02.19 Photon-jet analysis status update for Spin PWG
Photon-jet analysis status update for Spin PWG (February 19, 2009)
Slides: download pdf
Link for CIPANP abstract
CIPANP 2009 abstract on photon-jet measurement
CIPANP 2009 abstract on photon-jet study
Title:
"Photon-jet coincidence measurements
in polarized pp collisions at sqrt{s}=200GeV
with the STAR Endcap Calorimeter"
Abstract: download pdf
Previous versions: v1, v2, v3, v4
Conference link: CIPANP 2009
03 Mar
March 2009 posts
2009.03.02 Application of the neural network for the cut optimization (zero try)
Multilayer perceptron (feedforward neural networks)
Multilayer perceptron (MLP) is feedforward neural networks
trained with the standard backpropagation algorithm.
They are supervised networks so they require a desired response to be trained.
They learn how to transform input data into a desired response,
so they are widely used for pattern classification.
With one or two hidden layers, they can approximate virtually any input-output map.
They have been shown to approximate the performance of optimal statistical classifiers in difficult problems.
ROOT implementation for Multilayer perceptron
TMultiLayerPerceptron class in ROOT
mlpHiggs.C example
Application for cuts optimization in the gamma-jet analysis
Netwrok structure:
r3x3, (pt_gamma-pt_jet)/pt_gamma, nCharge, bBtow, eTow2x1: 10 hidden layers: one output later
Figure 1:
- Upper left: Learning curve (error vs. number of training)
Learing method is: Steepest descent with fixed step size (batch learning) - Upper right: Differences (how important are initial variableles for signal/background separation)
- Lower left: Network structure (ling thinkness corresponds to relative weight value)
- Lower right: Network output. Red - MC gamma-jets, blue QCD background, black pp2006 data
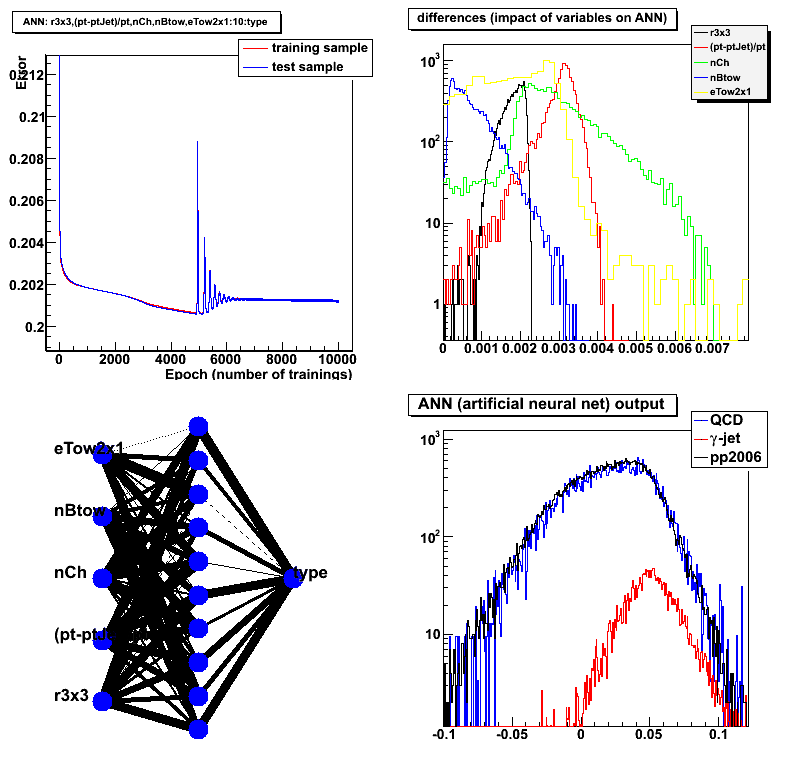
Figure 2: Input parameters vs. network output
Row: 1: MC QCD, 2: gamma-jet, 3 pp2006 data
Vertical axis: r3x3, (pt_gamma-pt_jet)/pt_gamma, nCharge, bBtow, eTow2x1
Horisontal axis: network output
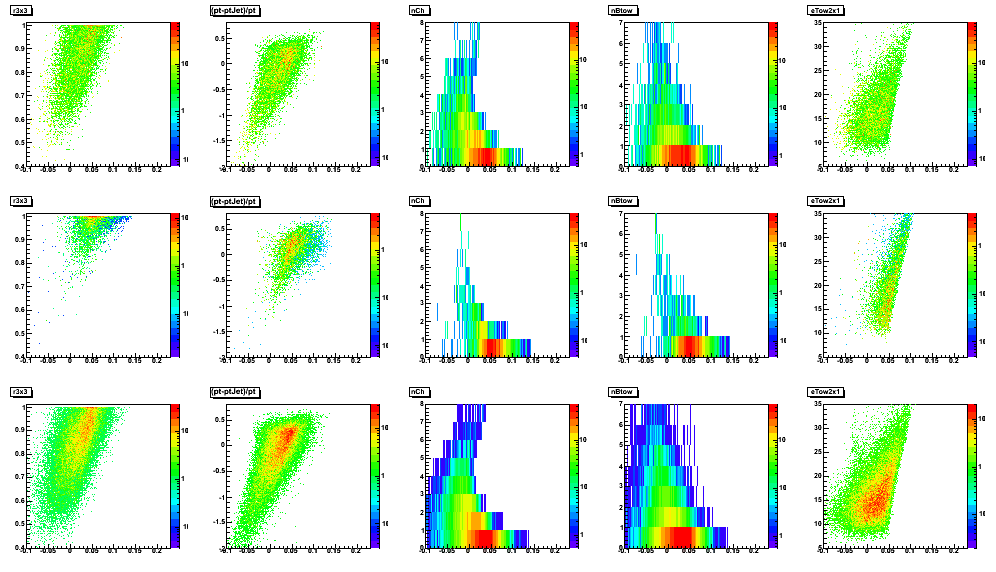
Figure 3: Same as Fig. 2 on a linear scale
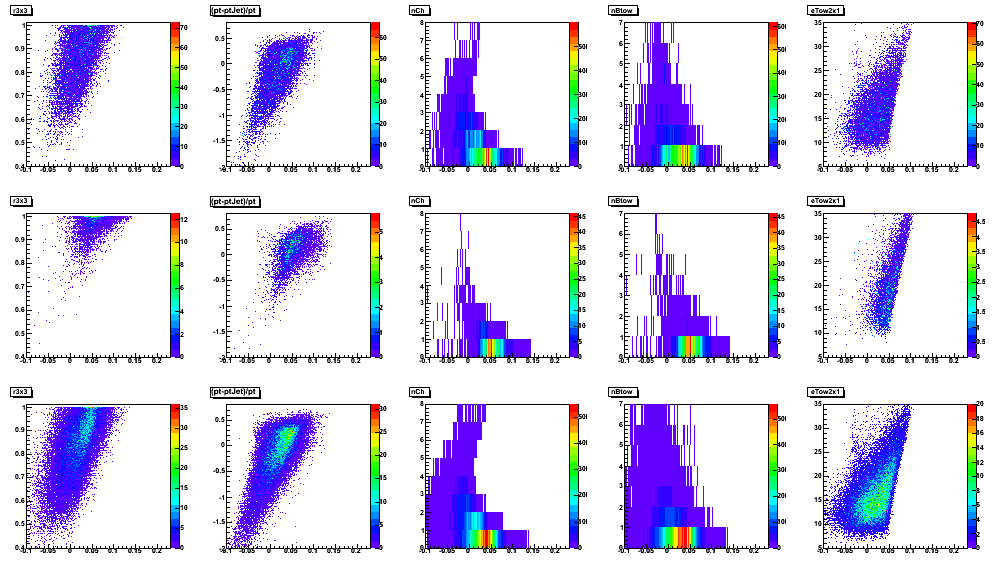
2009.03.09 Application of the LDA and MLP classifiers for the cut optimization
Cut optimization with Fisher's LDA and MLP (neural network) classifiers
ROOT implementation for LDA and MLP:
- Fisher's Linear Discriminant Analysis (LDA)
- Multi-Layer Perceptron (MLP) [feed-forward neural network]
Application for cuts optimization in the gamma-jet analysis
LDA configuration: default
MLP configuration:
- 2 hidden layers [N+1:N neural network configuration, N is number of input parameters]
- Learning method: stochastic minimization (1000 learning cycles)
Input parameters (same for both LDA and MLP):
- Energy fraction in 3x3 cluster within a r=0.7 radius: r3x3
- Photon-jet pt balance: [pt_gamma-pt_jet]/pt_gamma
- Number of charge tracks within r=0.7 around gamma candidate
- Number of Endcap towers fired within r=0.7 around gamma candidate
- Number of Barrel towers fired within r=0.7 around gamma candidate
Figure 1: Signal efficiency and purity, background rejection (left),
and significance: Sig/sqrt[Sig+Bg] (right) vs. LDA (upper plots) and MLP (lower plots) classifier discriminants

Figure 2:
- Upper left: Rejection vs. efficiency
- Upper right: Purity vs. efficiency
- Lower left: Purity vs. Rejection
- Lower right: Significance vs. efficiency
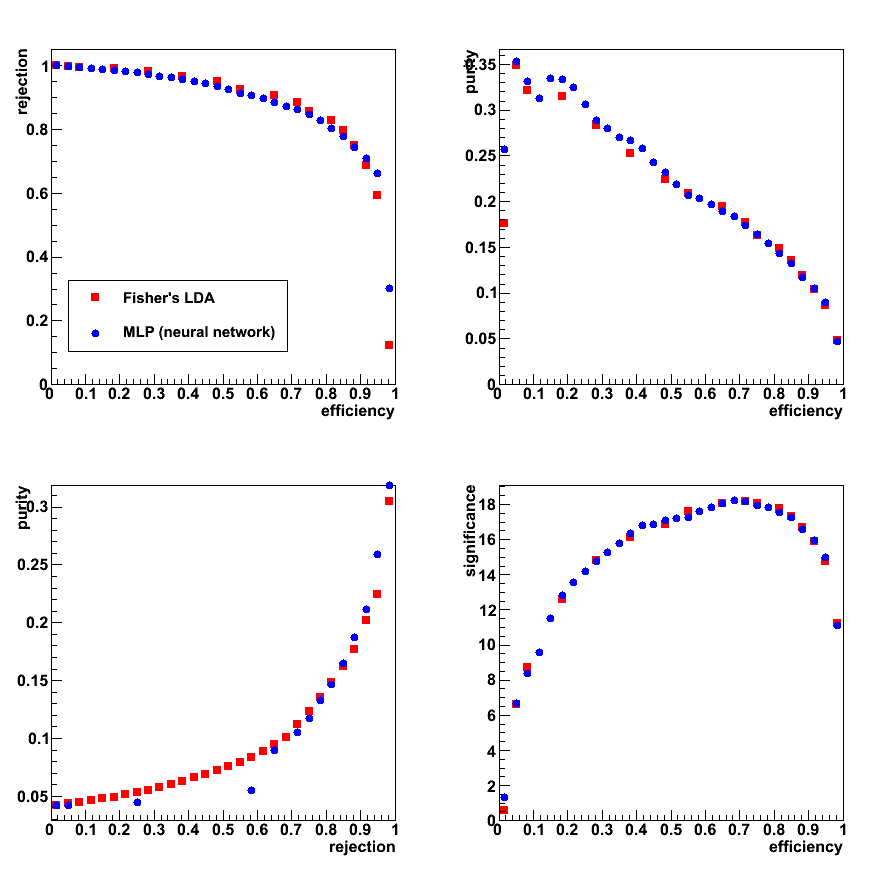
Figure 3: Data to Monte-Carlo comparison for LDA (upper plots) and MLP (lower plots)
Good (within ~ 10%) match between data nad Monte-Carlo
a) up to 0.8 for LDA discriminant, and b) up to -0.7 for MLP.
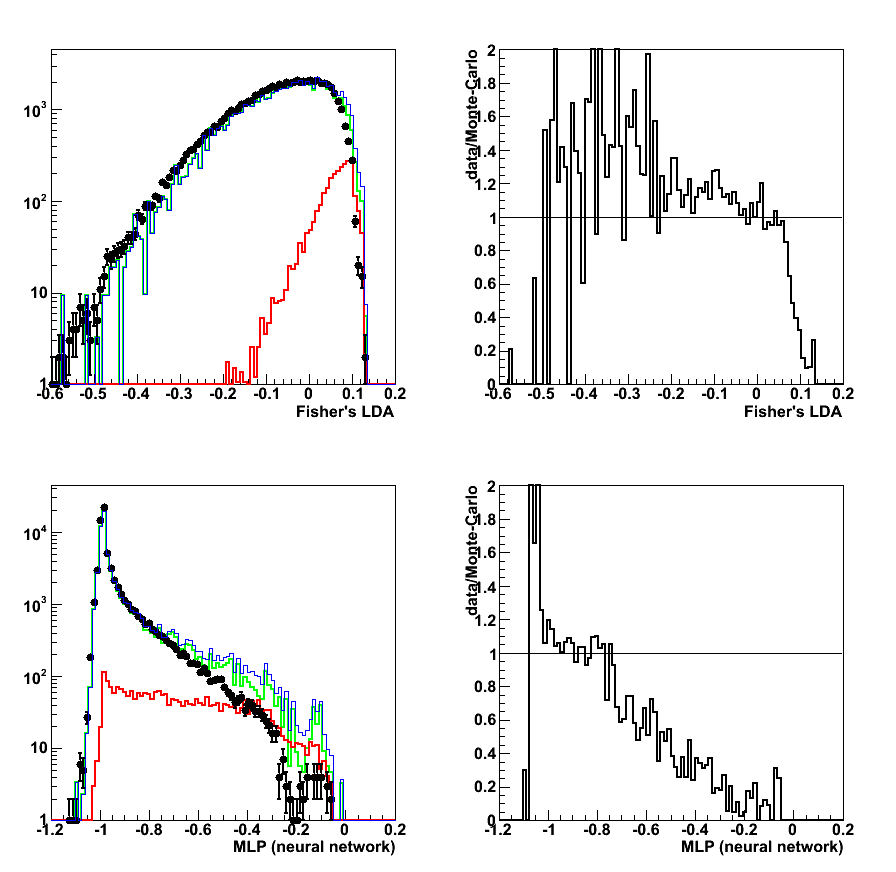
Figure 4: Data to Monte-Carlo comparison for input parameters
from left to right
1) pt_gamma 2) pt_jet 3) r3x3 4) gamma-jet pt balance 5) N_ch[gamma] 6) N_eTow[gamma] 7) N_bTow[gamma]
Colour coding: black pp2006 data, red gamma-jet MC, green QCD MC, blue gamma-jet+QCD
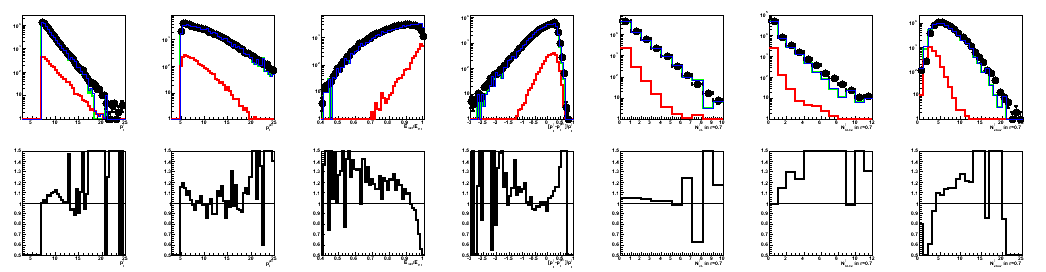
Figure 5: Data to Monte-Carlo comparison:
correlations between input variables (in the same order as in Fig. 4)
and LDA classifier discriminant (horizontal axis).
1st raw: QCD MC; 2nd: gamma-jet MC; 3rd: pp2006 data; 4th: QCD+gamma-jet MC
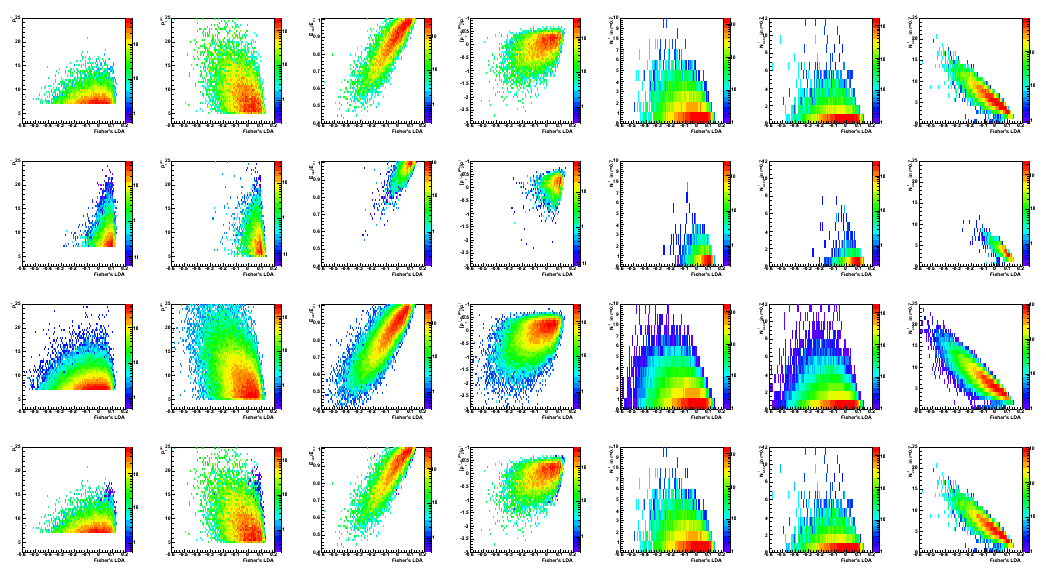
Figure 6: Same as Fig. 6 for MLP discriminant
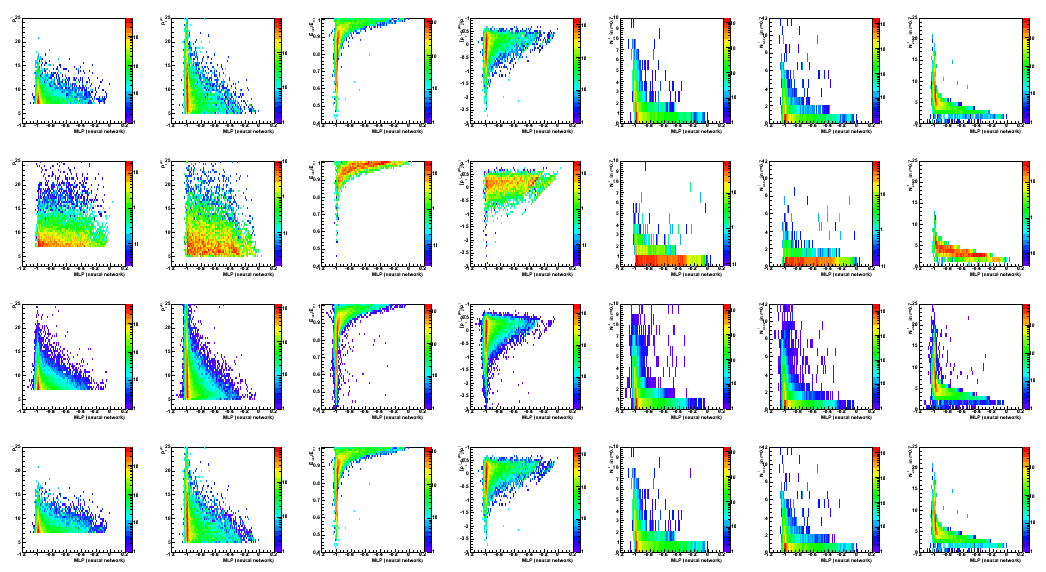
2009.03.26 Endcap photon-jet update at the STAR Collaboration meeting
Endcap photon-jet update at the STAR Collaboration meeting
04 Apr
April 2009 posts
2009.04.17 WSU nuclear seminar
The STAR spin program with longitudinally polarized proton beams
2009.04.21 Adding SMD info to the LDA
Cut optimization with Fisher's LDA classifier
ROOT implementation for LDA:
Application for cuts optimization in the gamma-jet analysis
LDA configuration: default
LDA input parameters:
- Energy fraction in 3x3 cluster within a r=0.7 radius: r3x3
- Photon-jet pt balance: [pt_gamma-pt_jet]/pt_gamma
- Number of charge tracks within r=0.7 around gamma candidate
- Number of Endcap towers fired within r=0.7 around gamma candidate
- Number of Barrel towers fired within r=0.7 around gamma candidate
Figure 1: LDA discriminant (no SMD involved in training)
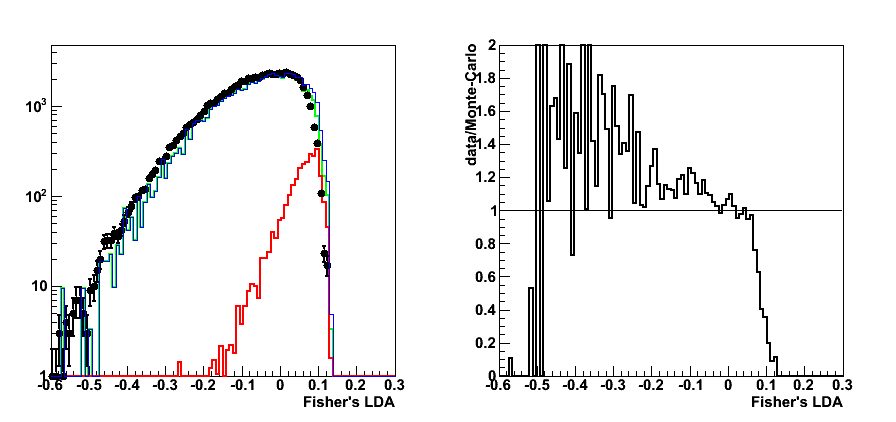
Figure 2: LDA (no SMD): Efficiency, rejection, purity vs. discriminant

Figure 3: SMD energy in 25 central strips (LDA-dsicriminant>0, no pre-shower1 cut)
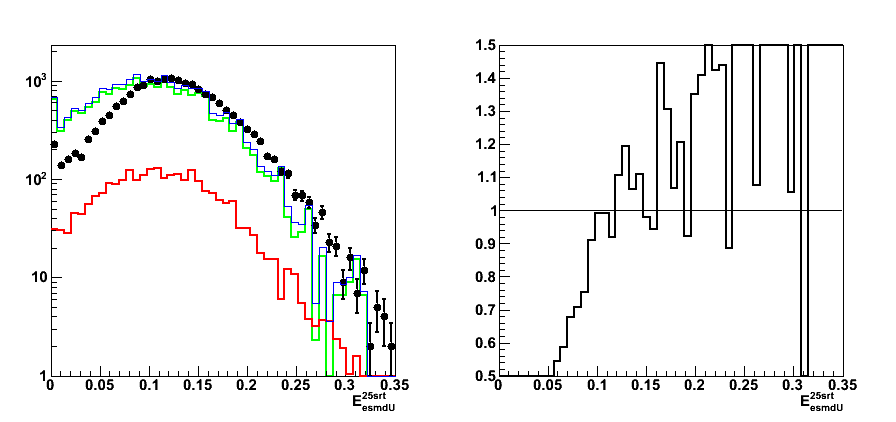
Figure 4: SMD energy in 25 central strips (LDA-dsicriminant>0, pre-shower1 < 10MeV)
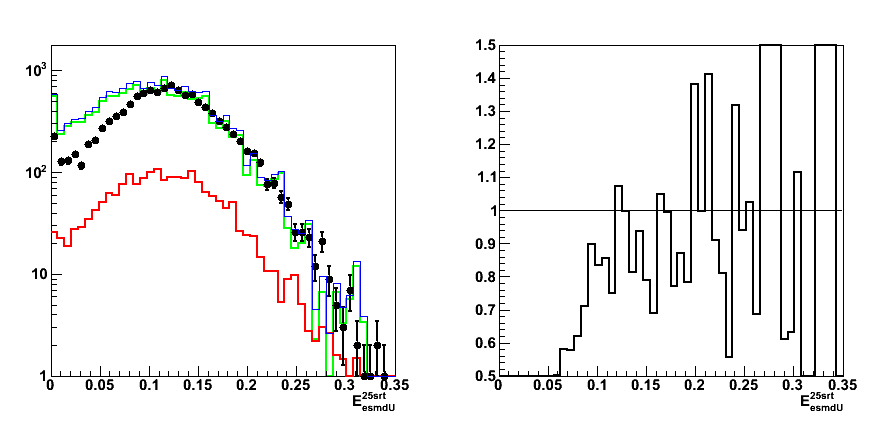
Figure 5: Maximum residual (LDA-dsicriminant>0, no pre-shower1 cut)
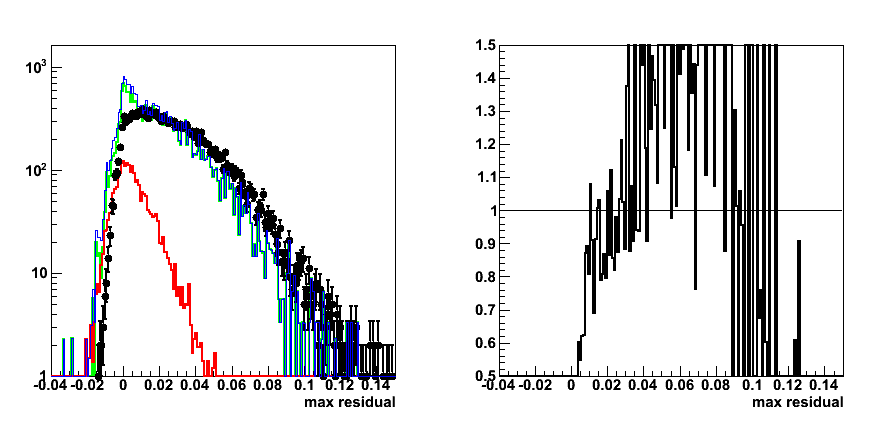
Figure 6: Maximum residual (LDA-dsicriminant>0, pre-shower1 < 10MeV)
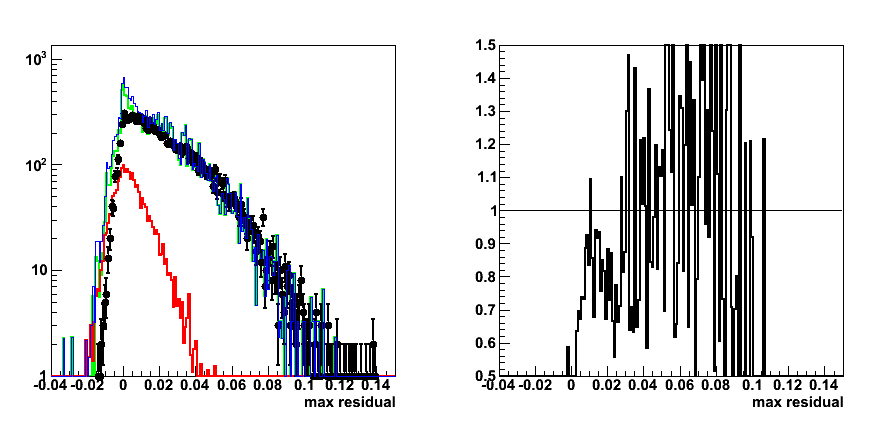
LDA+ SMD analysis
SMD info added:
a) energy in 5 central srtips
b) maximum sided residual
Figure 7:LDA with SMD: Efficiency, rejection, purity vs. LDA discriminant
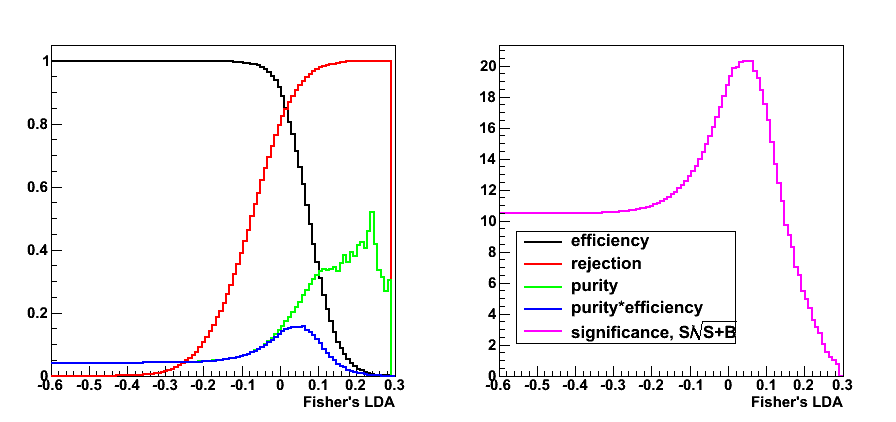
Figure 8: LDA discriminant with SMD
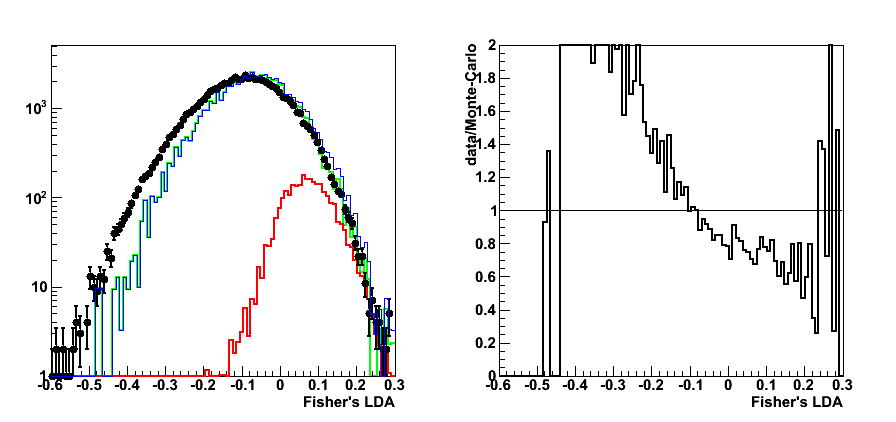
Figure 9: Maximum residual (SMD LDA-dsicriminant>0, pre-shower1 < 10MeV)
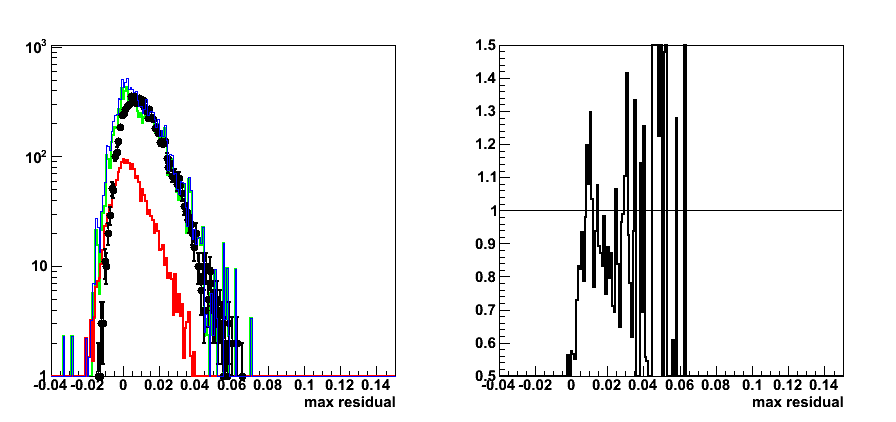
LDA with and without SMD comparison
Figure 10:LDA (no SMD): Efficiency, rejection, purity plots
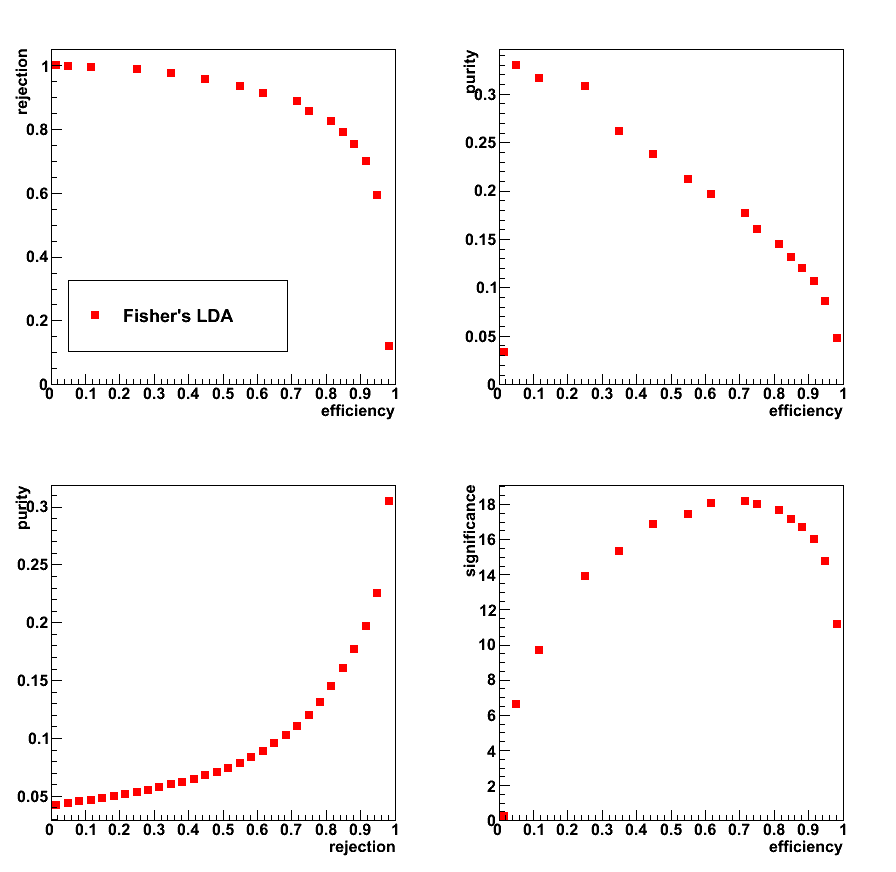
Figure 11: LDA with SMD: Efficiency, rejection, purity plots
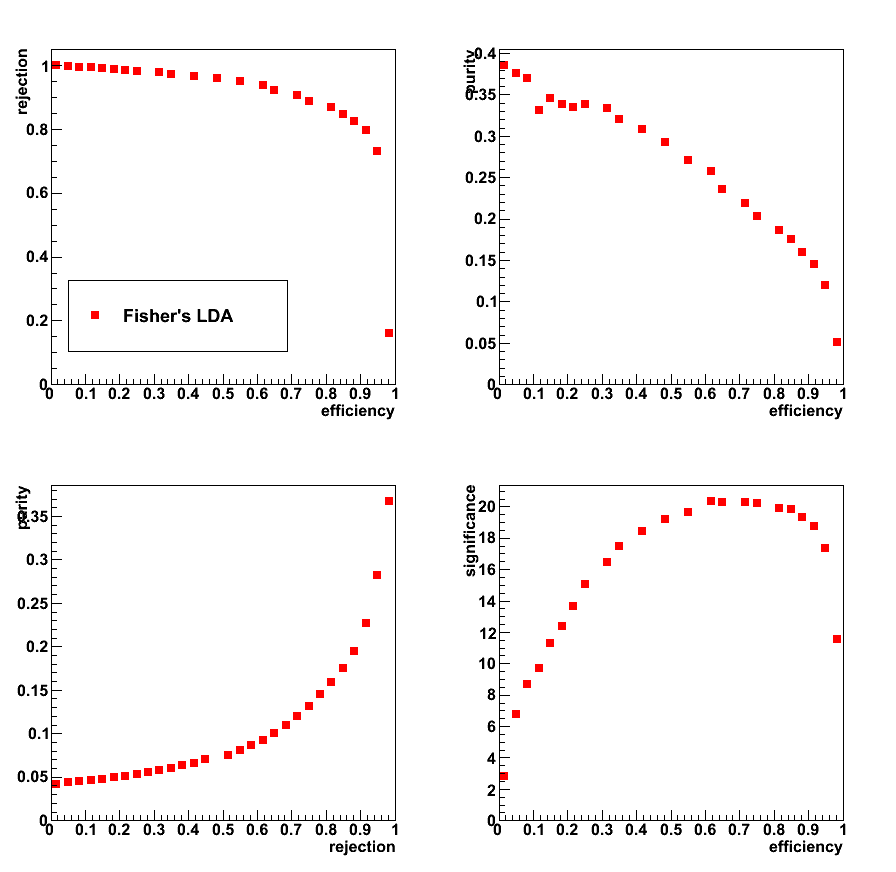
2009.04.28 LDA plus SMD analysis with pre-shower sorting
Cut optimization with Fisher's LDA classifier
ROOT implementation for LDA:
Application for cuts optimization in the gamma-jet analysis
LDA configuration: default
LDA input parameters (includes SMD inromation of the distance from max sided residual plot):
- Energy fraction in 3x3 cluster within a r=0.7 radius: r3x3
- Photon-jet pt balance: [pt_gamma-pt_jet]/pt_gamma
- Number of charge tracks within r=0.7 around gamma candidate
- Number of Endcap towers fired within r=0.7 around gamma candidate
- Number of Barrel towers fired within r=0.7 around gamma candidate
- Distance to 80% cut line (see this link for more details)
The number of strips in SMD u or v planes is required to be greater than 3
Figure 1: SMD energy in 25 central strips sorted by pre-shower energy
- Upper left: pre1=0, pre2=0
- Upper right: pre1=0, pre2>0
- Lower left: 0<4MeV
- Lower right: 4<10MeV
Right plot for each pre-shower condition shows the ratio of pp2006 data to sum of the Monte-Carlo samples
Colour coding:
black pp2006 data, red gamma-jet MC, green QCD MC, blue gamma-jet+QCD
(combined plot for all pre-shoer bins can be found here)
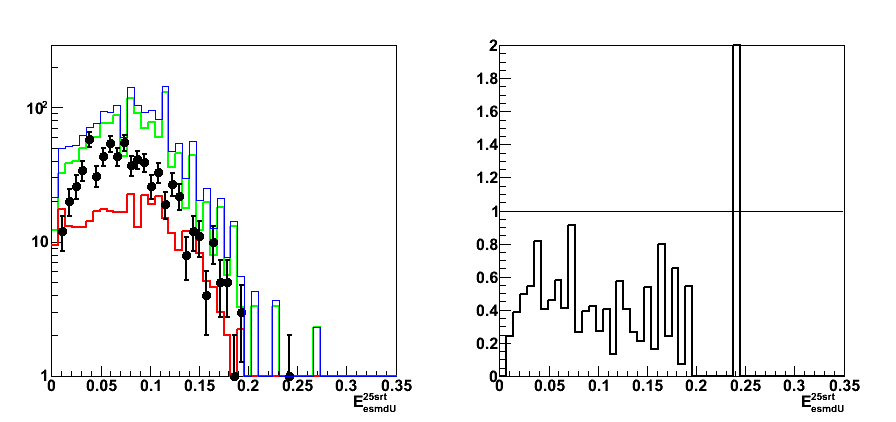
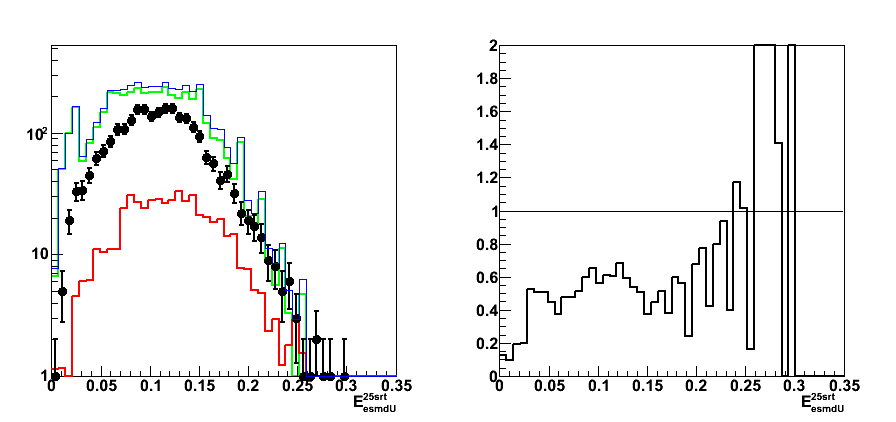
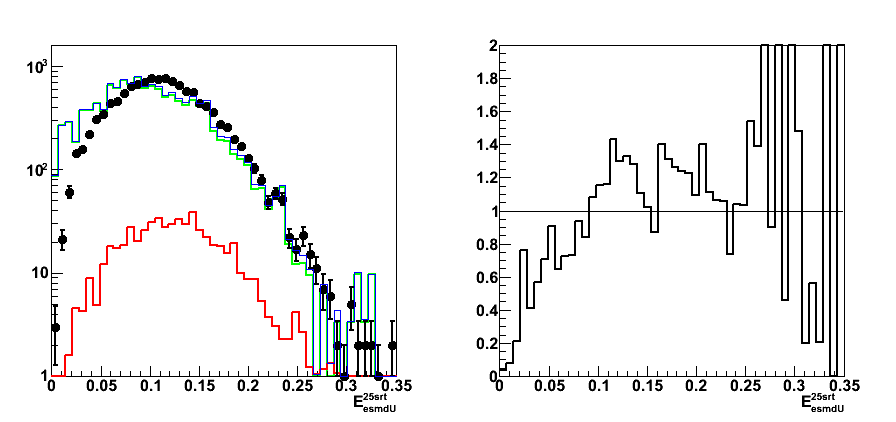
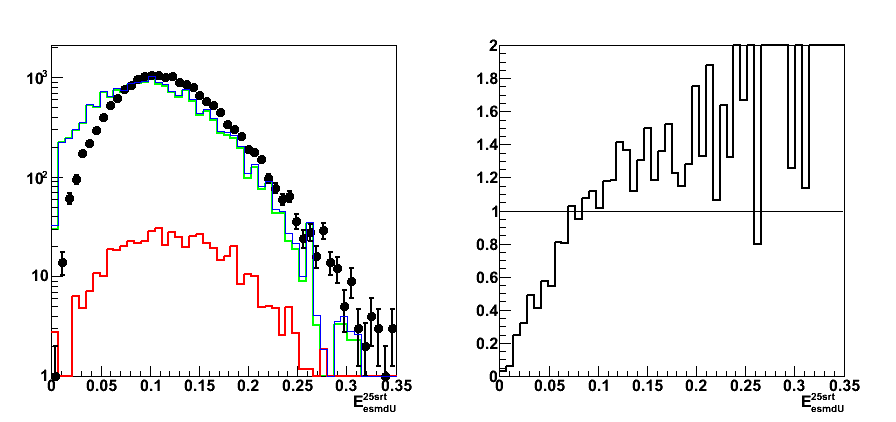
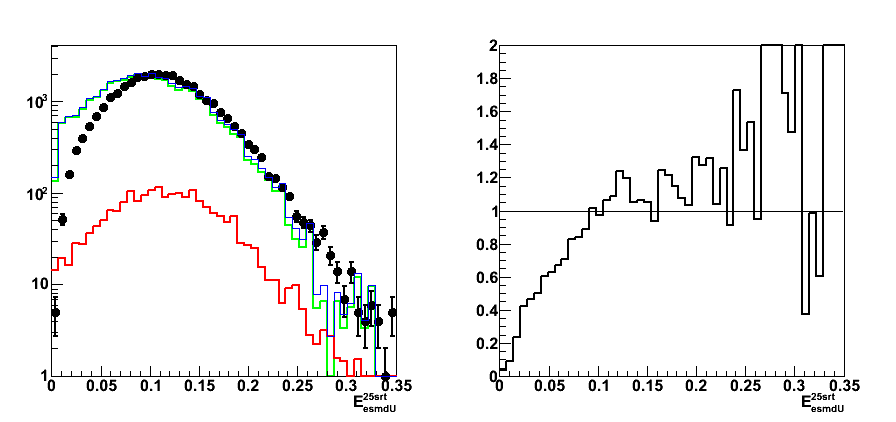
Figure 2: SMD energy in 5 central strips sorted by pre-shower energy
(combined plot can be found here)
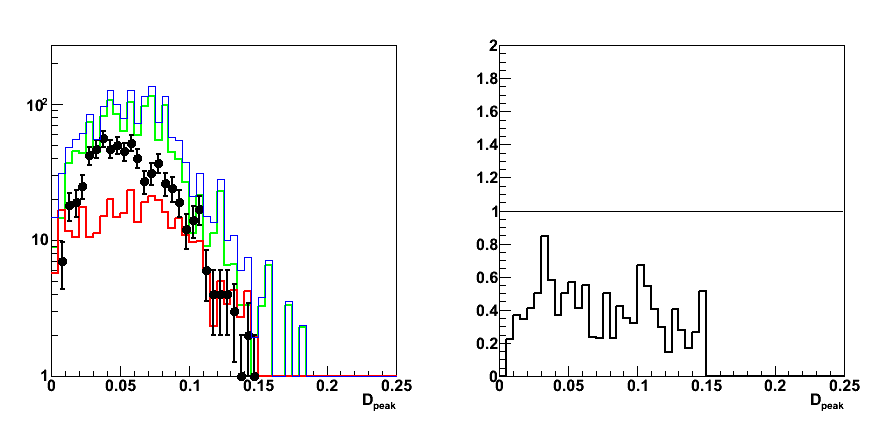
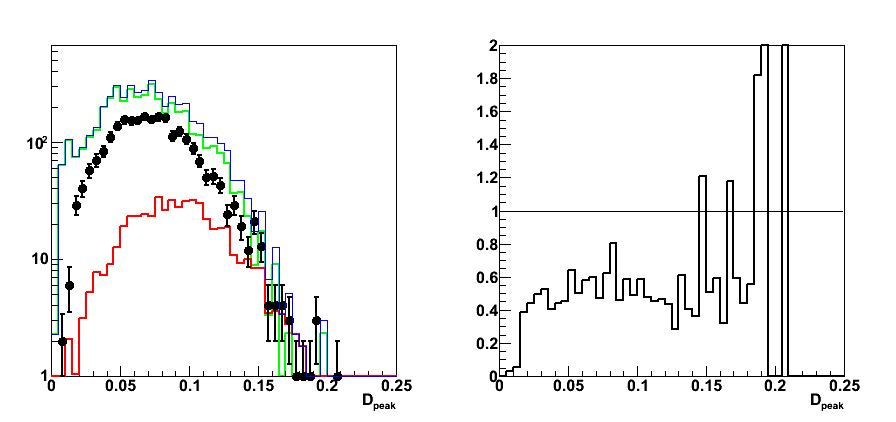


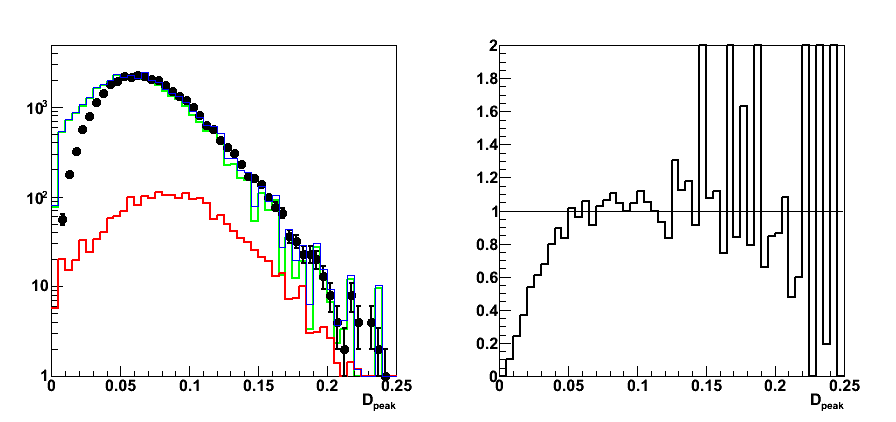
Figure 3: Maximum residual sorted by pre-shower energy
(combined plot can be found here)
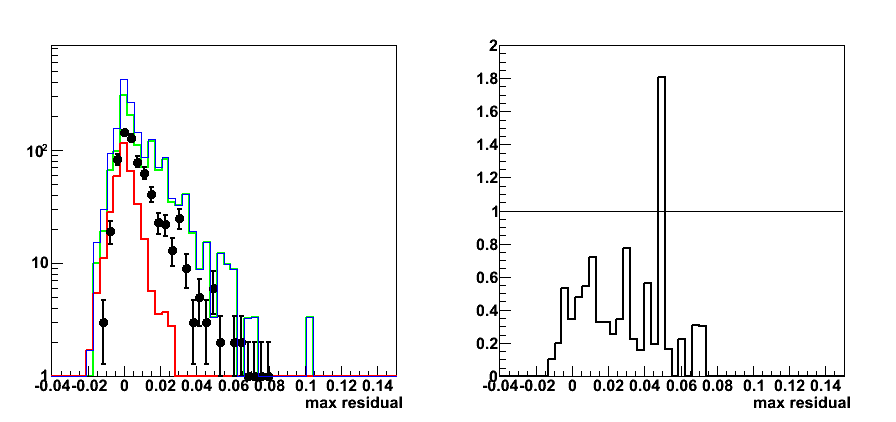
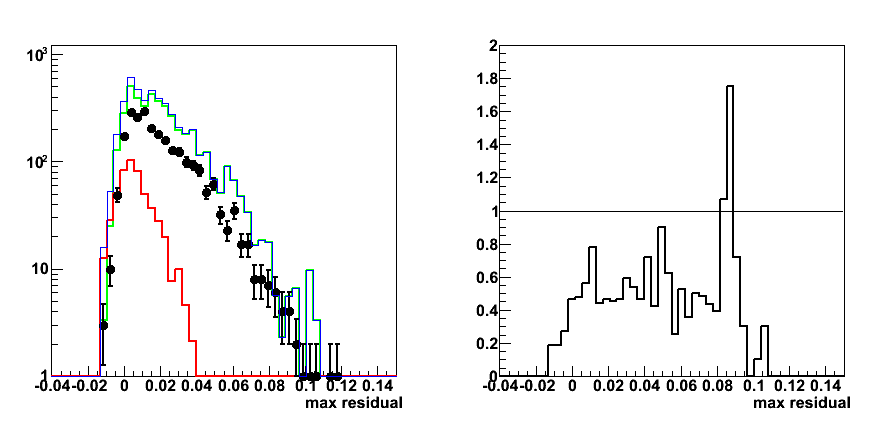

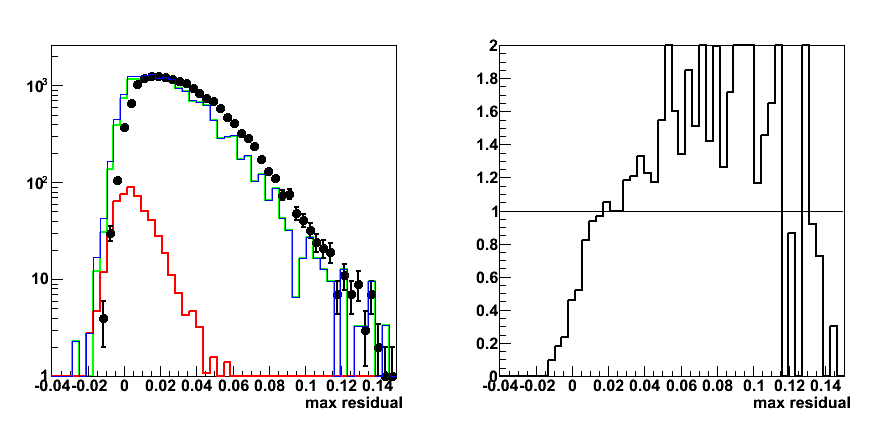
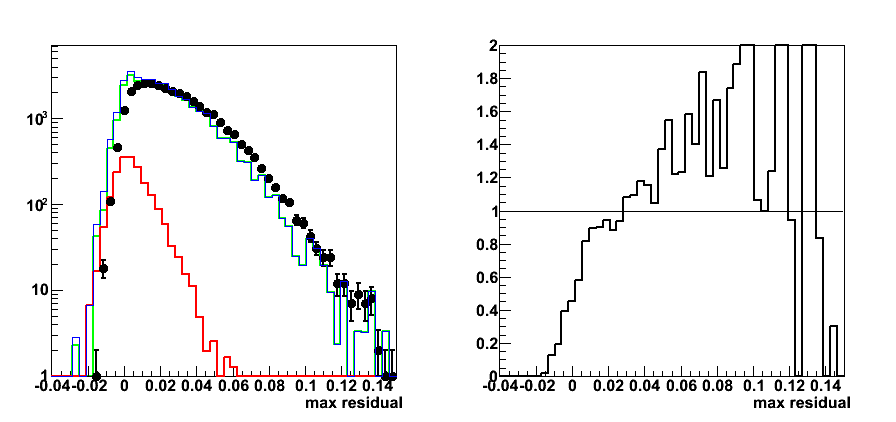
Figure 4: LDA discriminant. Note: LDA algo trained for each pre-shower condition independently


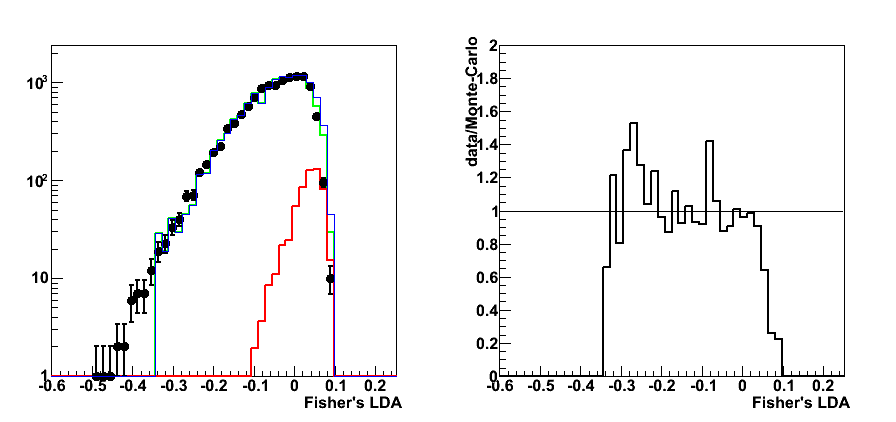

Figure 5: LDA: Efficiency, rejection, purity vs. discriminant, sorted by pre-shower energy
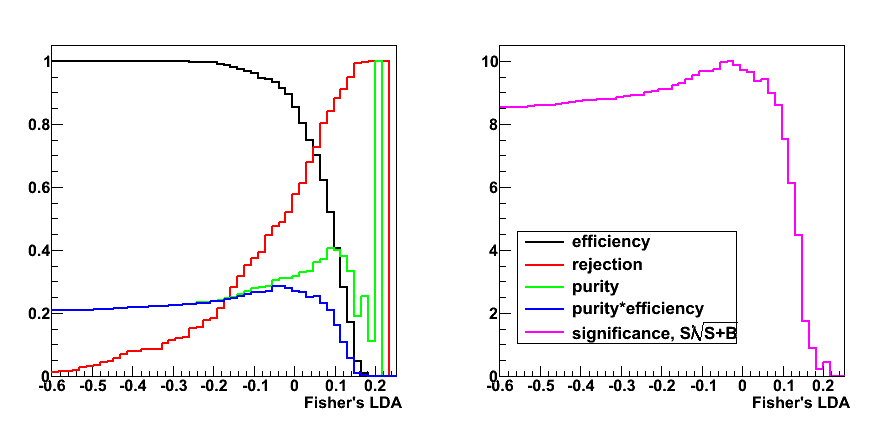


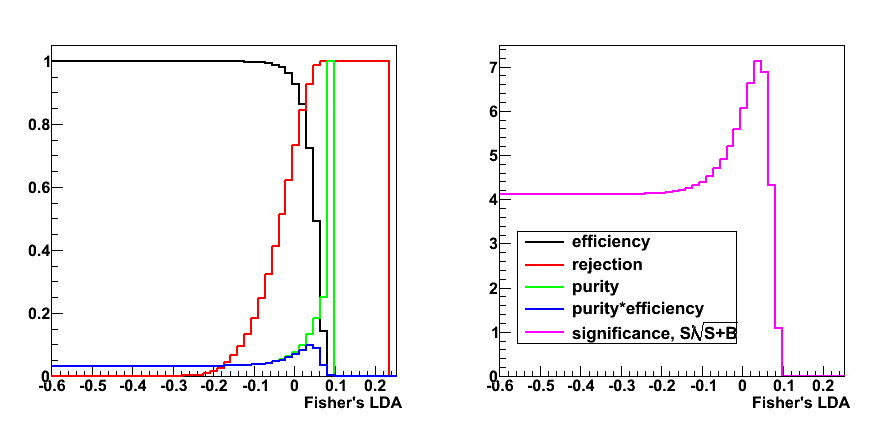
Figure 6: LDA: Efficiency, rejection, purity plots sorted by pre-shower energy
For each pre-shower condition each plot has 4 figures:
- u-left: rejection vs. efficiency
- u-right: purity vs. efficiency
- l-left: purity vs. rejection
- l-right: significance (signal/sqrt{signal+background}) vs. efficiency
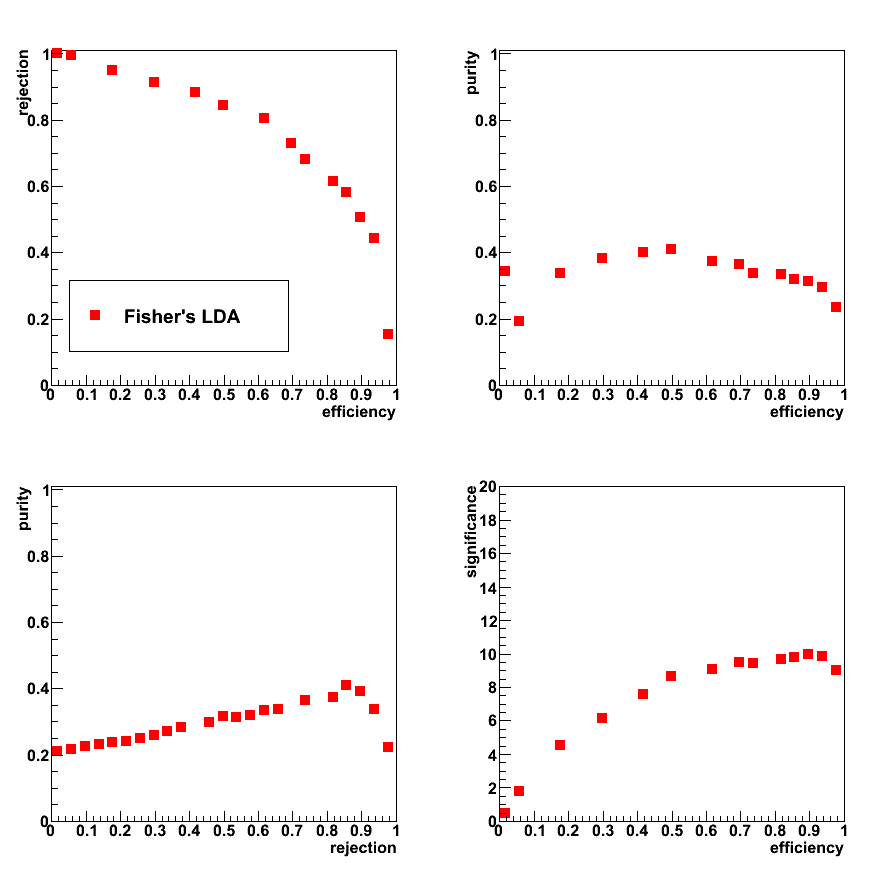
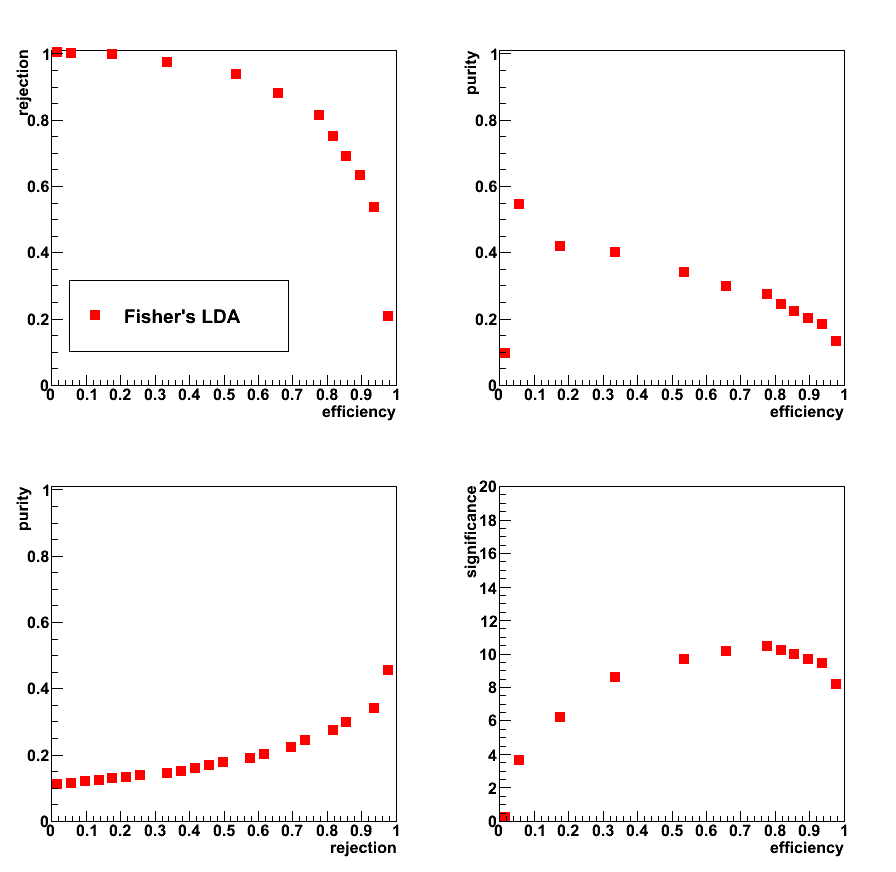
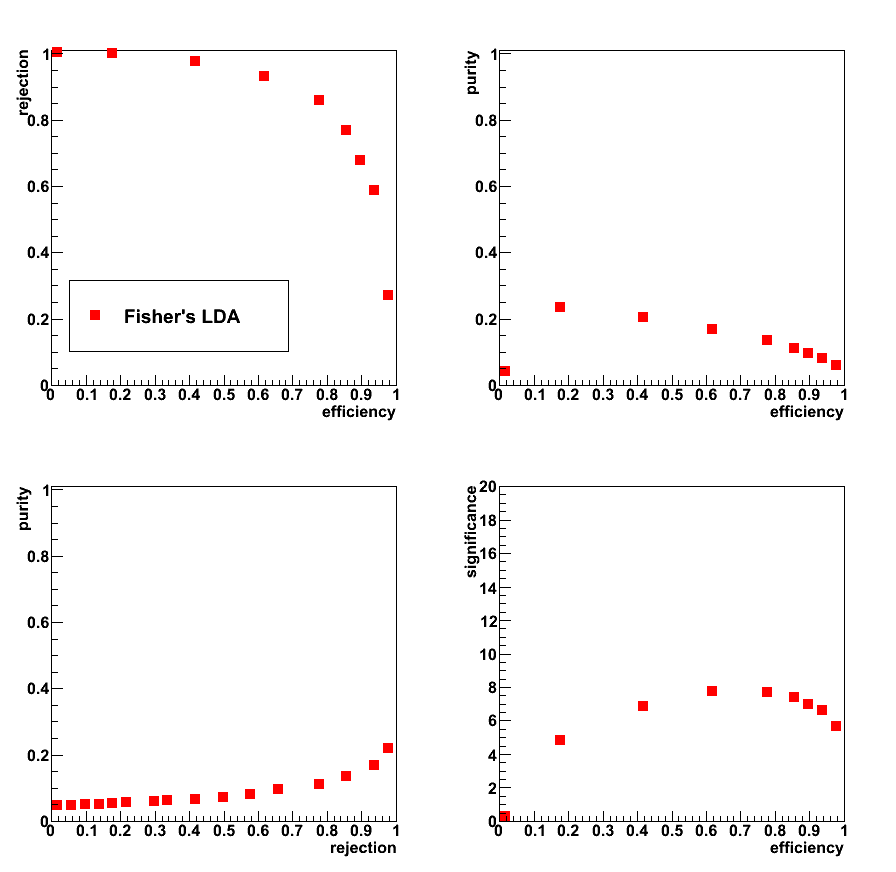
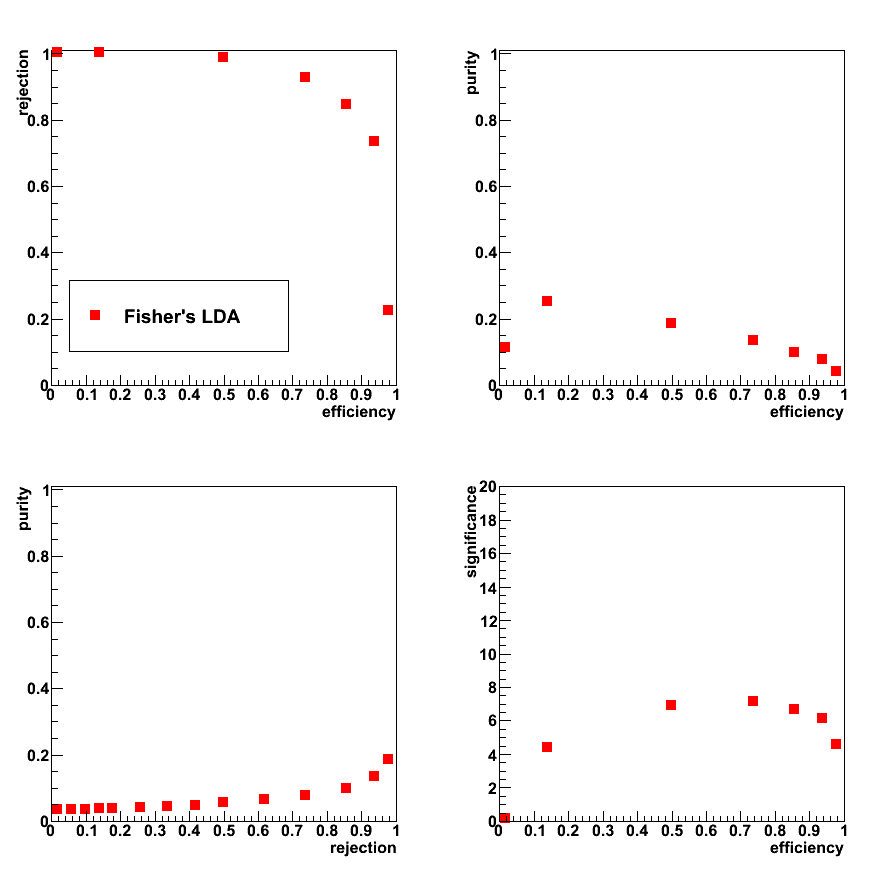
05 May
May 2009 posts
2009.05.03 LDA: varying pt and eta cut
Cut optimization with Fisher's LDA classifier
ROOT implementation for LDA:
Application for cuts optimization in the gamma-jet analysis
LDA configuration: default
LDA input parameters Set0:
- Set0:
- Energy fraction in 3x3 cluster within a r=0.7 radius:
E_3x3/E_0.7 - Photon-jet pt balance:
[pt_gamma-pt_jet]/pt_gamma - Number of charge tracks within r=0.7 around gamma candidate:
Ncharge - Number of Endcap towersL fired within r=0.7 around gamma candidate:
NtowBarrel - Number of Barrel towers fired within r=0.7 around gamma candidate
NtowEndcap
- Energy fraction in 3x3 cluster within a r=0.7 radius:
- Set1:
- All from Set0
- Shower shape analysis: distance to 80% cut line:
distance to cut line
- Set2:
- All from Set1
- Energy fraction in E_2x1 and E_2x2 witin E_3x3:
E_2x1/E_2x2 and E_2x2/E_3x3
- Set3:
- All from Set2
- Energy in post-shower layer under 3x3 tower patch:
E_post^3x3
The number of strips in SMD u or v planes is required to be greater than 3
Pre-shower sorting (energy in tiles under 3x3 tower patch):
- pre1=0, pre2=0
- pre1=0, pre2>0
- 0 < pre1 < 0.004
- 0.004 < pre1 < 0.01
- pre1 < 0.01
- pre1 >= 0.01
Photon pt and rapidity cuts:
- pt>7GeV
- pt>8GeV
- pt>9GeV
- pt>10GeV
- detector eta <1.4 (pt>7GeV)
- detector eta > 1.4 (pt>7GeV)
Figure 0: photon pt distribution for pre-shower1<0.01
Colour coding:
black pp2006 data, red gamma-jet MC, green QCD MC, blue gamma-jet+QCD
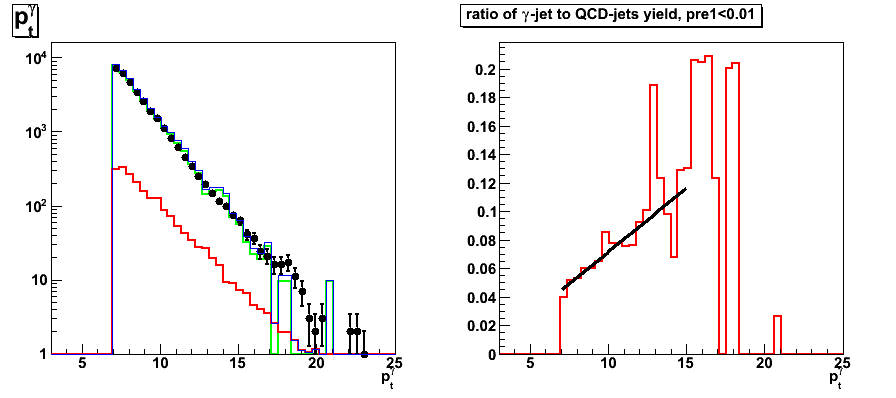
LDA Set0
Figure 1: LDA discriminant with Set0: Data to Monte-Carlo comparison (pt>7GeV cut)
Right plot for each pre-shower condition shows the ratio of pp2006 data to sum of the Monte-Carlo samples
Colour coding:
black pp2006 data, red gamma-jet MC, green QCD MC, blue gamma-jet+QCD
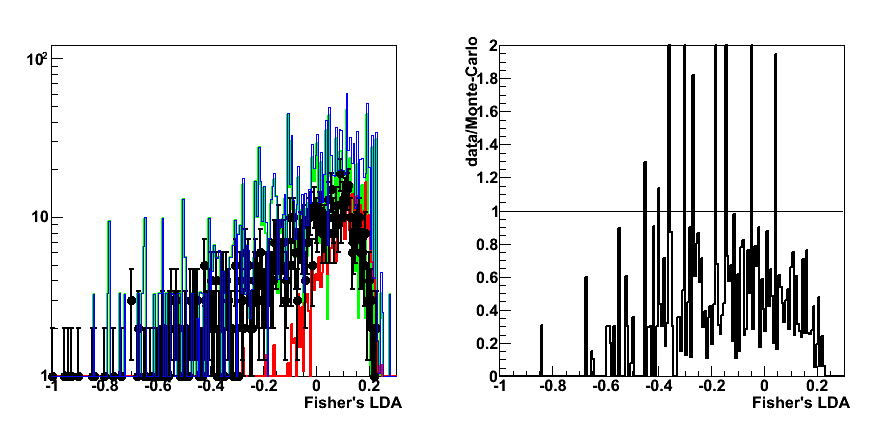
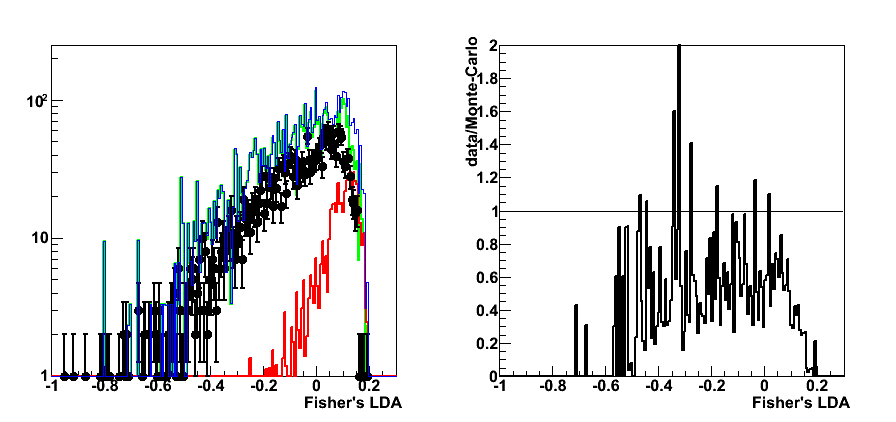
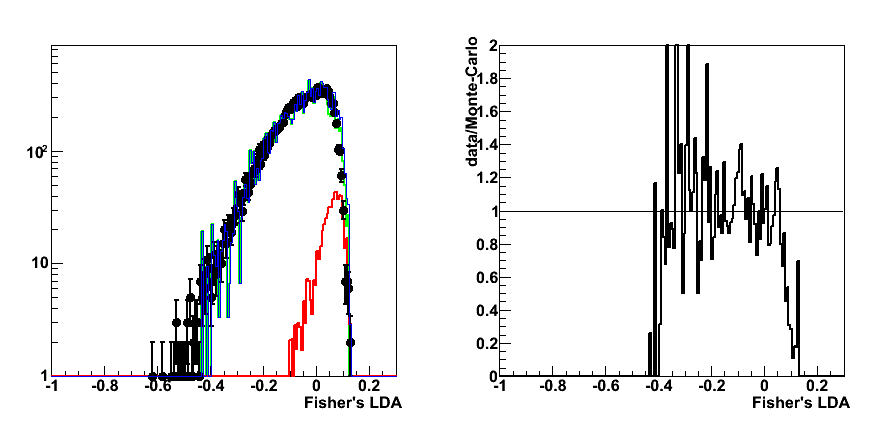
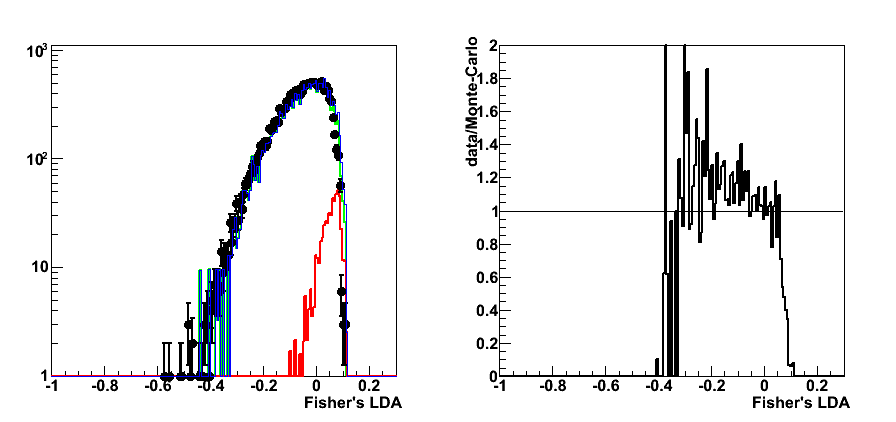
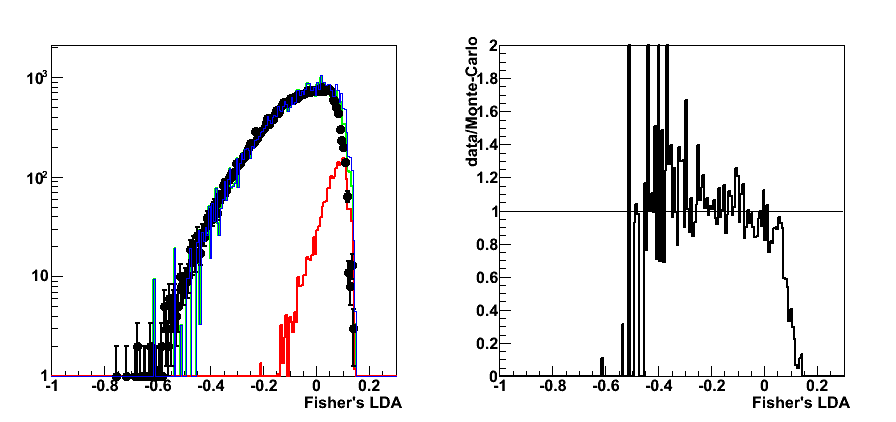
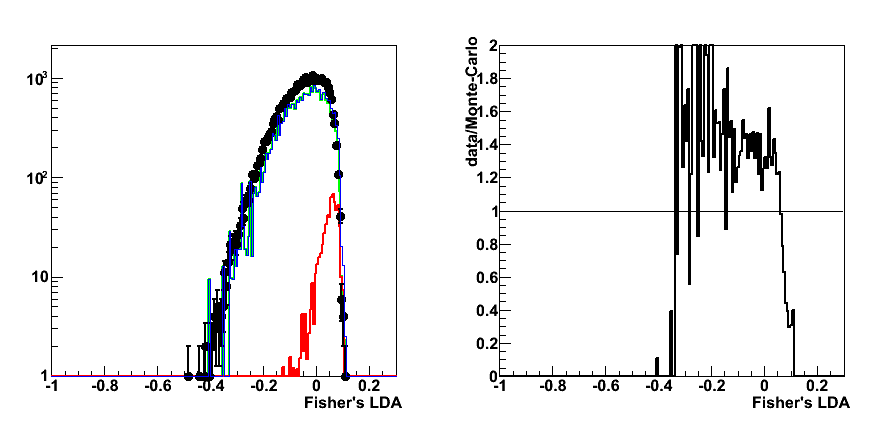
Figure 2: efficiency, purity, rejection vs. LDA discriminant (pt>7GeV cut)
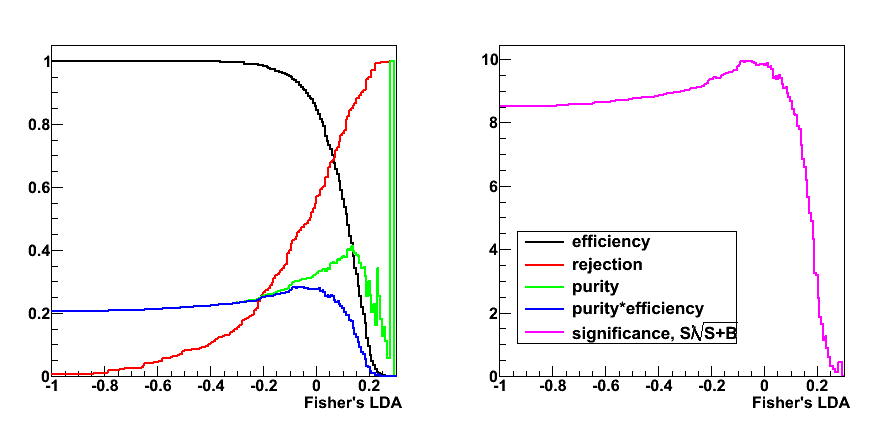
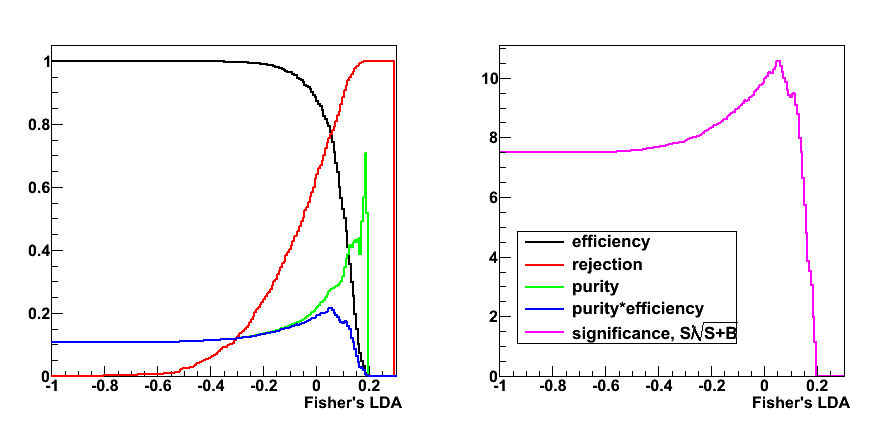

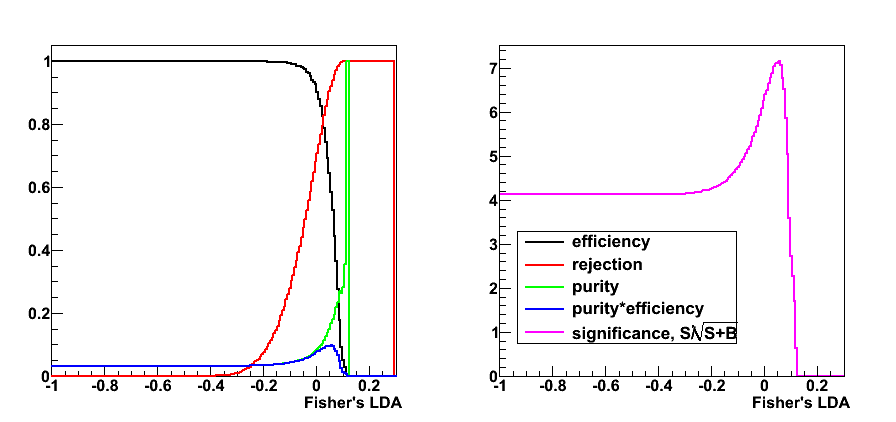
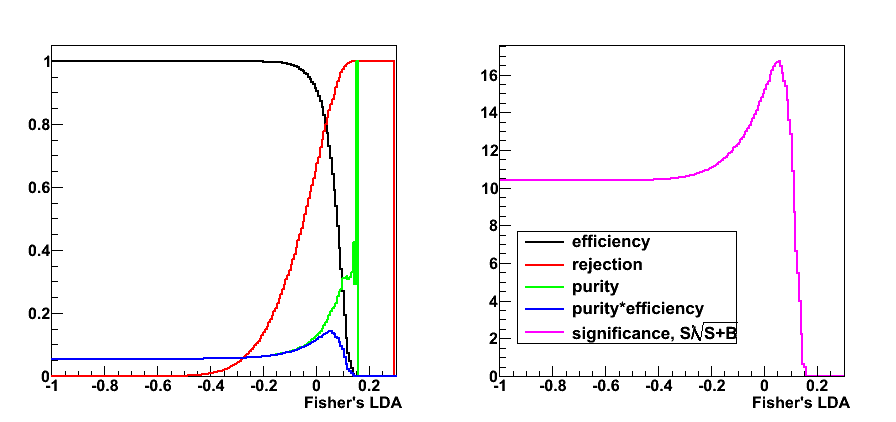
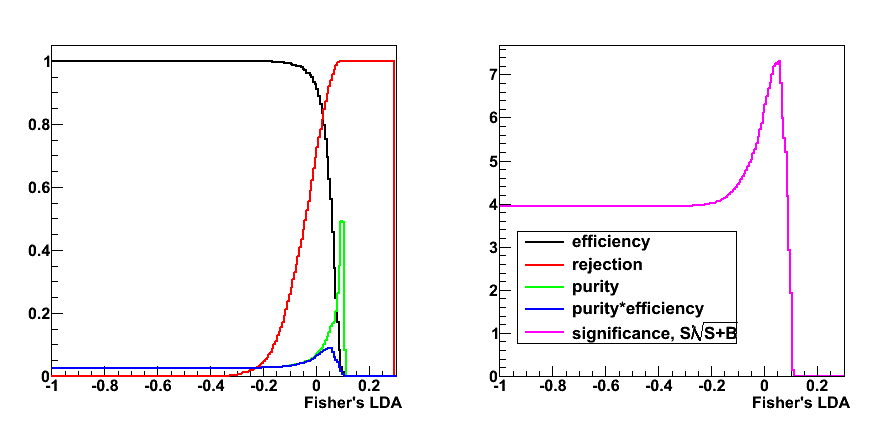
Figure 3: rejection vs. efficiency
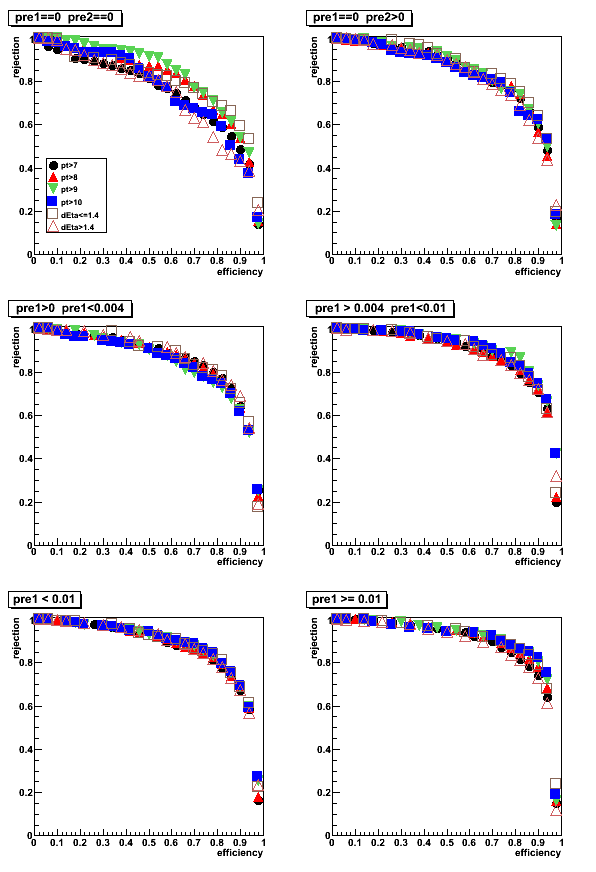
Figure 4: purity vs. efficiency
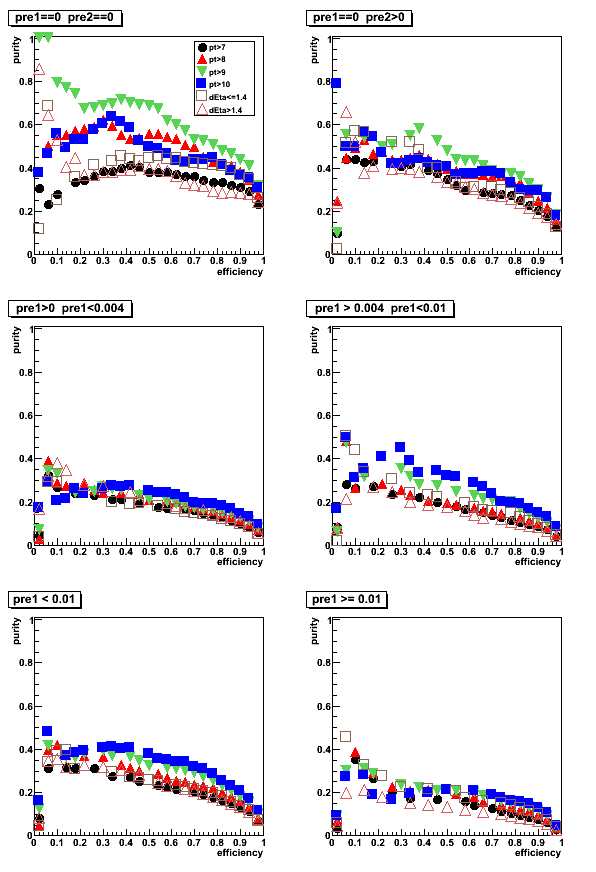
Figure 5: purity vs. rejection
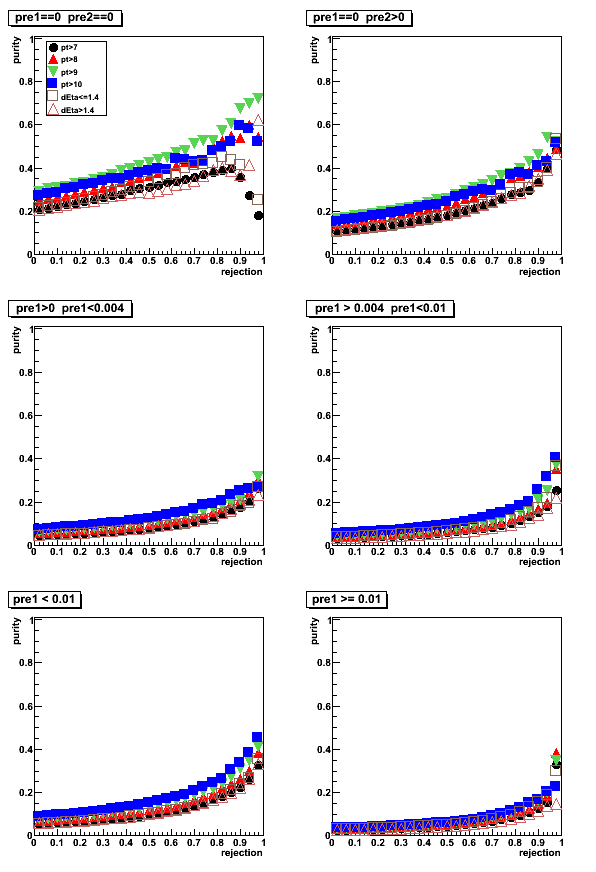
LDA Set1
Figure 6: LDA discriminant with Set1: Data to Monte-Carlo comparison
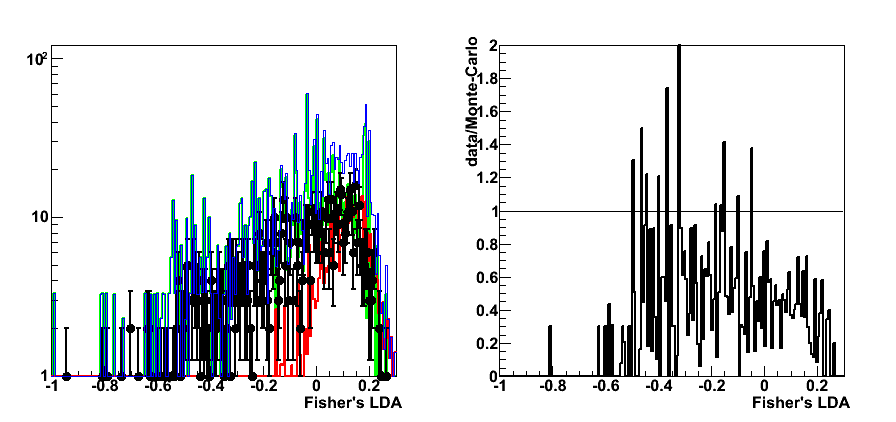
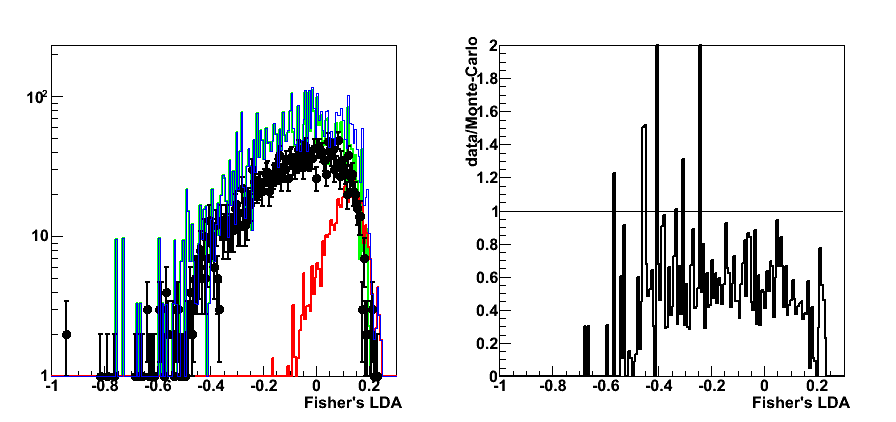
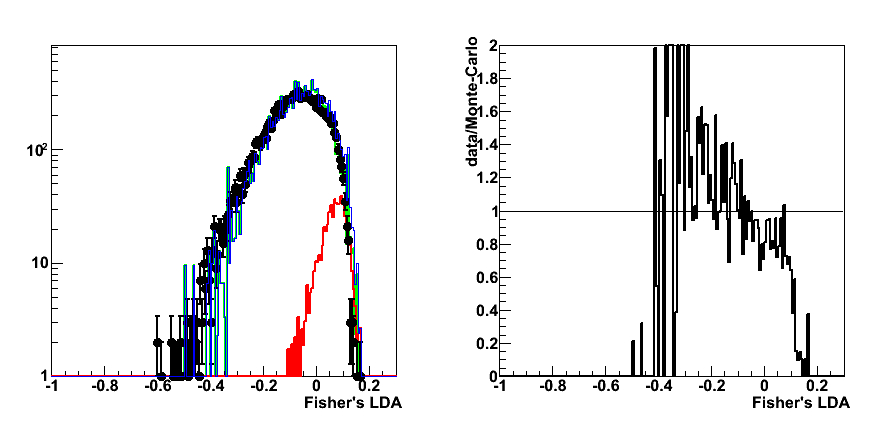
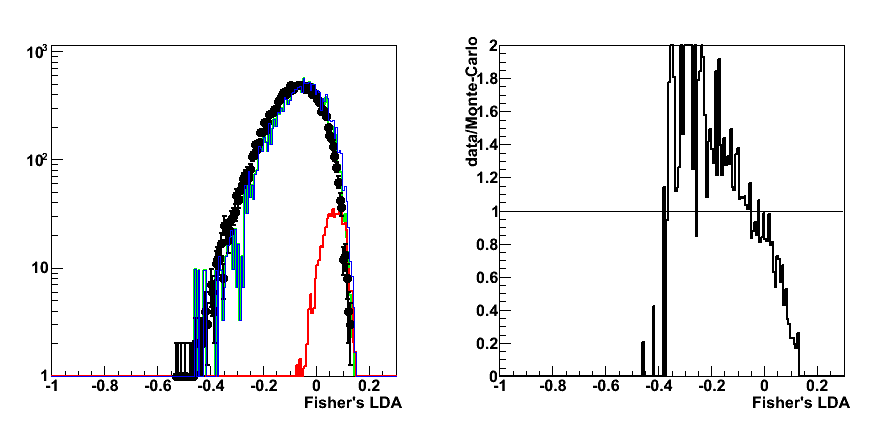
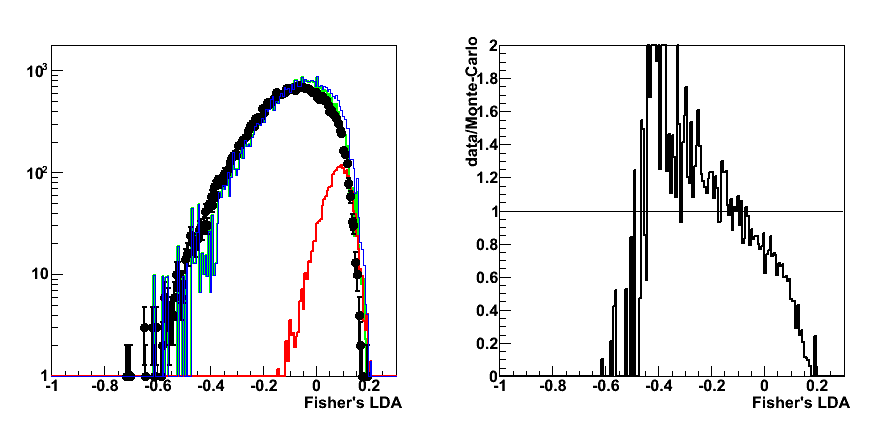
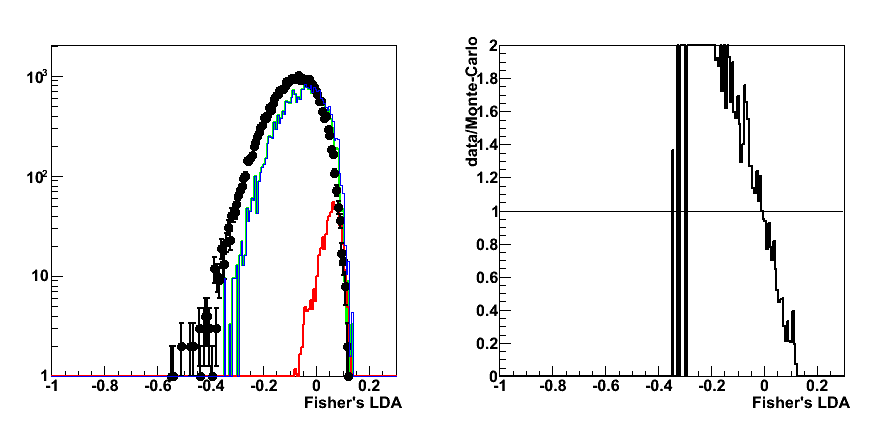
Figure 7: rejection vs. efficiency
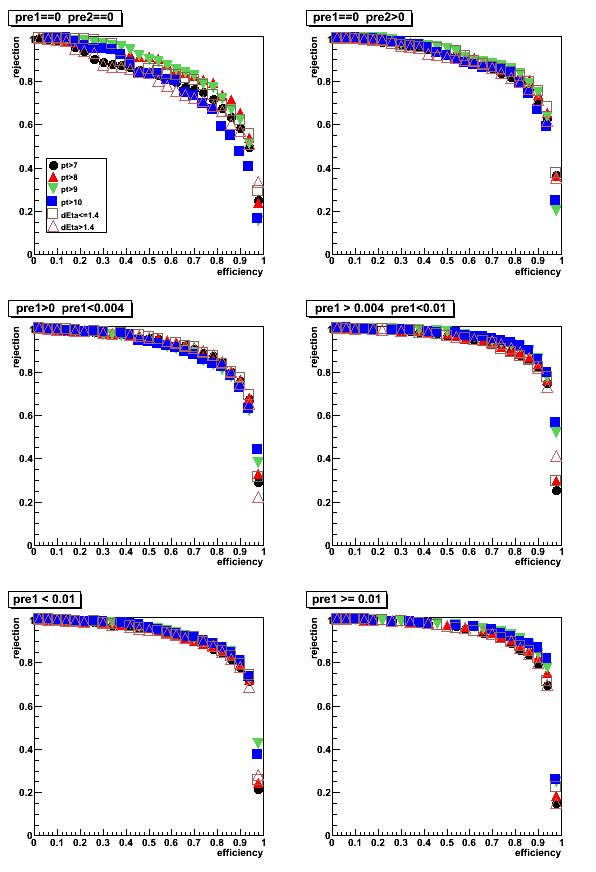
Figure 8: purity vs. efficiency
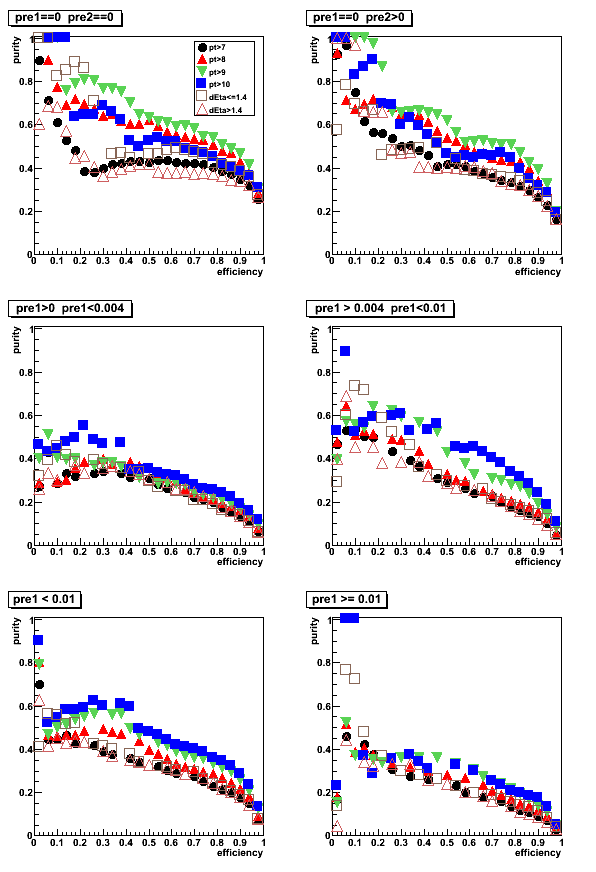
Figure 9: purity vs. rejection (click link to see the figure)
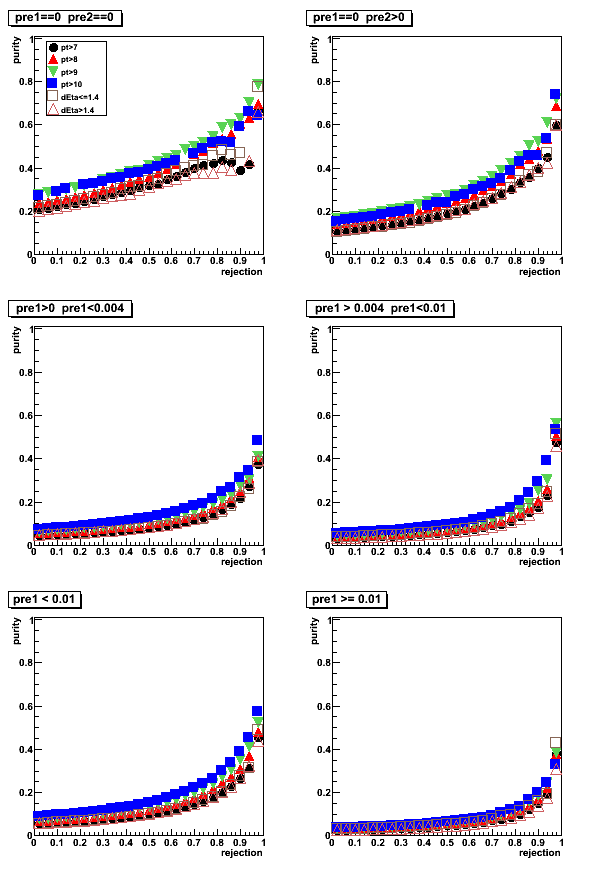
LDA Set2
Figure 10: rejection vs. efficiency (click link to see the figure)
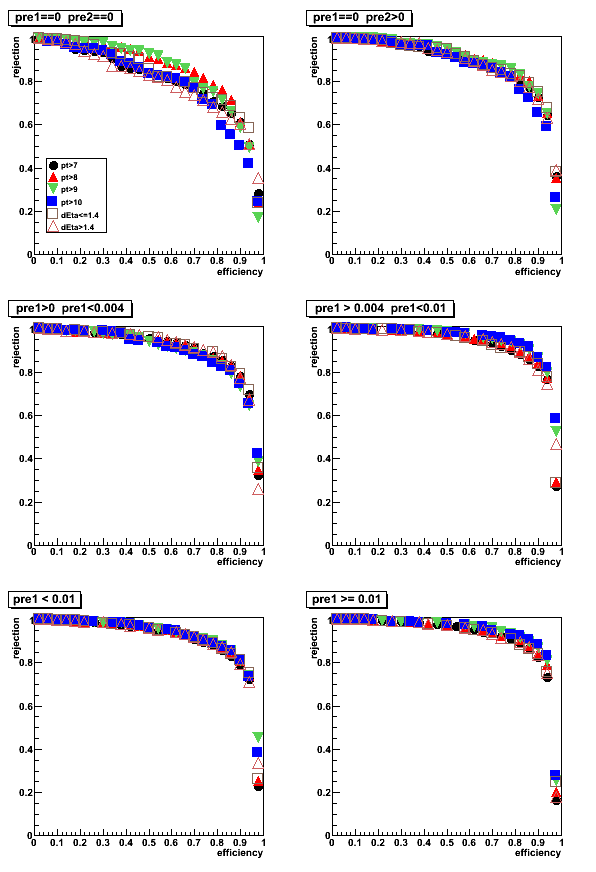
Figure 11: purity vs. efficiency
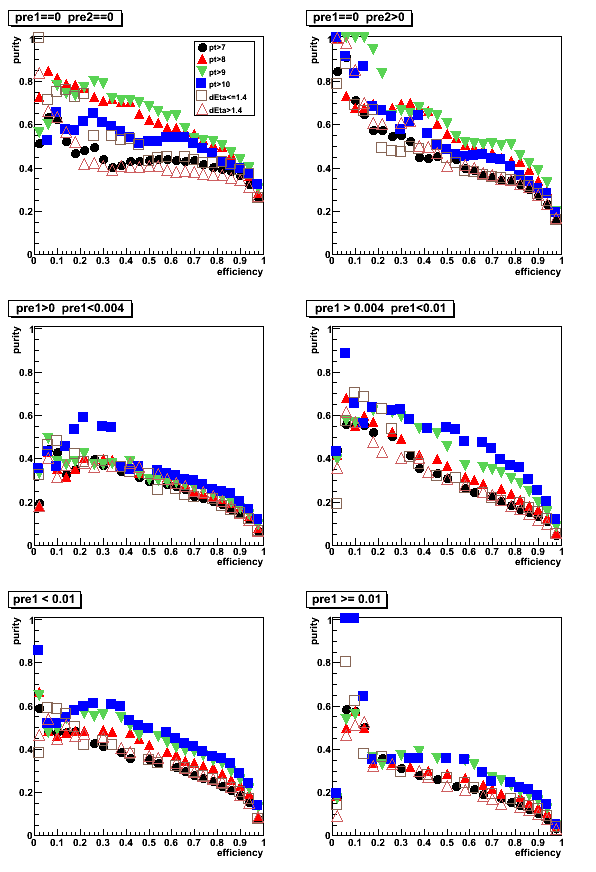
Figure 12: purity vs. rejection (click link to see the figure)
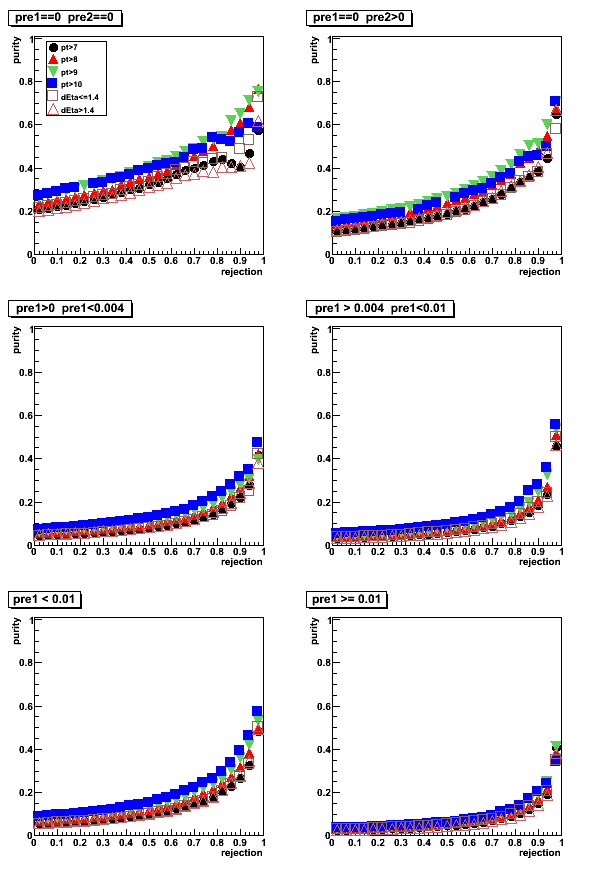
LDA Set3
Figure 13: rejection vs. efficiency (click link to see the figure)
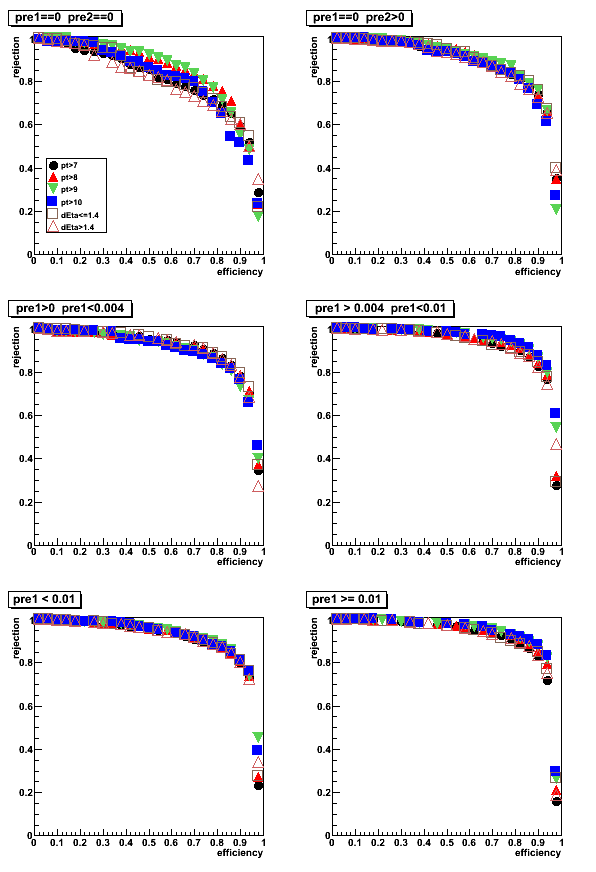
Figure 14: purity vs. efficiency
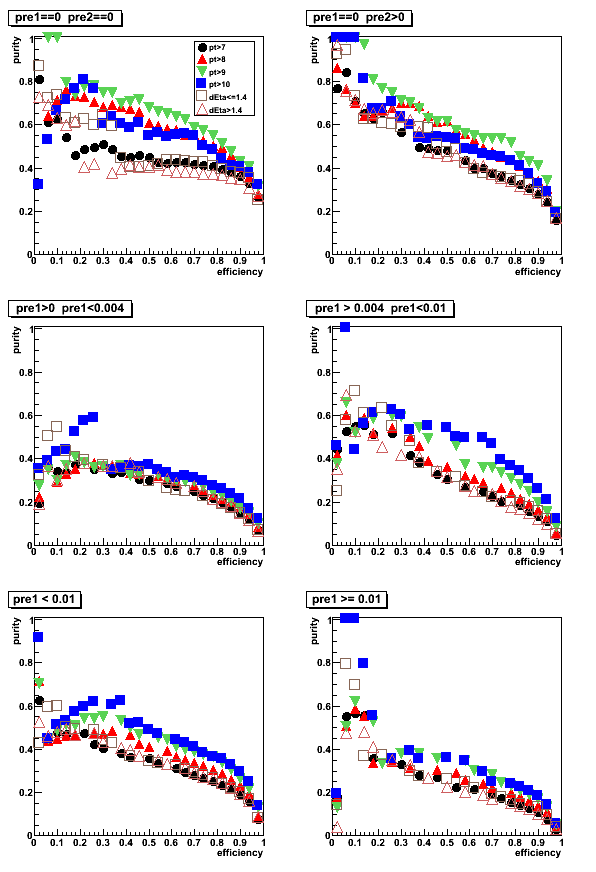
Figure 15: purity vs. rejection (click link to see the figure)
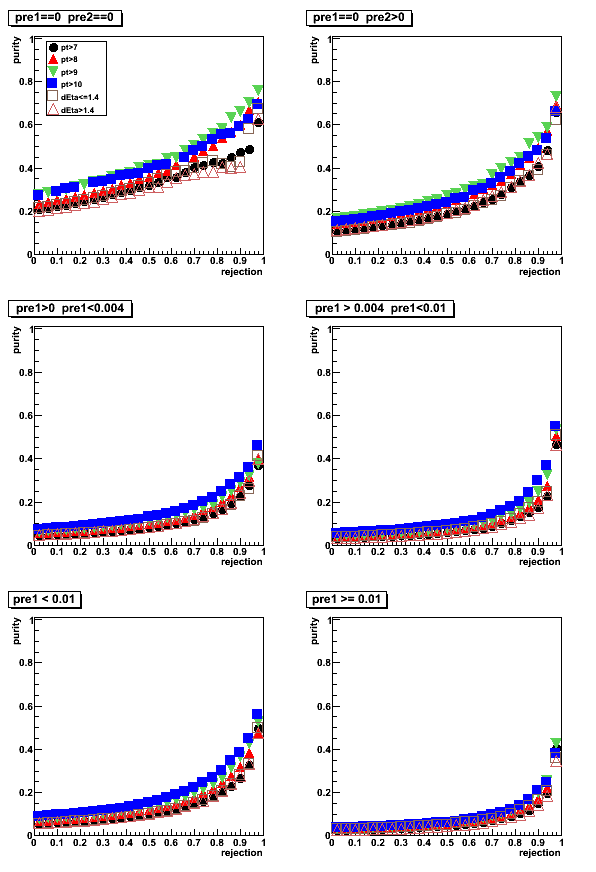
2009.05.04 LDA: More SMD info, 3x3 tower energy, correlation matrix
Cut optimization with Fisher's LDA classifier
ROOT implementation for LDA:
Application for cuts optimization in the gamma-jet analysis
LDA configuration: default
LDA input parameters Set0:
- Set4 (link for results with LDA Set0-Set3):
- Energy fraction in 3x3 cluster within a r=0.7 radius:
E_3x3/E_0.7 - Photon-jet pt balance:
[pt_gamma-pt_jet]/pt_gamma - Number of charge tracks within r=0.7 around gamma candidate:
Ncharge - Number of Endcap towersL fired within r=0.7 around gamma candidate:
NtowBarrel - Number of Barrel towers fired within r=0.7 around gamma candidate
NtowEndcap - Shower shape analysis: distance to 80% cut line:
distance to cut line - Energy fraction in E_2x1 and E_2x2 witin E_3x3:
E_2x1/E_2x2 and E_2x2/E_3x3 - Energy in post-shower layer under 3x3 tower patch:
E_post^3x3 - Tower energy in 3x3 patch:
E_tow^3x3 - SMD-u energy in 25 central strips:
E_smd-u^25 - SMD-v energy in 25 central strips:
E_smd-v^25 - SMD-v peak energy (in 5 central strips):
E_peak
- Energy fraction in 3x3 cluster within a r=0.7 radius:
The number of strips in SMD u or v planes is required to be greater than 3
Pre-shower sorting (energy in tiles under 3x3 tower patch):
- pre1=0, pre2=0
- pre1=0, pre2>0
- 0 < pre1 < 0.004
- 0.004 < pre1 < 0.01
- pre1 < 0.01
- pre1 >= 0.01
Integrated yields per pre-shower bin:
| sample | total integral | pre1=0,pre2=0 | pre1=0, pre2>0 | 0 < pre1 < 0.004 | 0.004 < pre1 < 0.01 | pre1 < 0.01 | pre1 >= 0.01 |
| photon-jet | 2.5640e+03 | 3.5034e+02 | 5.2041e+02 | 5.6741e+02 | 5.2619e+02 | 1.9644e+03 | 5.9994e+02 |
| QCD | 5.6345e+04 | 1.3515e+03 | 4.3010e+03 | 1.2289e+04 | 1.5759e+04 | 3.3701e+04 | 2.2644e+04 |
| pp2006 | 6.2811e+04 | 6.8000e+02 | 2.4310e+03 | 1.2195e+04 | 1.6766e+04 | 3.2072e+04 | 3.0739e+04 |
Photon pt and rapidity cuts:
- pt>7GeV
- pt>8GeV
- pt>9GeV
- pt>10GeV
- detector eta <1.4 (pt>7GeV)
- detector eta > 1.4 (pt>7GeV)
LDA Set4
Figure 1: LDA discriminant with Set0: Data to Monte-Carlo comparison (pt>7GeV cut)
Right plot for each pre-shower condition shows the ratio of pp2006 data to sum of the Monte-Carlo samples
Colour coding:
black pp2006 data, red gamma-jet MC, green QCD MC, blue gamma-jet+QCD
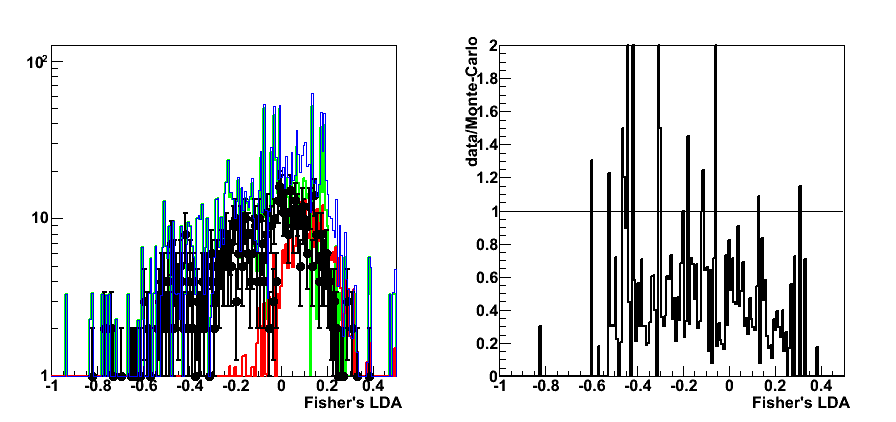
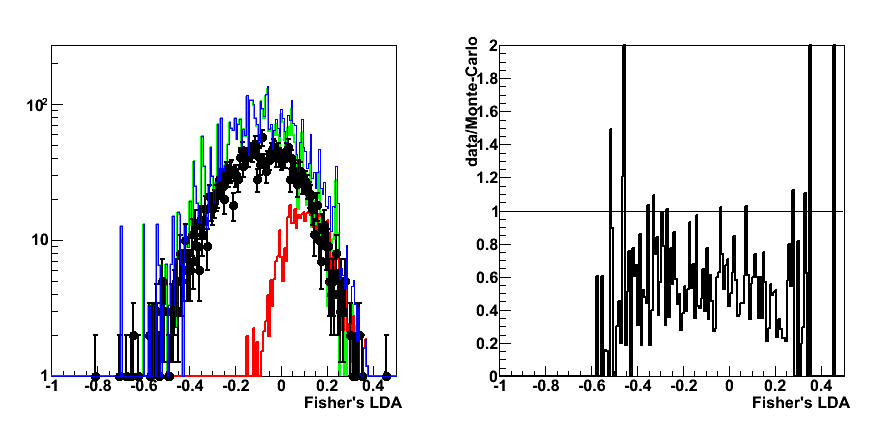
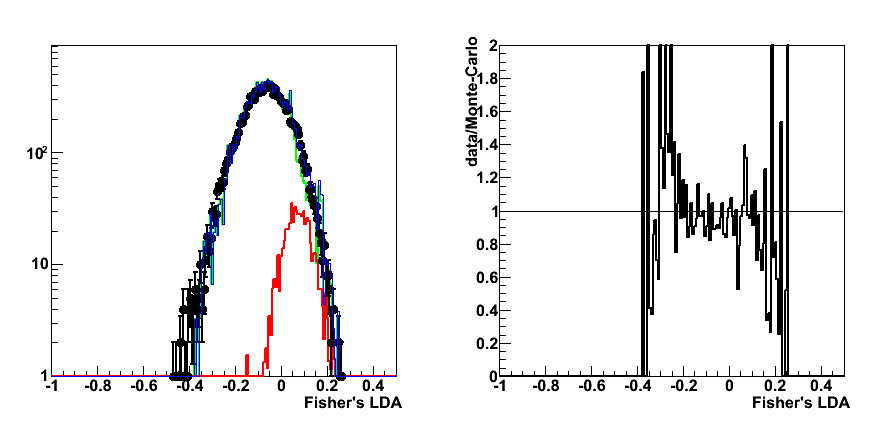
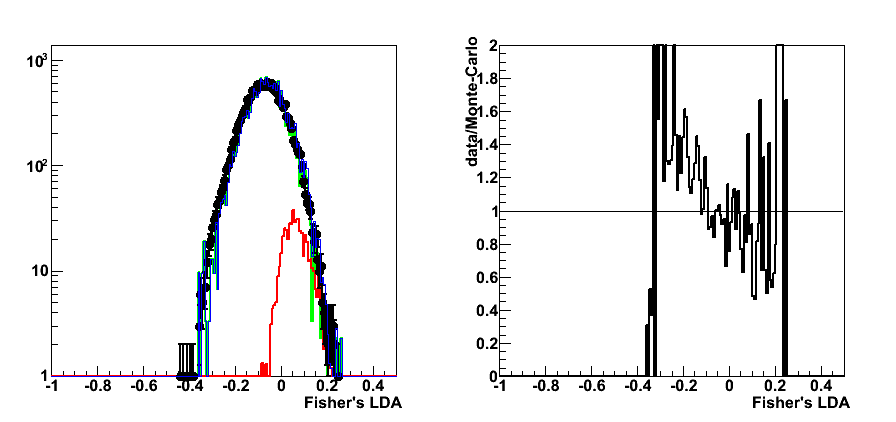
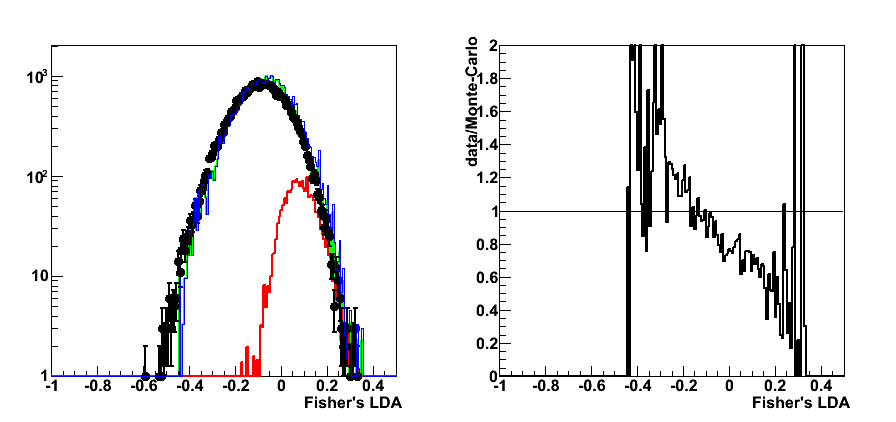
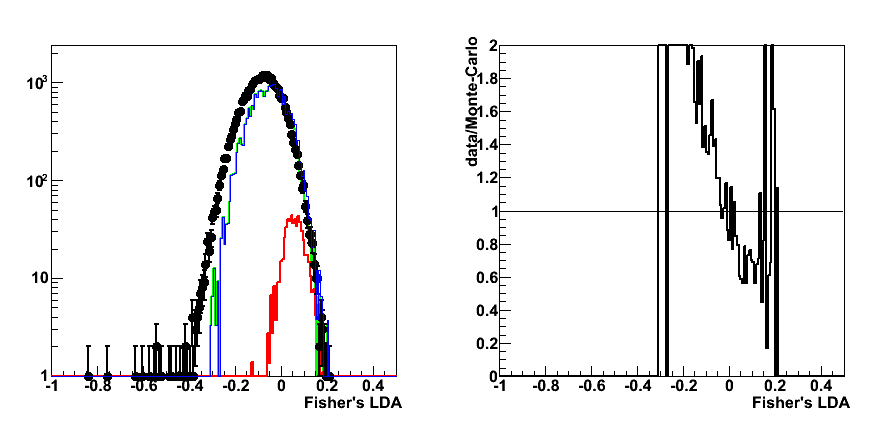
Figure 2: rejection vs. efficiency
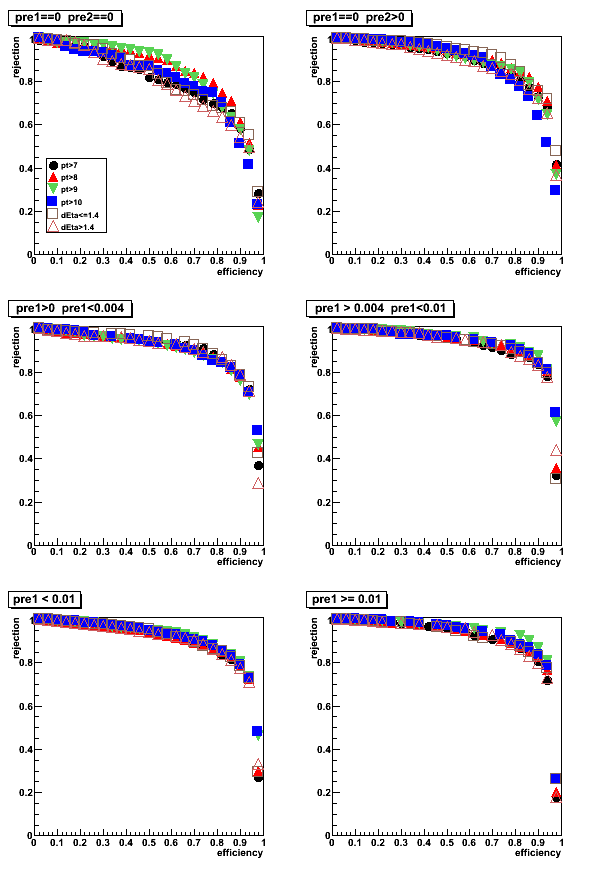
Figure 3: purity vs. efficiency
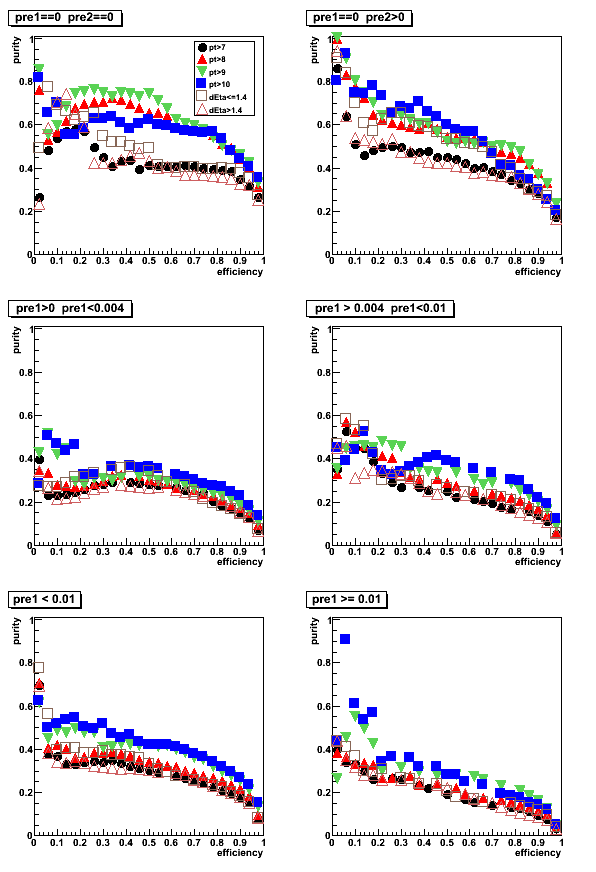
Figure 4: purity vs. rejection
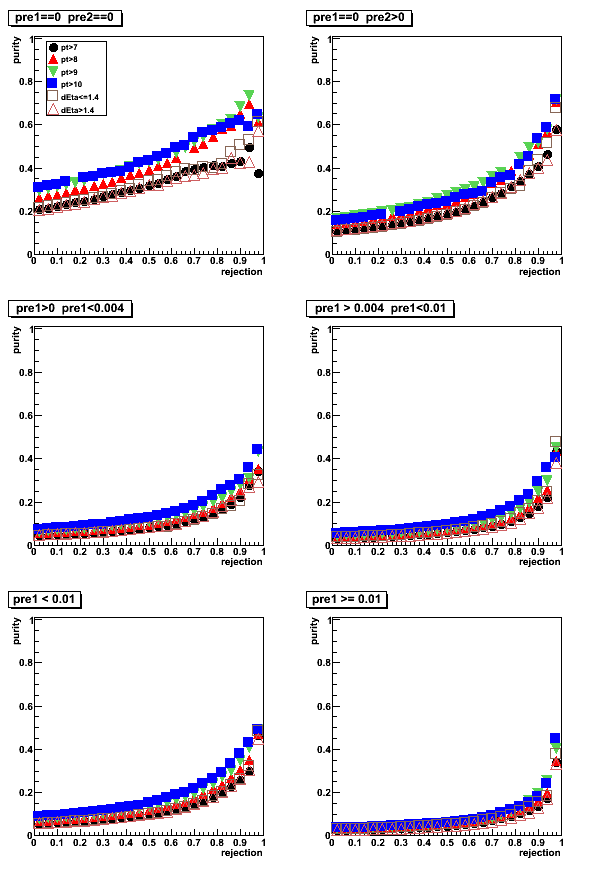
Figure 5: Correlation matrix (pt>7GeV cut)
pre1=0, pre2=0
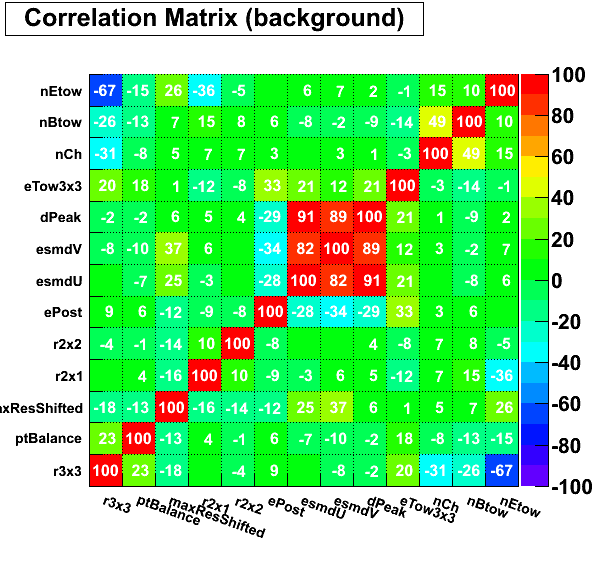
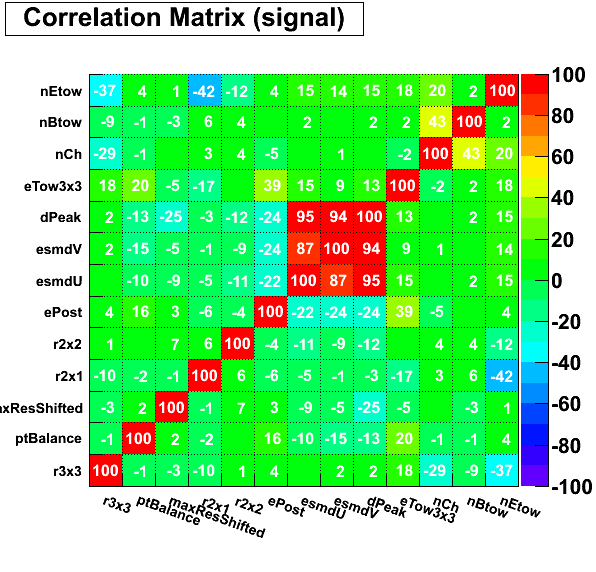
pre1=0, pre2>0
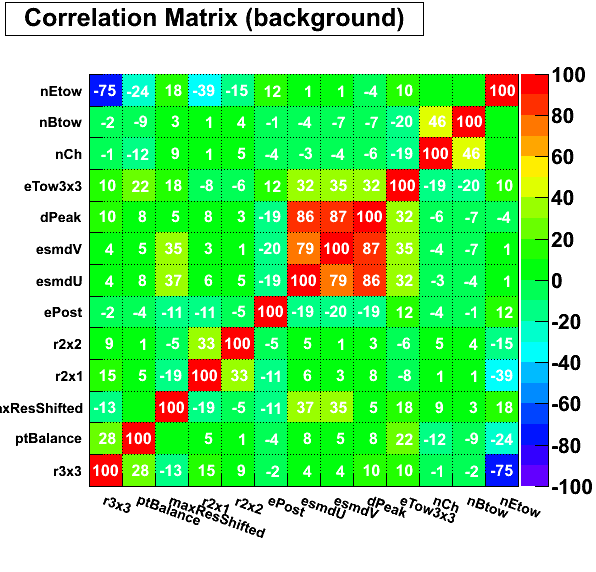

0 < pre1 < 0.004
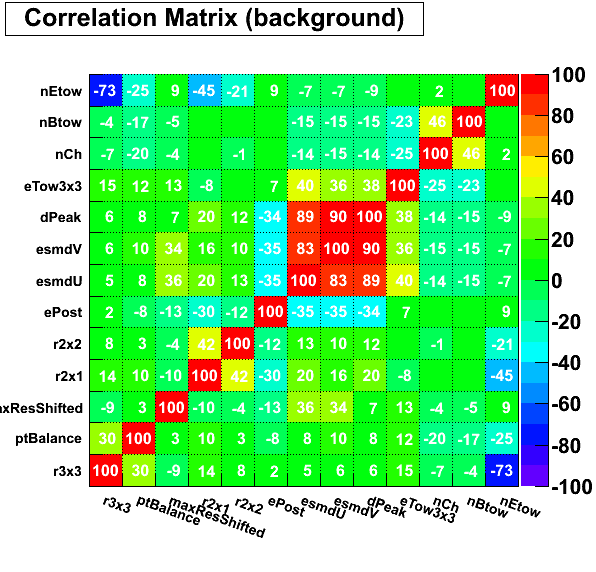
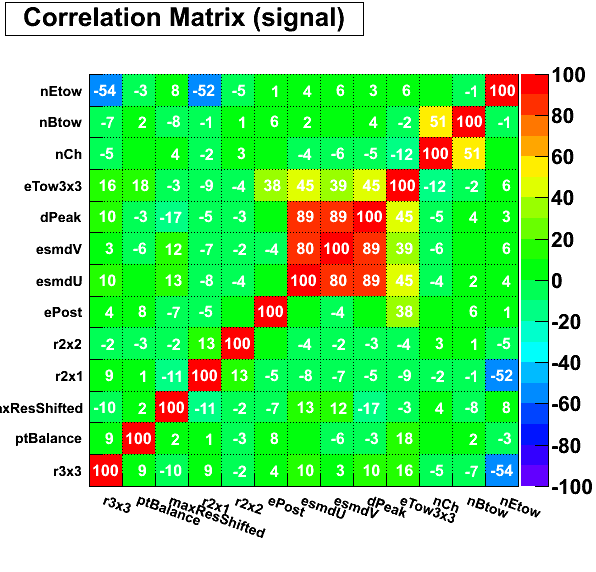
0.004 < pre1 < 0.01
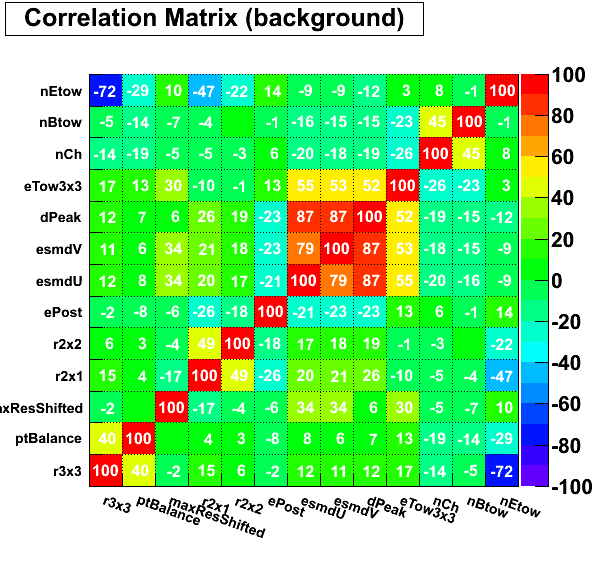
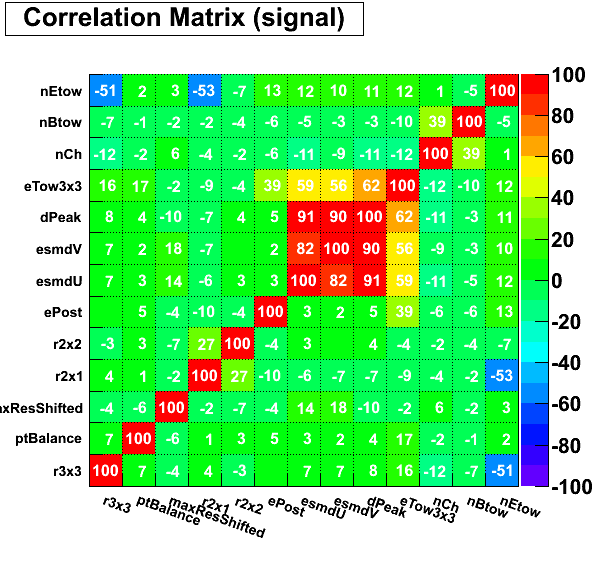
pre1 < 0.01
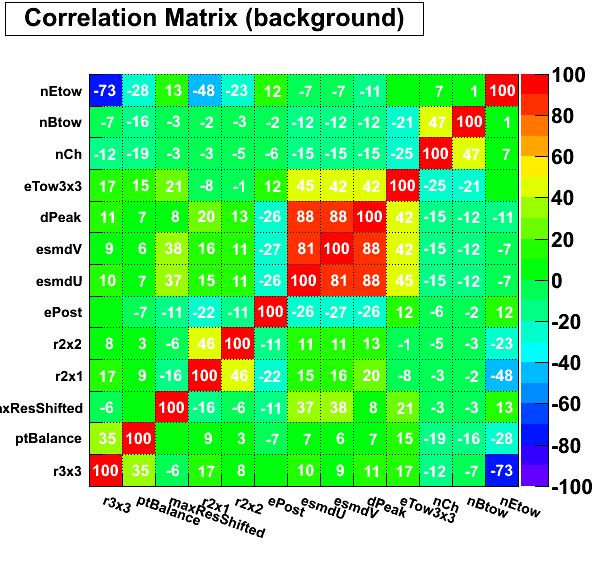
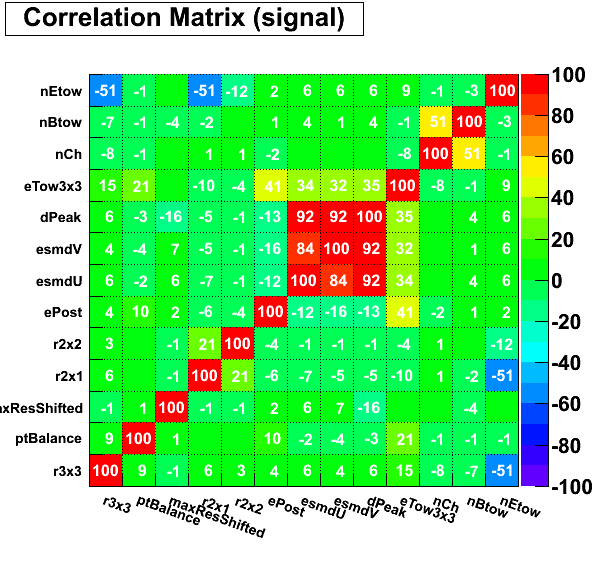
pre1 >= 0.01
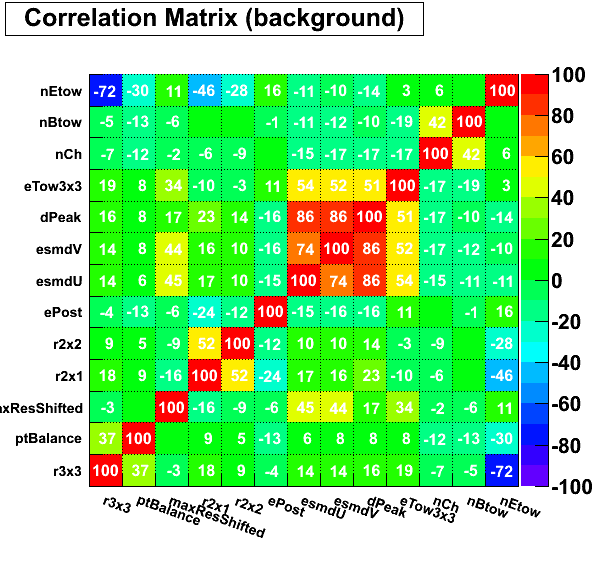
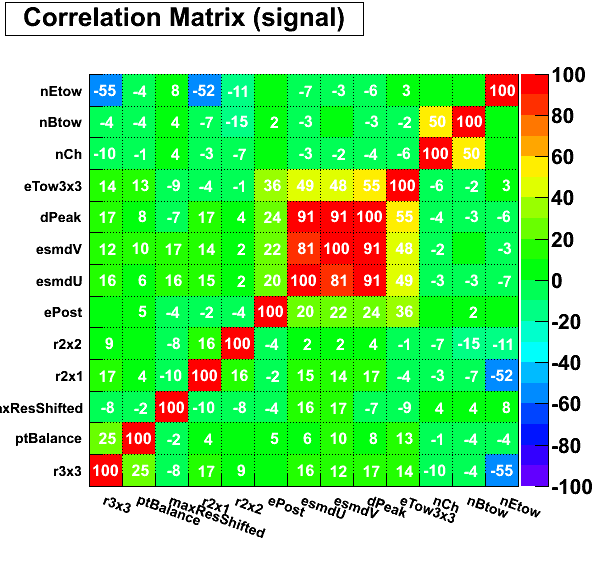
2009.05.06 Applying cuts on LDA: request minimum purity or efficiency
Cut optimization with Fisher's LDA classifier
For this post LDA input parameters Set4 has been used
LDA for various pre-shower bins is trained independetly,
and later results with pre-shower1<0.01 are combined.
There are a set of plots for various photon pt cuts (pt> 7, 8, 9 10 GeV)
and with different selection of cutoff for LDA
(either based on purity or efficiency).
Number in brackets shows the total yield for the sample.
Link to all plots (16 total) as a single pdf file
pt > 7GeV
Figure 1: pt > 7GeV, efficiency@70
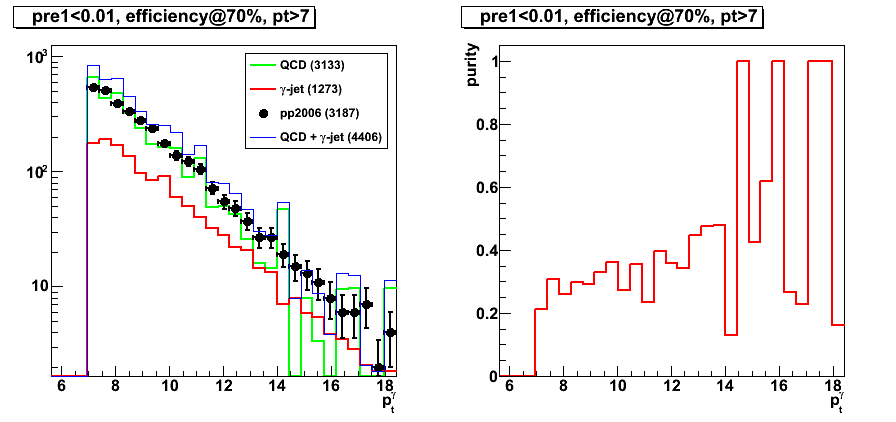
Figure 2: pt > 7GeV, purity@35
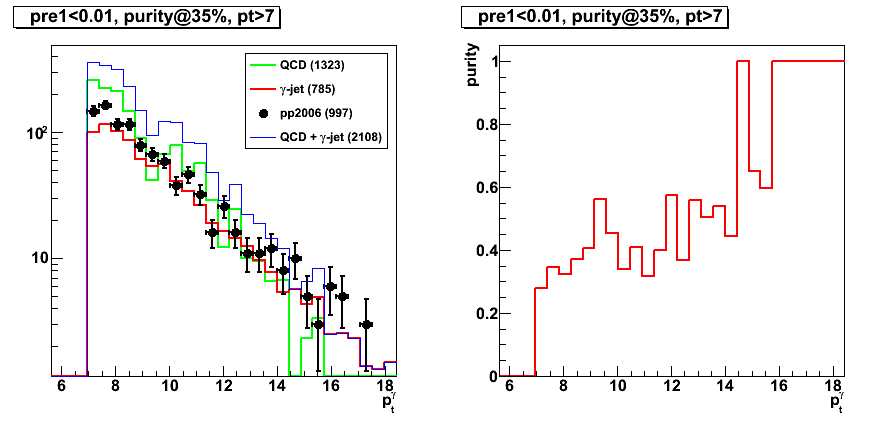
Figure 3: pt > 7GeV, purity@40
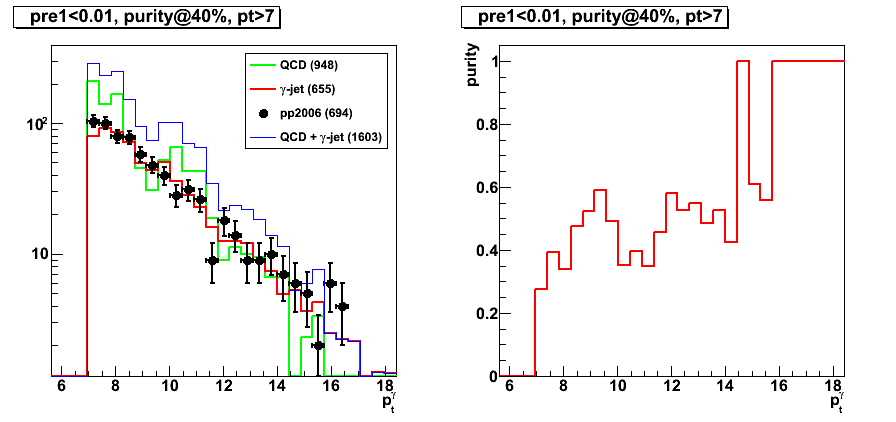
Figure 4: pt > 7GeV, purity@25 (Note: very similar to results with efficiency@70)
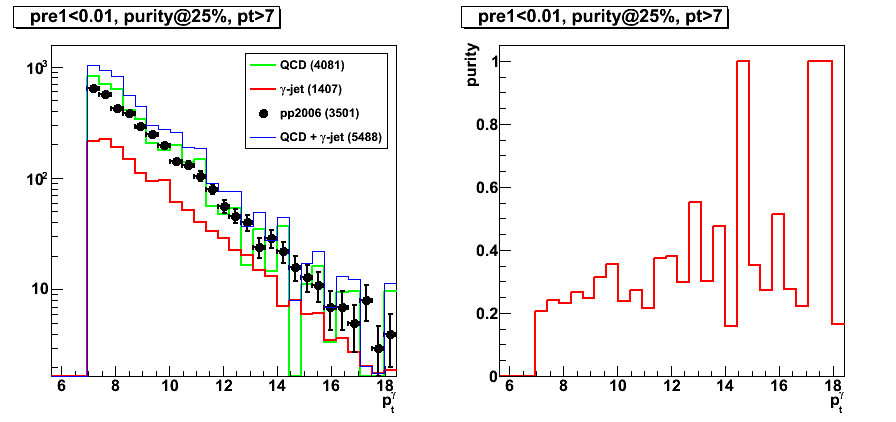
pt > 9GeV
Figure 5: pt > 9GeV, efficiency@70
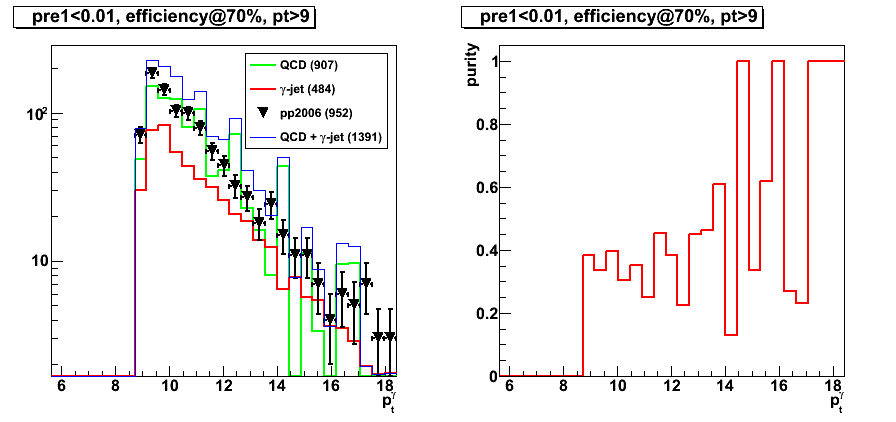
Figure 6: pt > 9GeV, purity@35
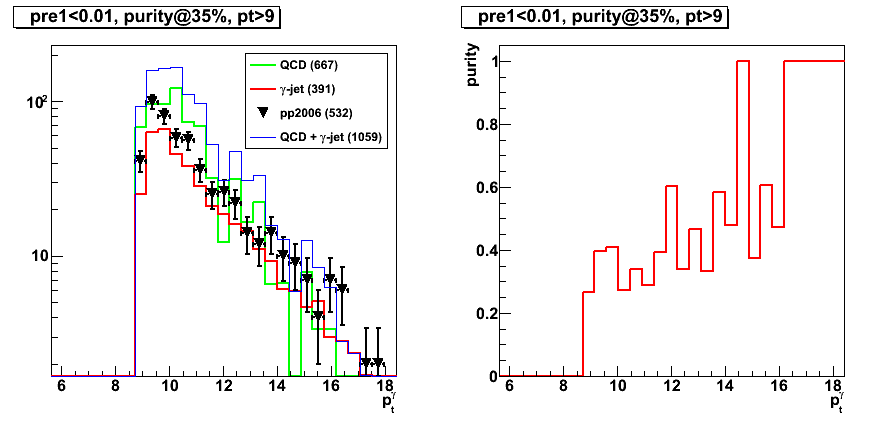
pt > 10GeV
Figure 7: pt > 10GeV, efficiency@70
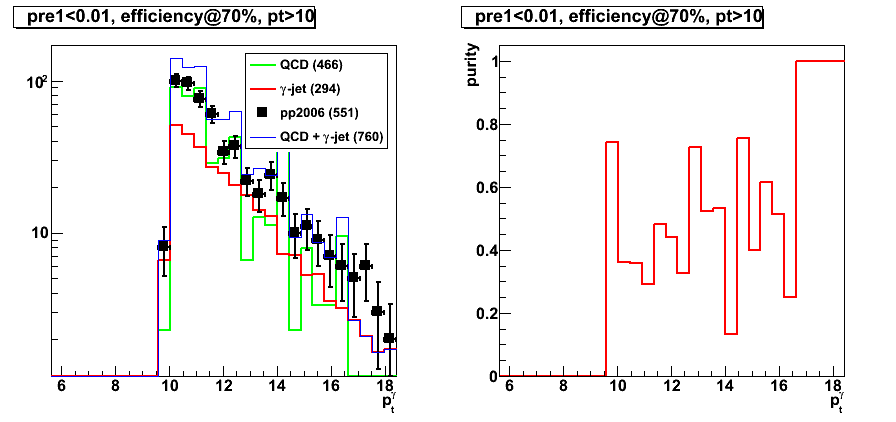
Figure 8: pt > 10GeV, purity@40
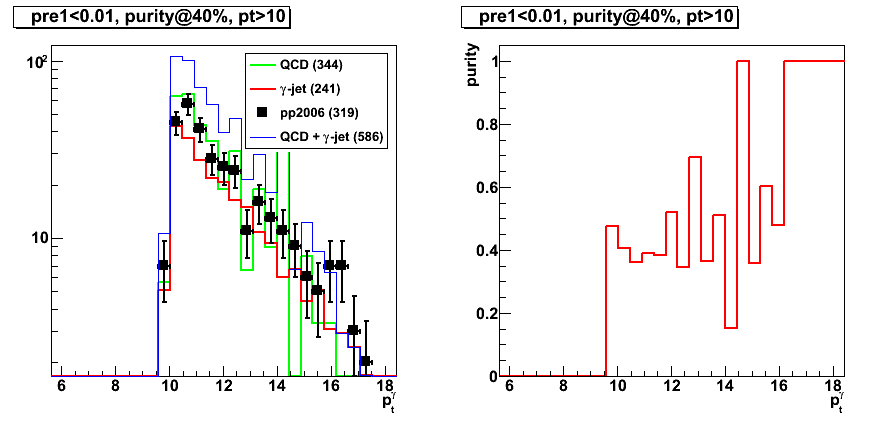
2009.05.07 Photon-jets analysis with the Endcap Calorimeter
Photon-jets with the Endcap Calorimeter
(analysis status update for Spin PWG)
Slides in pdf format:
2009.05.12 Variable distributions after LDA at 70% efficiency
Cut optimization with Fisher's LDA classifier
For this post LDA results with Set1 and Set2 has been used
Note, that LDA for various pre-shower bins is trained independetly
pdf-links with results for pre1=0 and pre2=0 (pre-shower bin 1):
- before LDA cut (figures are not sorted)
- after LDA cut @70% efficiency for Set 2 (figures are not sorted)
Figures below are for 0.004<pre-shower1<0.01 (pre-shower bin 4).
Photon pt cut: pt> 7, pre-shower bin: 0.004 < pre1 < 0.01
LDA cut with efficiency @ 70%
Set1 vs. Set2
What is added in Set2 compared to Set1:
smaller cluster size information (r2x1, r2x2), post-shower energy
Figure 1: r2x1
before LDA cut
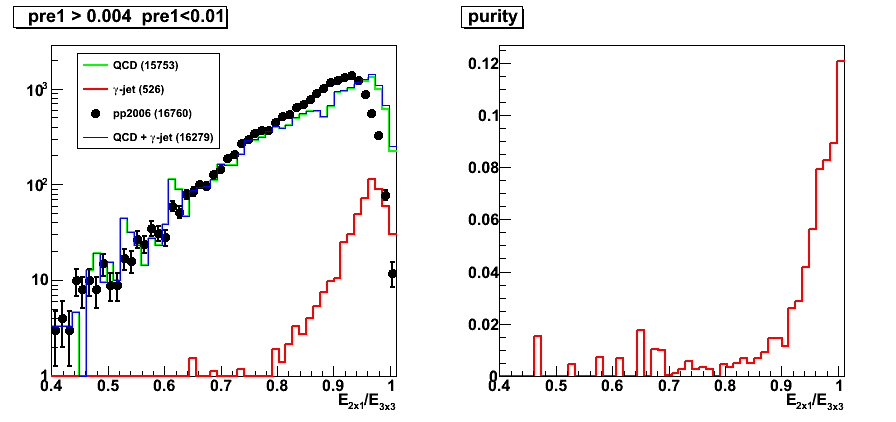
LDA cut for Set1

LDA cut for Set2
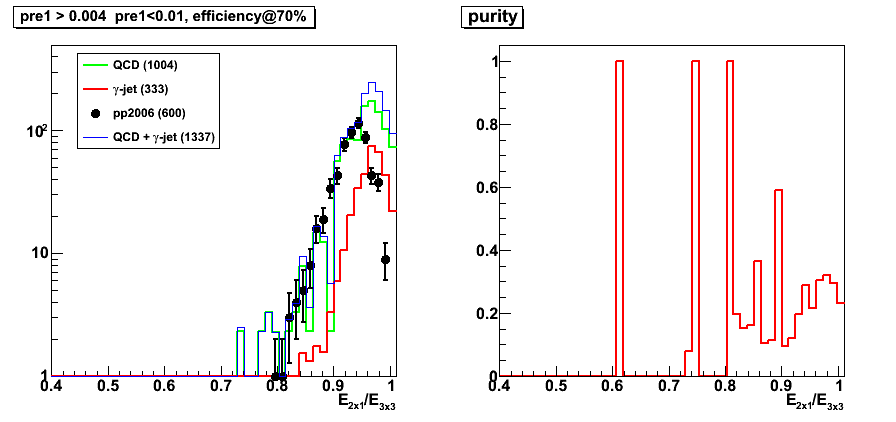
Figure 2: r2x2
before LDA cut
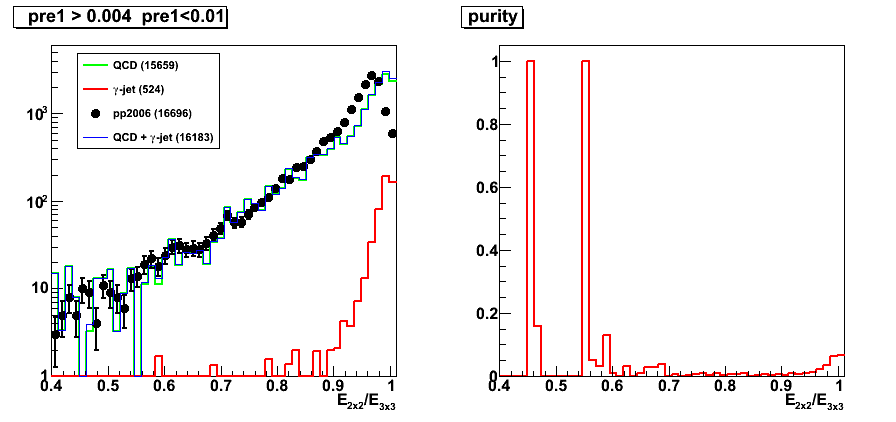
LDA cut for Set1
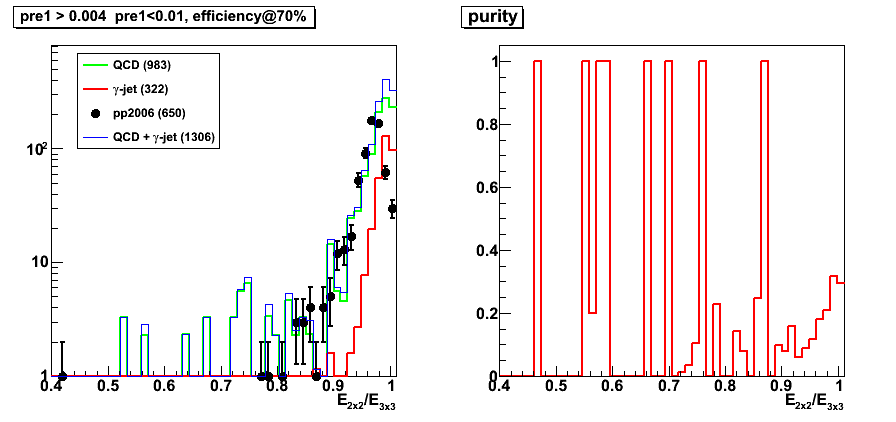
LDA cut for Set2
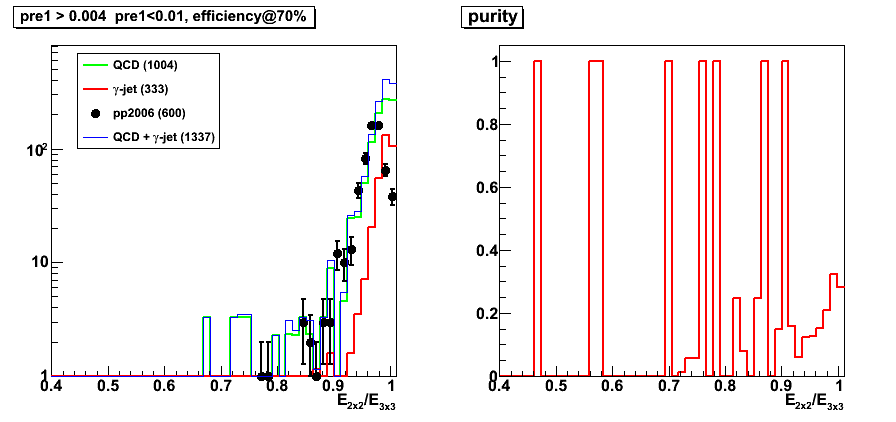
Figure 3: r3x3
before LDA cut
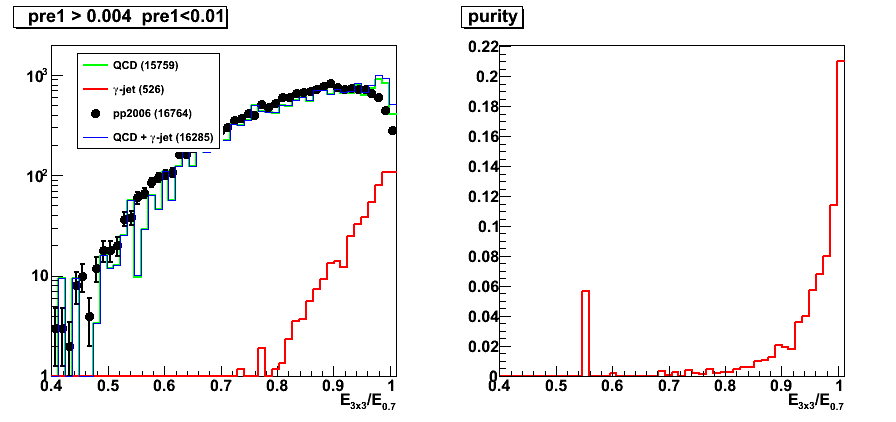
LDA cut for Set1
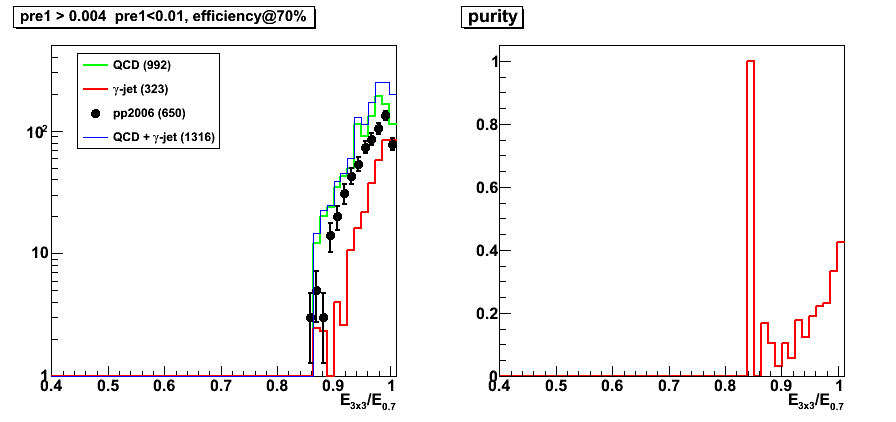
LDA cut for Set2
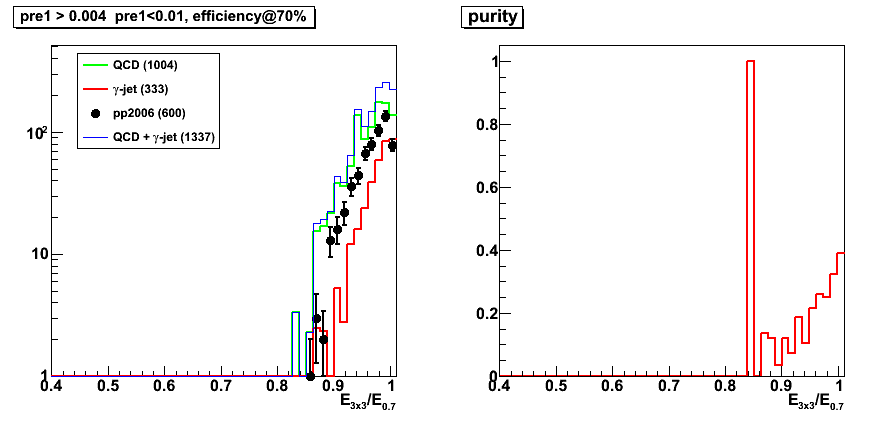
Figure 4: Residual distance
before LDA cut
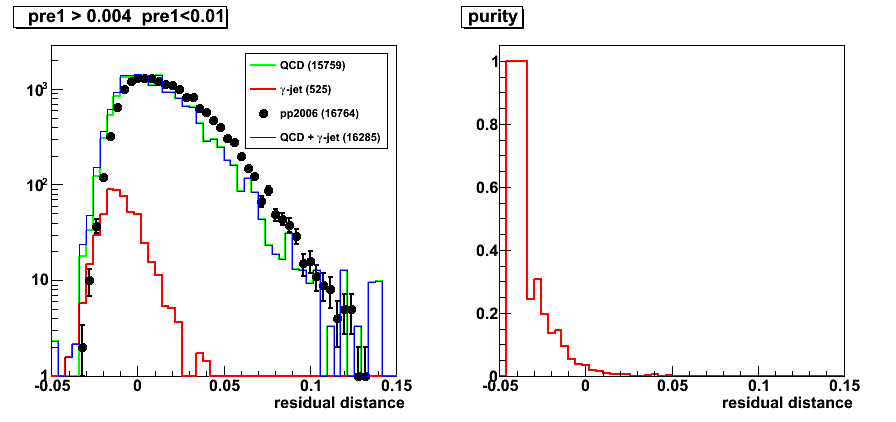
LDA cut for Set1
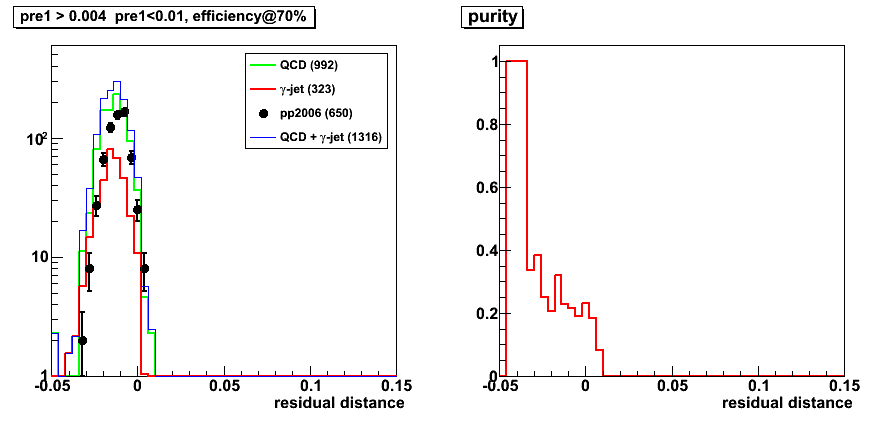
LDA cut for Set2
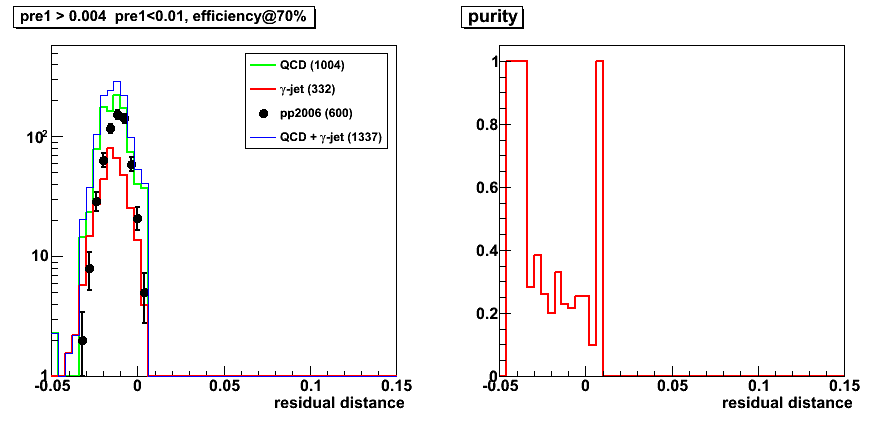
Other variables with LDA Set2 cut
Note: Only plos for LDA cut @70 efficiency for Set2 are shown
Figure : number of charge particles around photon
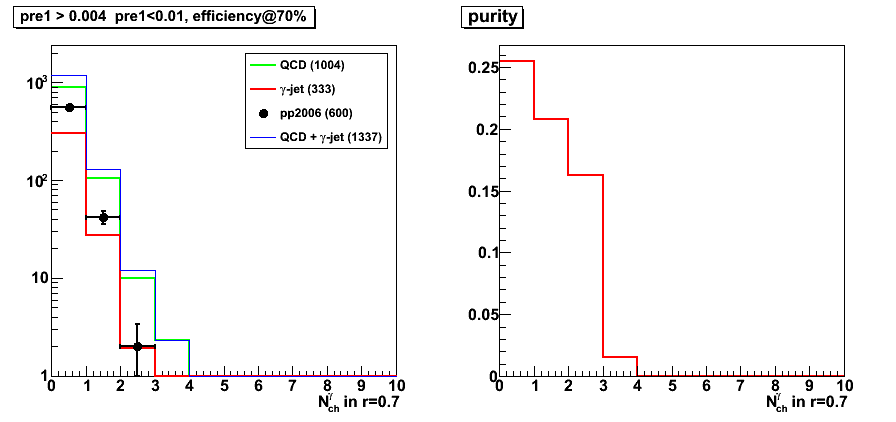
Figure 5: number of EEMC tower around photon
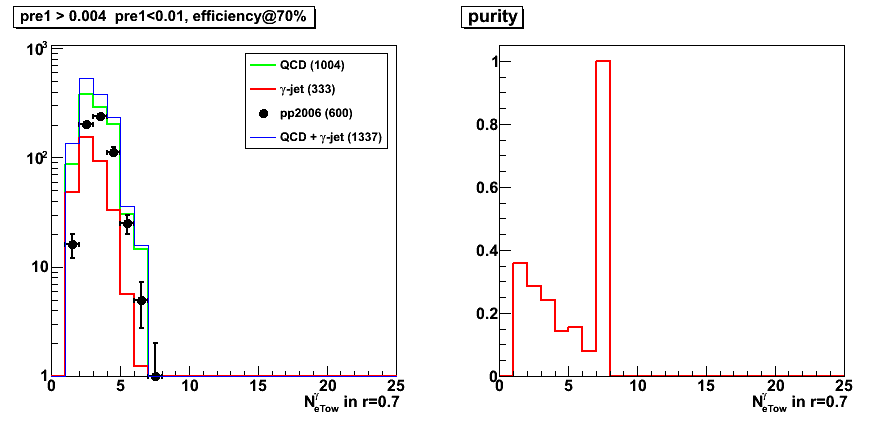
Figure 6: number of BEMC tower around photon
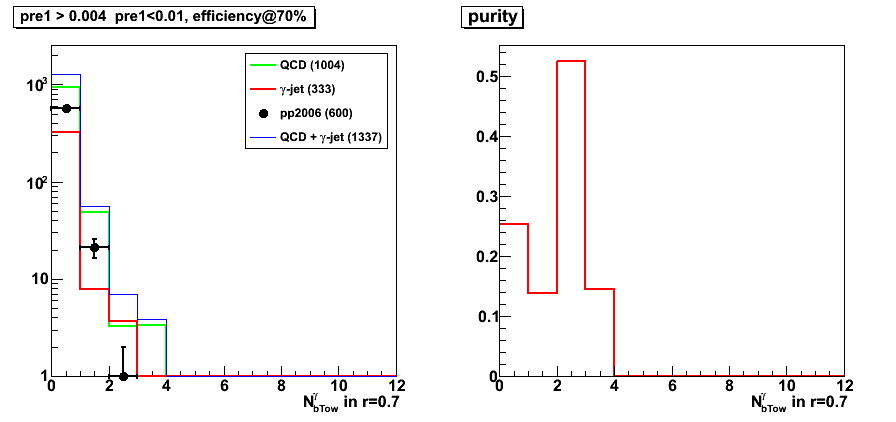
Figure 7: photon-jet pt balance
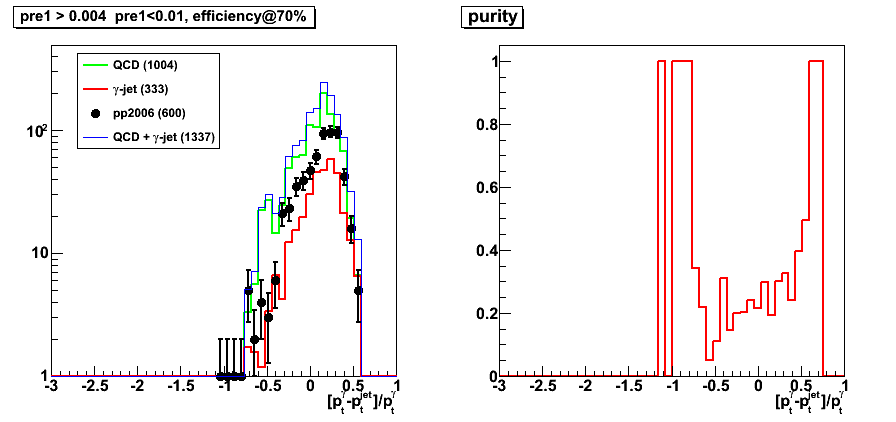
Figure 8: SMD energy in 5 centrapl strips
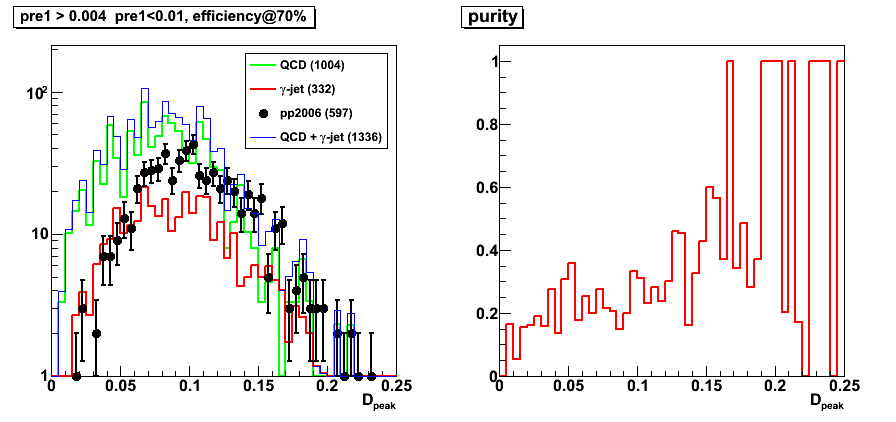
Figure 9: SMD energy in 25 central strips: u and v plane separately (plot for V plane)
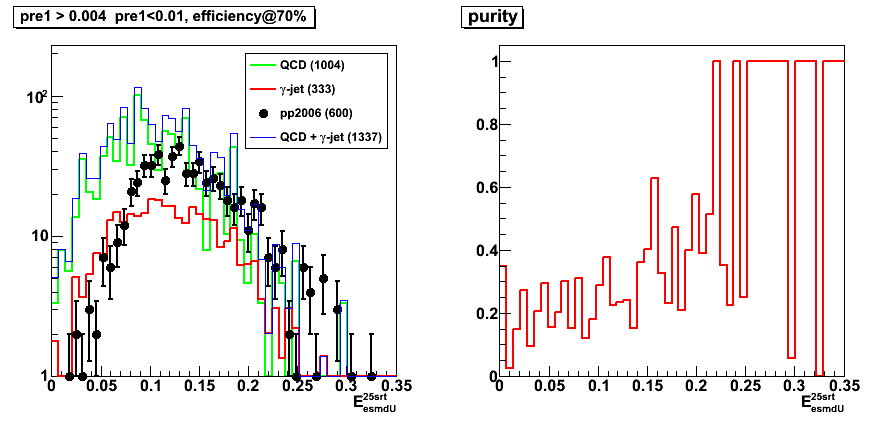
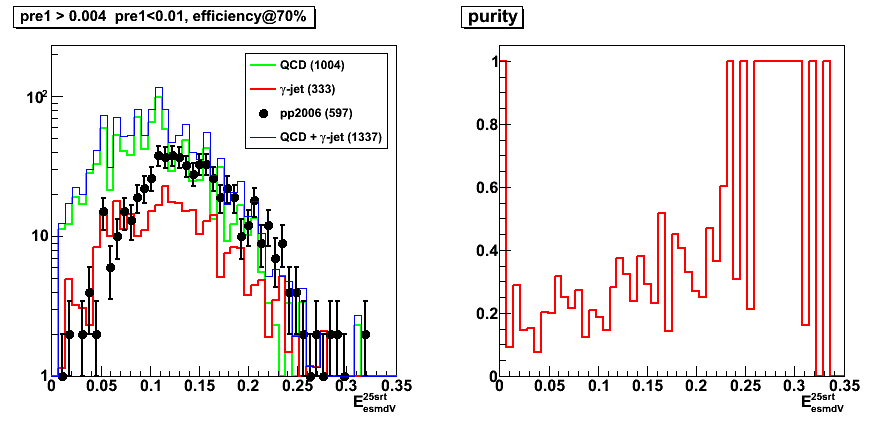
Figure 10: 2x1 cluster energy
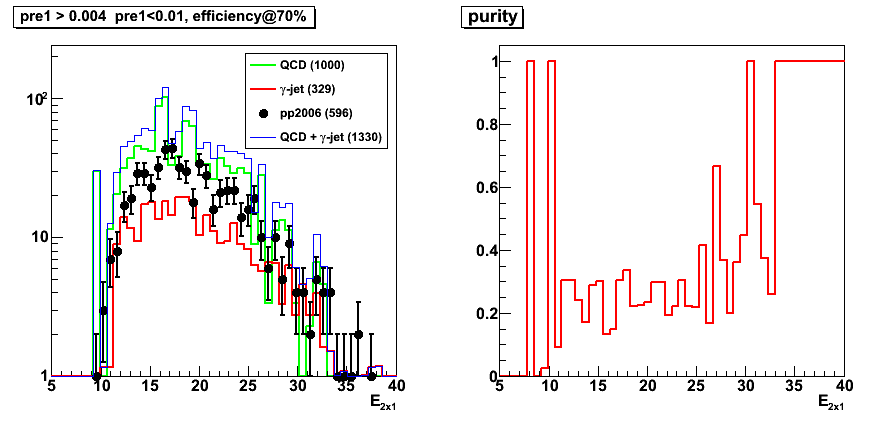
Figure 11: 2x2 cluster energy
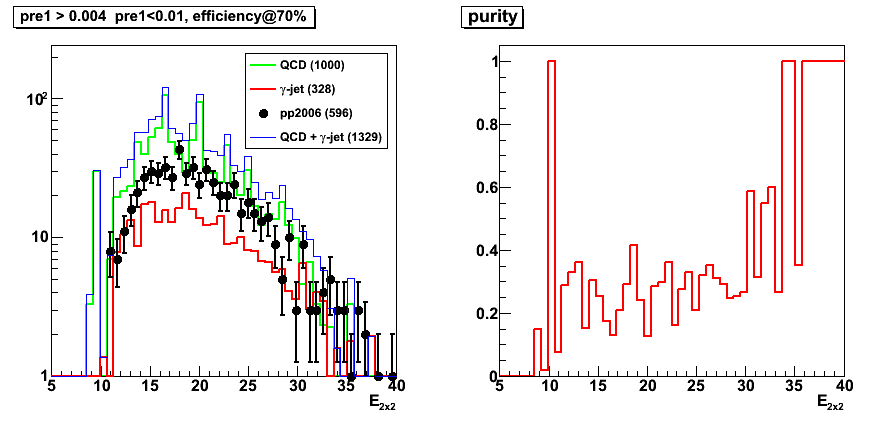
Figure 12: 3x3 cluster energy
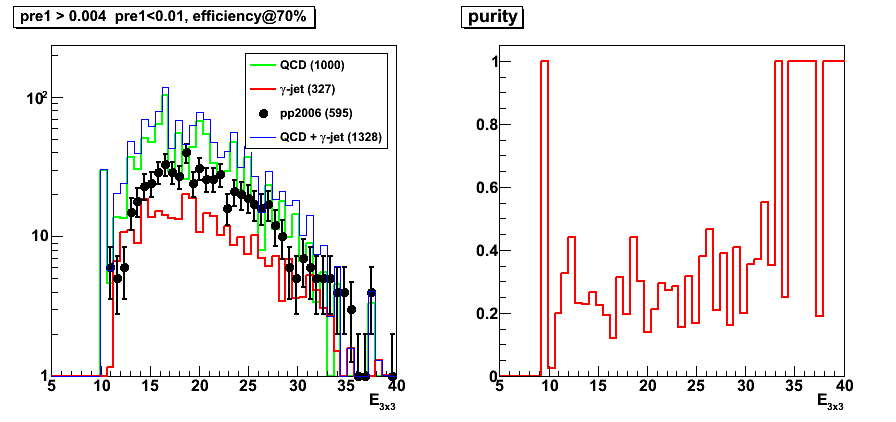
Figure 13: tower energy in r=0.7 radius
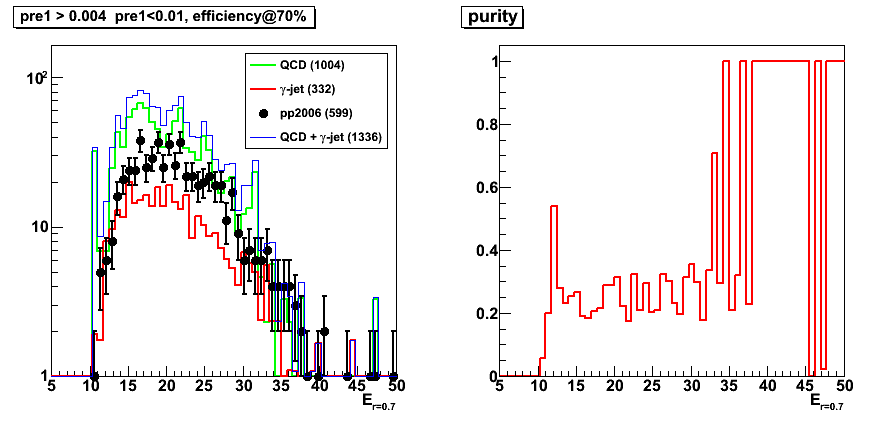
Figure 14: 3x3 pre-shower1 energy
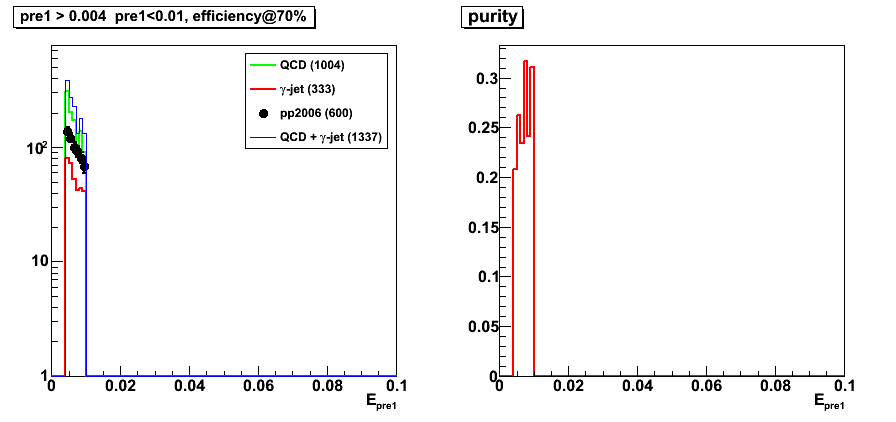
Figure 15: 3x3 pre-shower2 energy
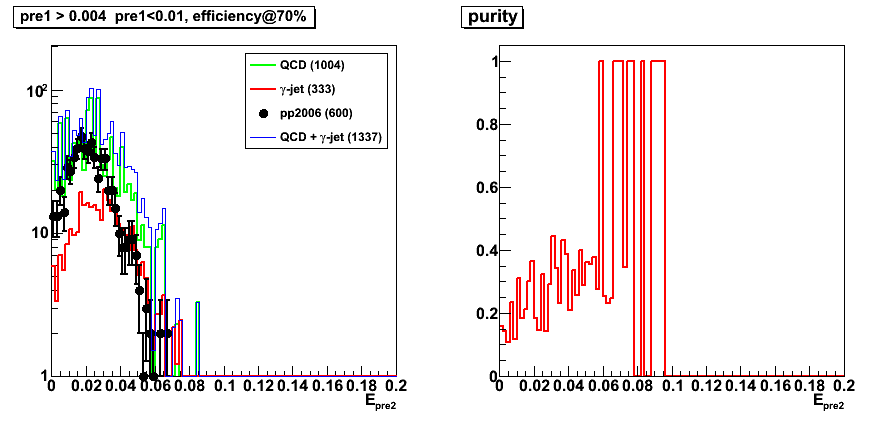
Figure 16: 3x3 post-shower energy
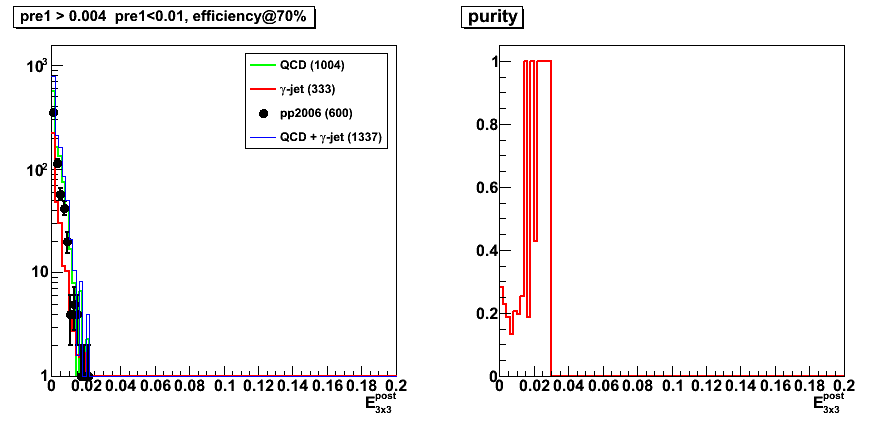
Figure 17: photon pt
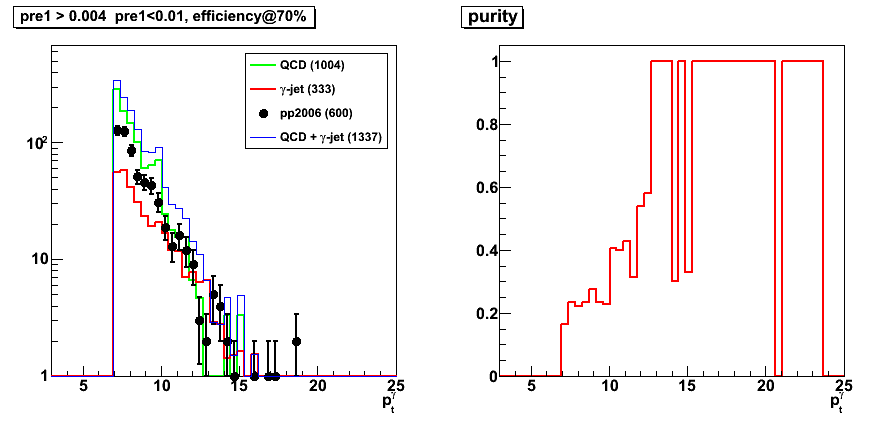
Figure 18: jet pt
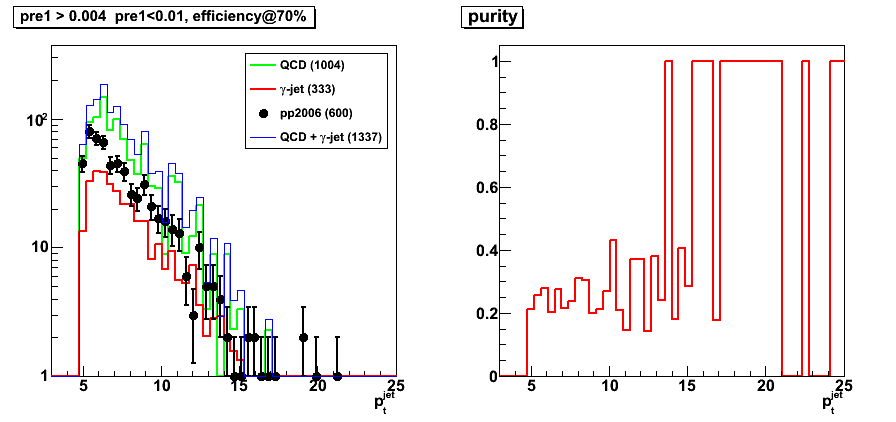
Figure 19: z vertex
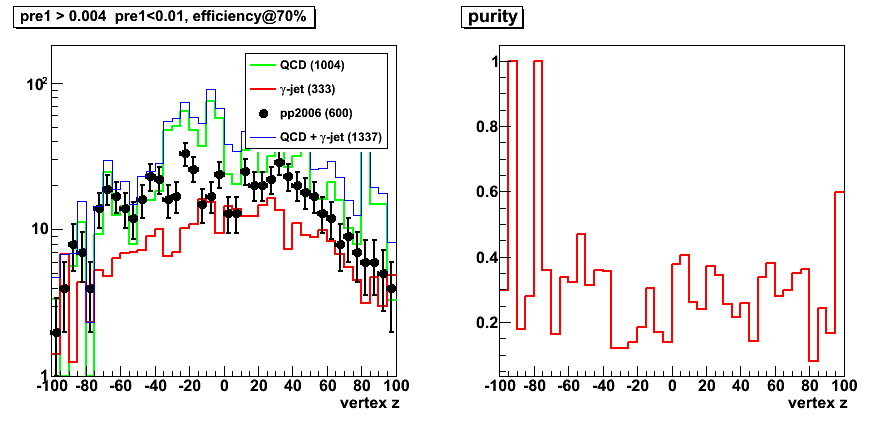
2009.05.31 CIPANP 2009 photon-jet presentation
CIPANP 2009 presentation on photon-jet study
Title:
"Photon-jet coincidence measurements
in polarized pp collisions at sqrt{s}=200GeV
with the STAR Endcap Calorimeter"
- Presentation in pdf format
- Older versions: 0, 1, 2 3, 4, 5, open office file: odp
- Submitted abstract
- Conference link: CIPANP 2009
06 Jun
June 2009 posts
2009.06.22 CIPANP 2009 photon-jet proceedings
CIPANP 2009 proceedings on photon-jet study
Title:
"Photon-jet coincidence measurements
in polarized pp collisions at sqrt{s}=200 GeV
with the STAR Endcap Calorimeter"
- Proceedings: latest version
Older versions: 01 02 03 04 05 - Presentation
- Submitted abstract
- Conference link: CIPANP 2009
07 Jul
July 2009 posts
2009.07.21 EEMC tower response in Monte-Carlo
Data set and cuts:
- gamma-jet filtered Monte-Carlo
- Di-jet events from the jet finder (jets threshold: 3.5 GeV)
- parton pt bin 3-4 GeV (see pt_gamma distributions for various parton pt bins)
- Thrown photon pseudo-rapidity: eta in [1-2] range
- Requires to reconstruct photon candidate in the EEMC
Figure 1: Average ratio: pt_true / (pt_reco/1.3) vs. pt_reco (GeV/c)
- Introduce 1.3 factor here to remove the effect of the fudge factor in slow simulator
- Since a limited partonic pt range (3-4 GeV) is used for this study,
there is an "artificial" increase of the plotted ratio in pt_gamma > 6 GeV range - Fig. 1 reflects similar features (over a limited pt range) as those found by Hal
in his single photon study (see slide 6 of SimulationStudies.ppt presentation)
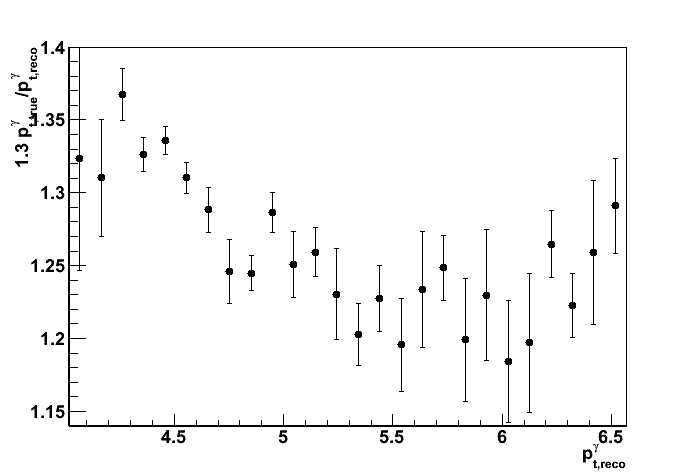
Figure 2:
Average momentum difference: pt_true - (pt_reco/1.3) vs. pt_reco (GeV/c)
- Fig. 2 shows that on average in GEANT Monte-Carlo we miss ~1GeV independent on the photon pt.
EEMC detector response can be still linear even if the ratio in Fig. 1 is not flat. - Usage of fixed 1.3 (or others, like 1.25) fudge factors are not justified.
- It seems that using pt-dependent fudge factor (like it is done in this Jason's study)
is also unjustified, since the same effects (flat ratio of pt_reco/pt_true ~ 1)
can be reached by subtracting 1 GeV from the cluster energy (See Fig. 3).
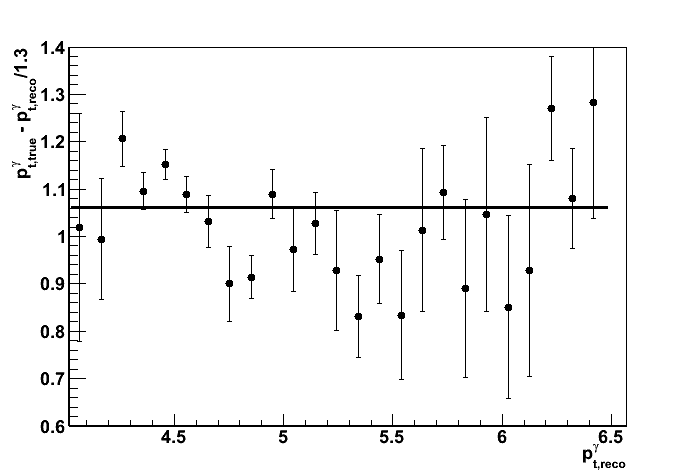
Figure 3: Average ratio: (pt_true -1.06) (pt_reco/1.3) vs. pt_reco (GeV/c)
Similar to Fig. 1, but with the true photon pt reduced by 1.06 GeV
Resulting true/reco pt ratio is flat in 4-6 GeV range.
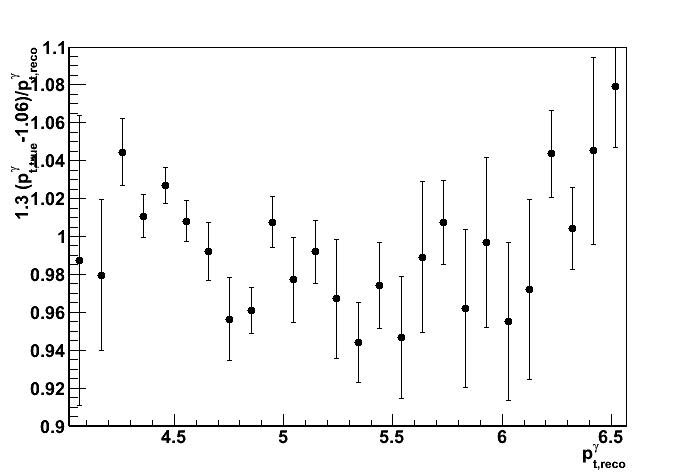
Before further pursuing our efforts in tuning the tower energy response in the Monte-Carlo,
needs to address the observed energy loss difference in the fisrt layer of the BEMC/EEMC detector.
See Jason's blog post from 2009.07.16 for more details:
Comparison muon energy deposit in the 1st BEMC/EEMC layers
08 Aug
August 2009 posts
2009.08.24 Test of corrected EEMC geometry
Test of corrected EEMC geometry (bug 1618)
Monte-Carlo setup:
- One particle per event (photons, electrons, and pions)
- Full STAR 2006 geometry.
In Kumac file: detp geom y2006g; gexec $STAR_LIB/geometry.so - Flat in eta (1.08-2.0), phi (0,2pi), and pt (3-30 GeV)
- Using A2Emaker to get reconstructed Tower/SMD energy (no EEMC SlowSimulator in chain)
what assumes fixed sampling fraction of 0.05 (5%)
Some definitions:
- Et correction factor : average p_T^thrown / E_T^{reco}.
E_T^{reco} is the total energy in the Endcap Calorimeter (from A2Emaker) - Sampling fraction: average 0.05 * Energy^{reco} / Energy^thrown.
- SMD energy: average energy in all strips fired (u-plane used for this post)
- Number of SMD strips fired: average total number of strips fired (u-plane used for this post)
Notations used in the plots:
- Left plots: no cAir fix
- Right plots: cAir-fixed
- Photons: black
- Electrons: red
- Pions: green
Et correction
Note: compare "Left" plots with Brians old results
Figure 1a: Et correction factor vs. pt thrown
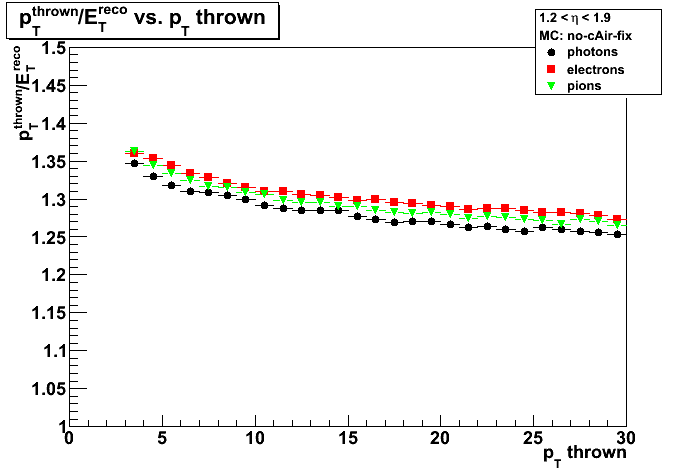
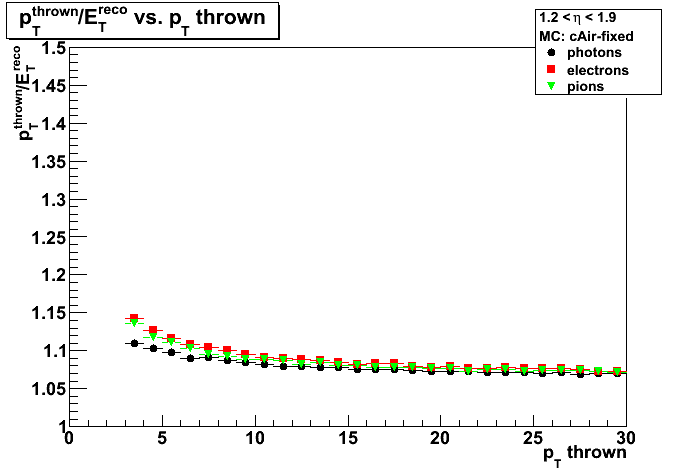
Figure 1b: Et correction factor vs. eta thrown


Figure 1c: Et correction factor vs. phi thrown
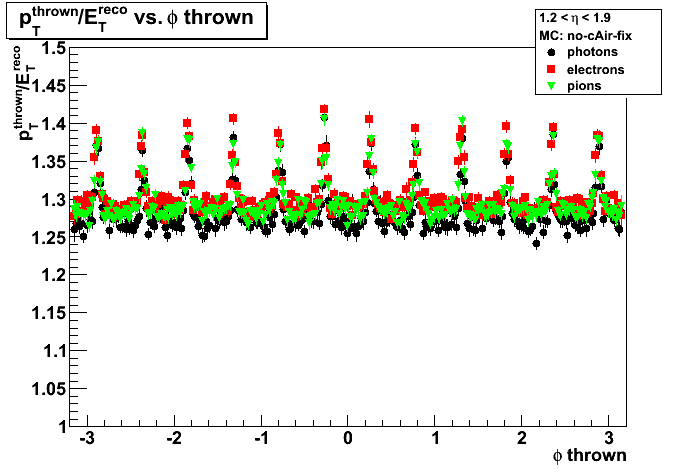
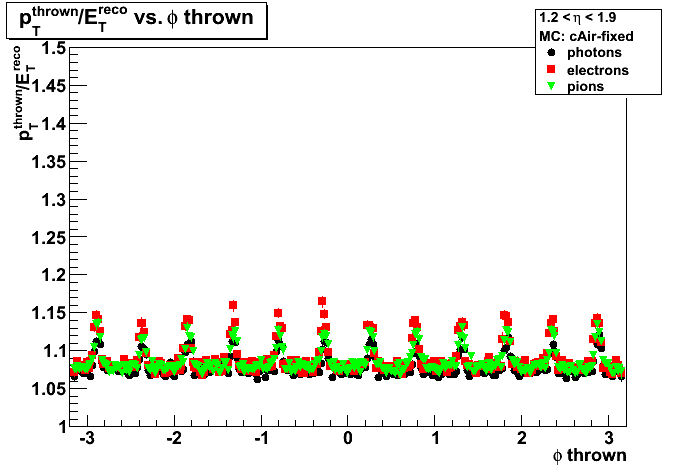
Sampling fraction
Note: compare "Right" plots with Jason results with EEMC only geometry
Figure 2a: Sampling fraction vs. pt thrown
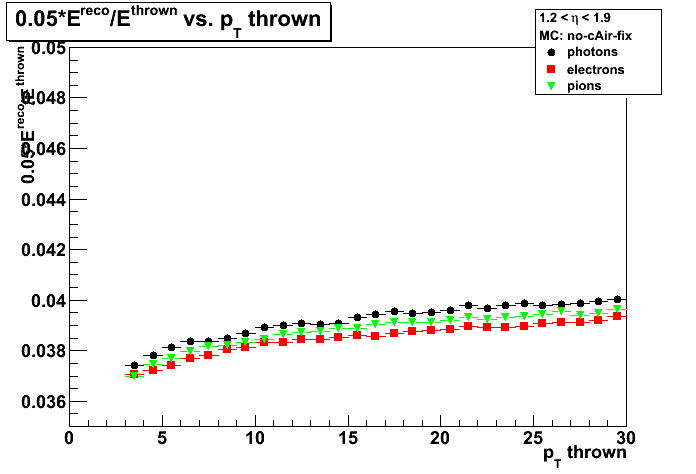
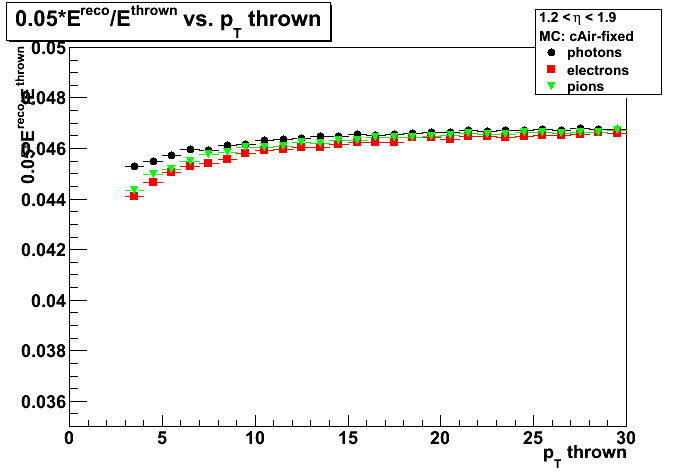
Figure 2b: Sampling fraction vs. energy thrown
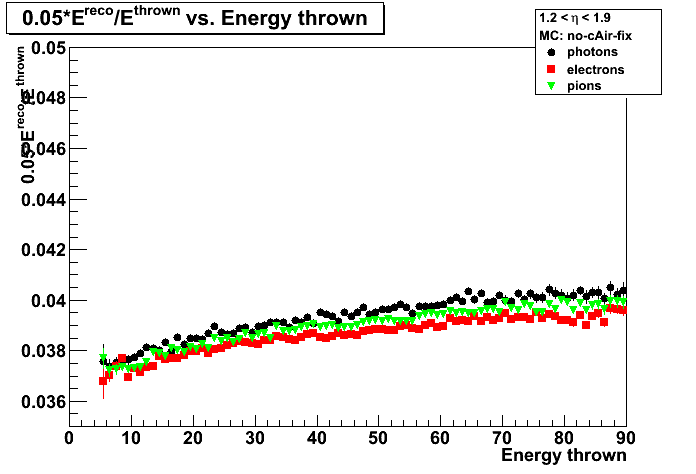
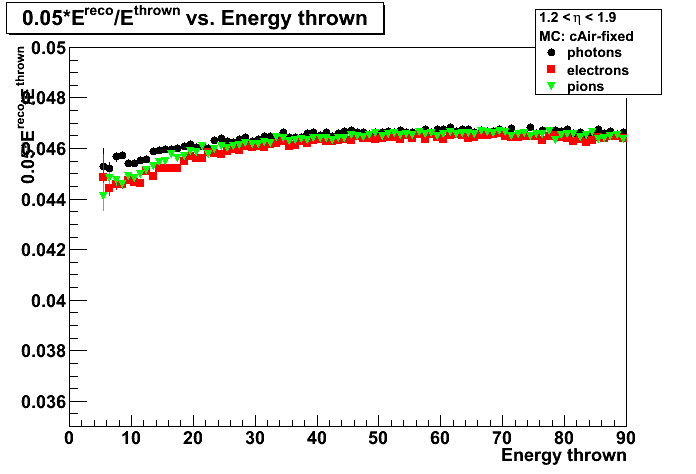
Figure 2c: Sampling fraction vs. eta thrown

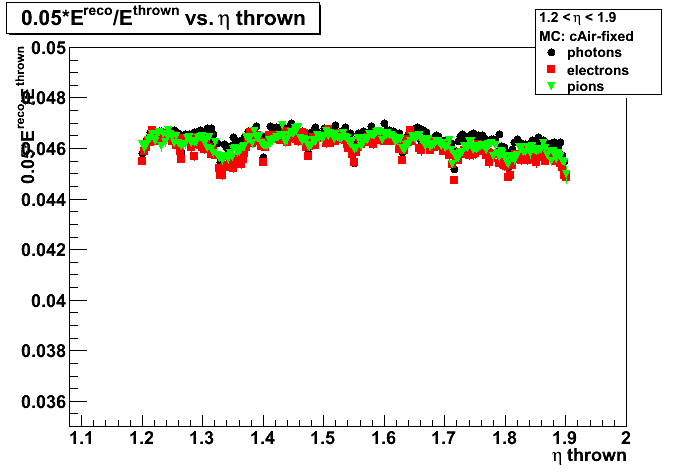
Figure 2d: Sampling fraction vs. phi thrown
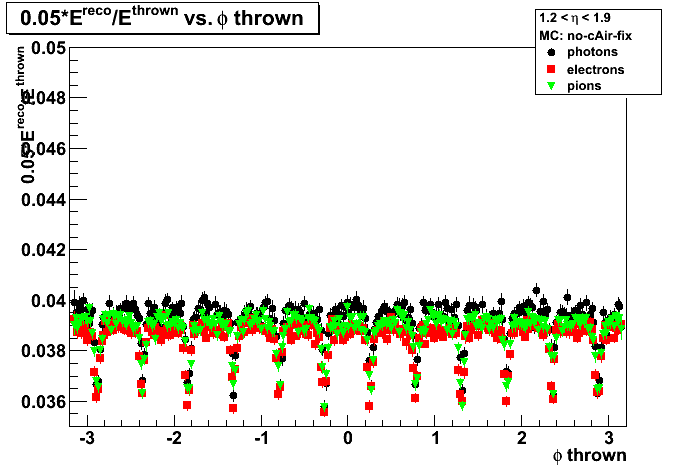
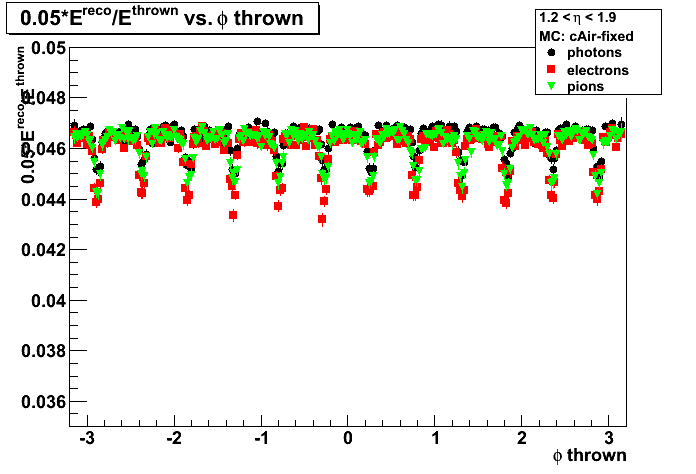
SMD energy
Figure 3a: SMD energy vs. energy thrown


Figure 3b: SMD energy vs. eta thrown
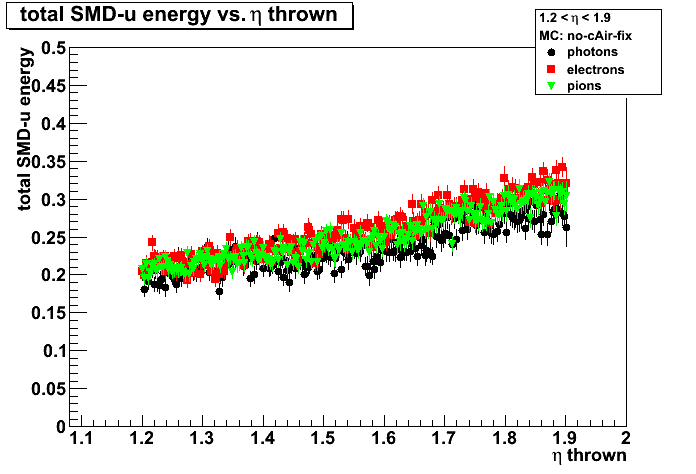
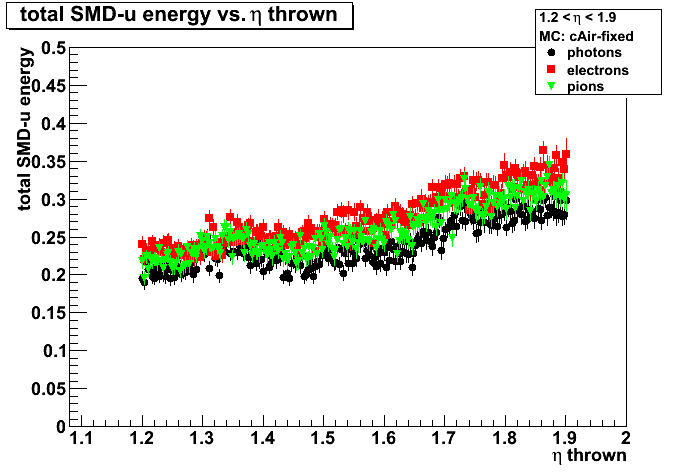
Number of SMD strips fired
Figure 4a: Number of SMD strips fired vs. energy thrown

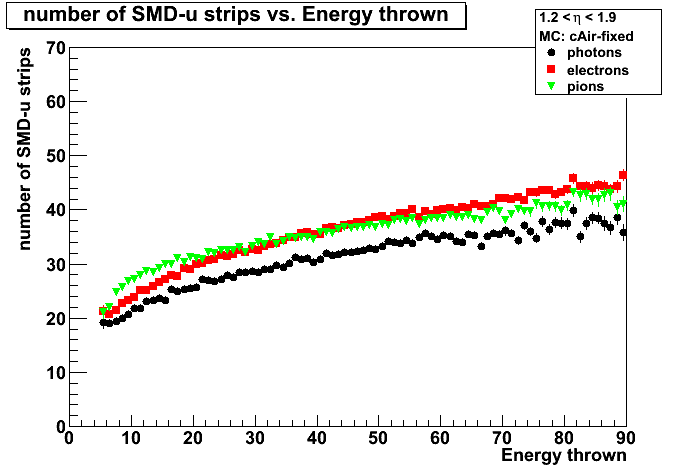
Figure 4b: Number of SMD strips fired vs. eta thrown
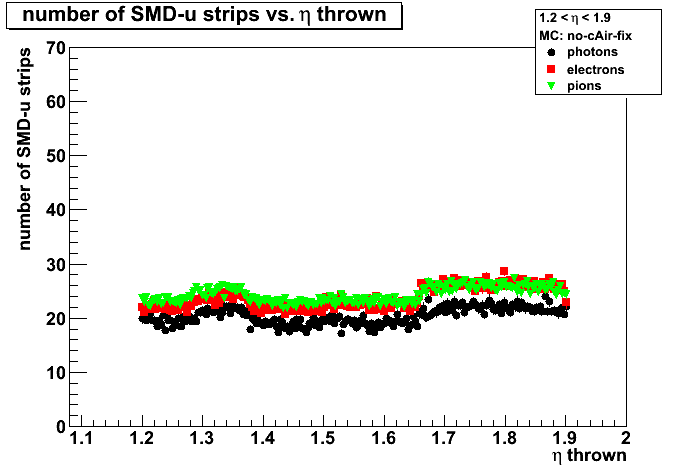
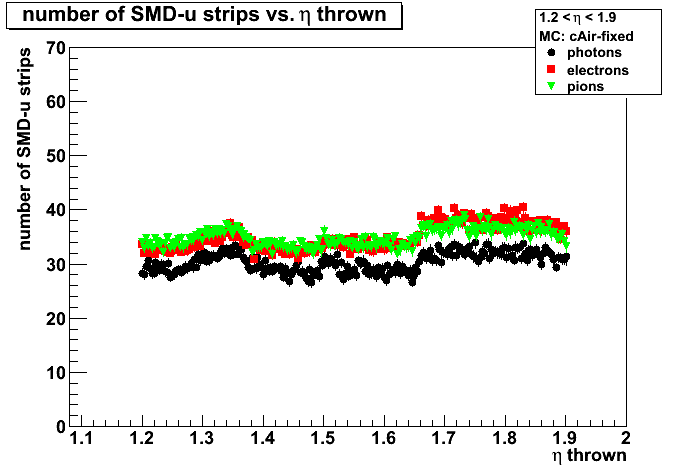
2009.08.25 Test of corrected EEMC geometry: shower shapes
Test of corrected EEMC geometry (bug 1618)
Monte-Carlo setup is desribed here
- One particle per event (photons, electrons, and pions)
- Full STAR 2006 geometry.
In Kumac file: detp geom y2006g; gexec $STAR_LIB/geometry.so - Flat in eta (1.08-2.0), phi (0,2pi), and pt (3-30 GeV)
- Using A2Emaker to get reconstructed Tower/SMD energy (no EEMC SlowSimulator in chain)
what assumes fixed sampling fraction of 0.05 (5%) - Vertex z=0
- ~50K/per particle type
- Non-zero energy: 3 sigma above pedestal
Figure 1:Single photon shower shape before (red) and after (black) EEMC cAir bug fixed
pt=7-8GeV, eta=1.2-1.4 (left), eta=1.6-1.8 (right)
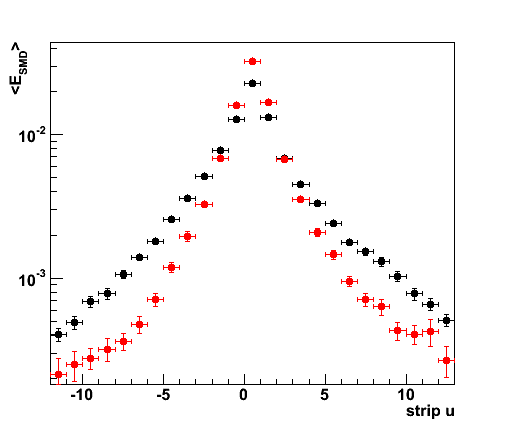
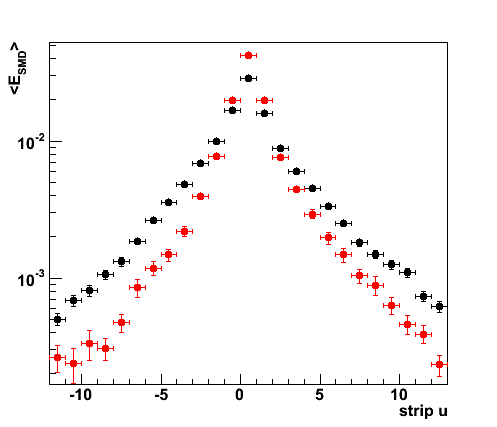
Figure 2: Single photon shower shape vs. data
Monte-Carlo: pt=7-10GeV, eta=1.6-1.8
data: no pre-shower1,2; pt_photon>7, pt_jet>5. no eta cuts.
(see Fig. 1 from here for other pre-shower conditions)
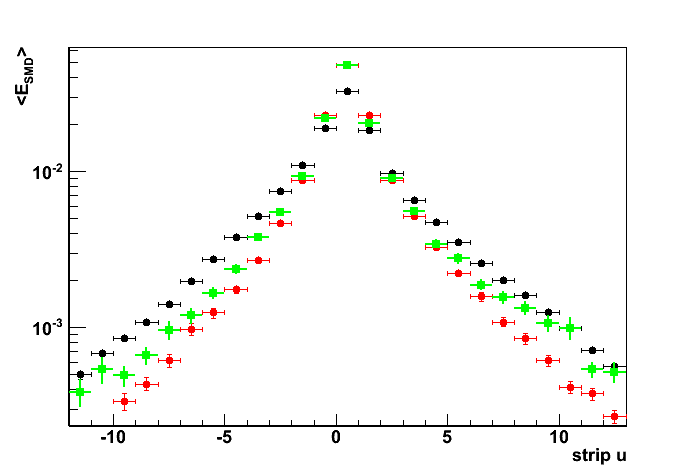
2009.08.27 fixed EEMC geometry: pre-shower sorted shower shapes & eta-meson comparison
Test of corrected EEMC geometry: shower shapes (bug 1618)
Monte-Carlo setup is desribed here
- One particle per event (photons, electrons, and pions)
- Full STAR 2006 geometry.
In Kumac file: detp geom y2006g; gexec $STAR_LIB/geometry.so - Flat in eta (1.08-2.0), phi (0,2pi), and pt (3-30 GeV)
- Using A2Emaker to get reconstructed Tower/SMD energy (no EEMC SlowSimulator in chain)
what assumes fixed sampling fraction of 0.05 (5%) - Vertex z=0
- ~50K/per particle type
- Non-zero energy: 3 sigma above pedestal
Color coding:
- Black - photon (single particle/event MC)
- Red - electron (single particle/event MC)
- Green - neutral pion (single particle/event MC)
- Blue - photons from eta-meson decay (real data)
Single particle shower shape before (left) and after (right) EEMC cAir bug fixed
Single particle kinematic cuts: pt=7-8GeV, eta=1.2-1.4
Eta-meson shower shapes (blue) taken from Fig. 1 from here of this post
All shapes are normalized to 1 at peak (central strip).
Figure 1: Pre-shower bin 0: E_pre1=0; E_pre2=0
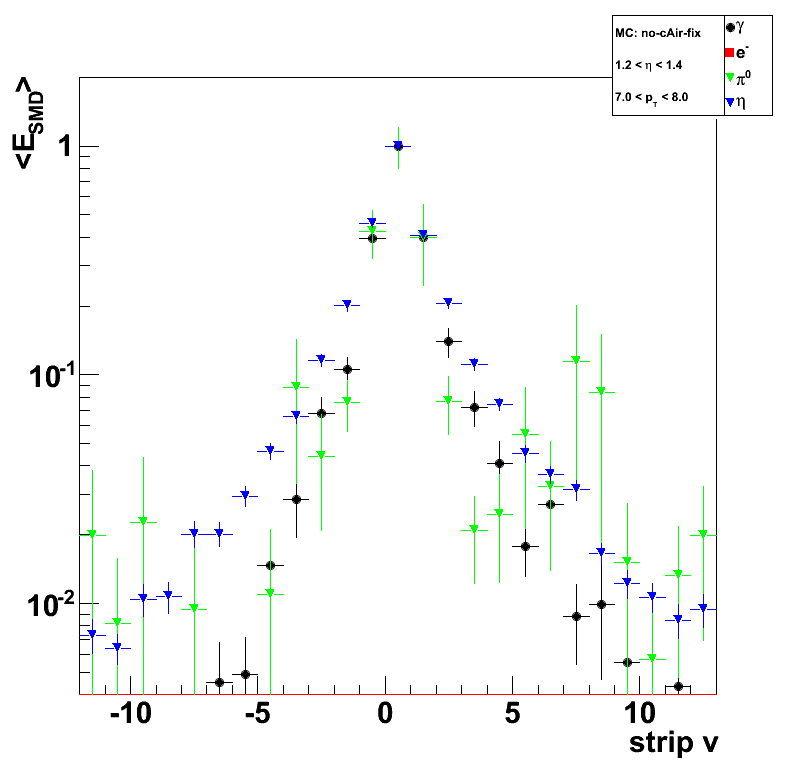
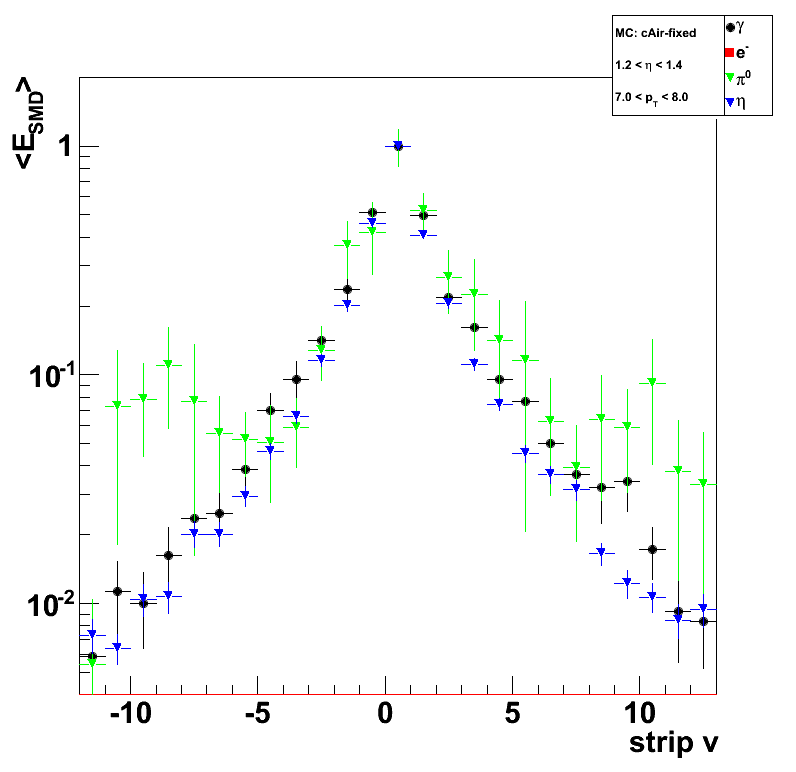
Figure 2: Pre-shower bin 1: E_pre1=0; E_pre2>0
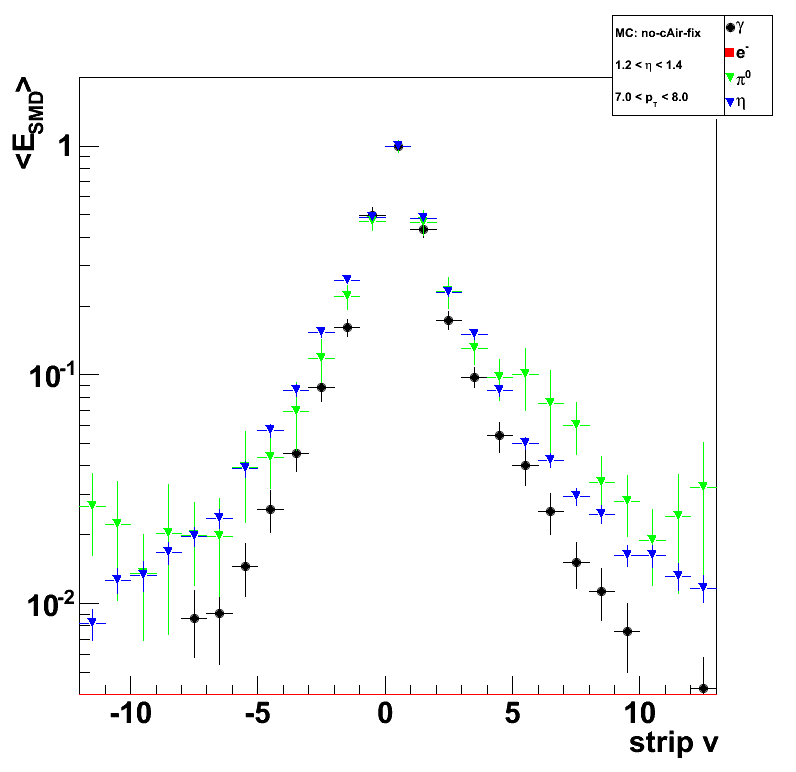
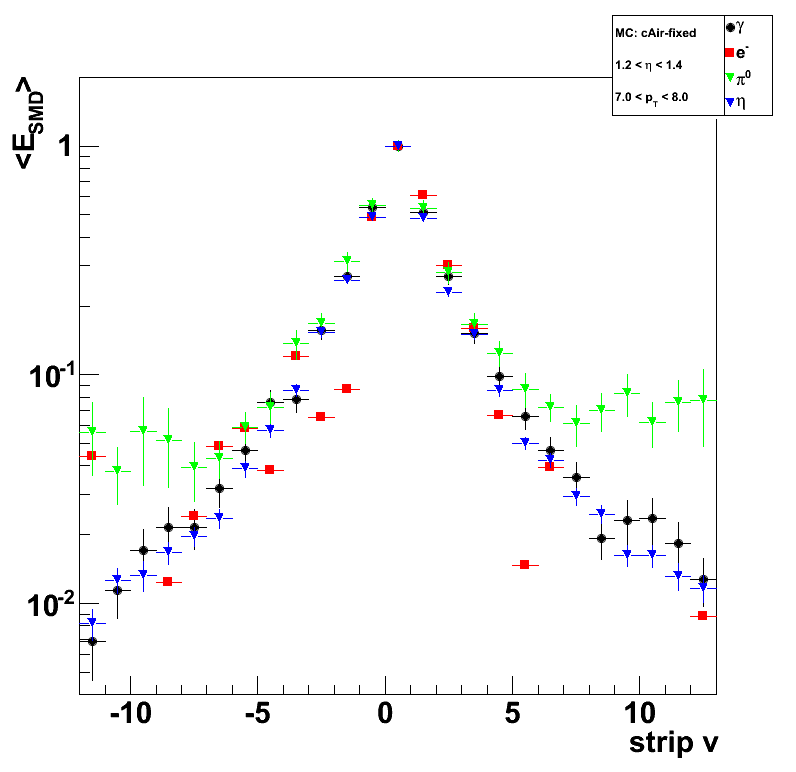
Figure 3: Pre-shower bin 2: E_pre1>0; E_pre1<0.004

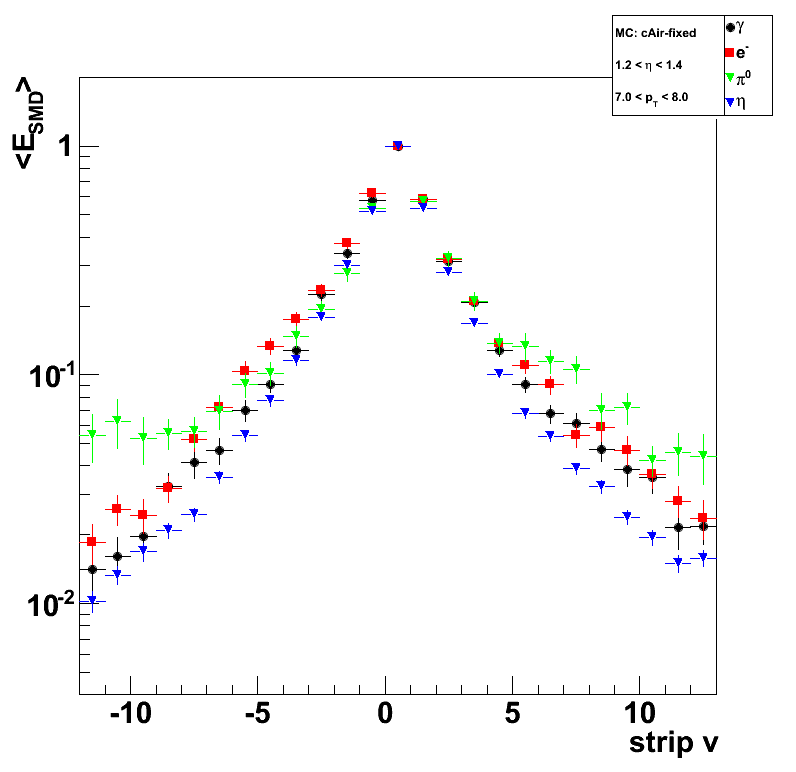
Figure 4: Pre-shower bin 3: E_pre1>0.004; E_pre1<0.01

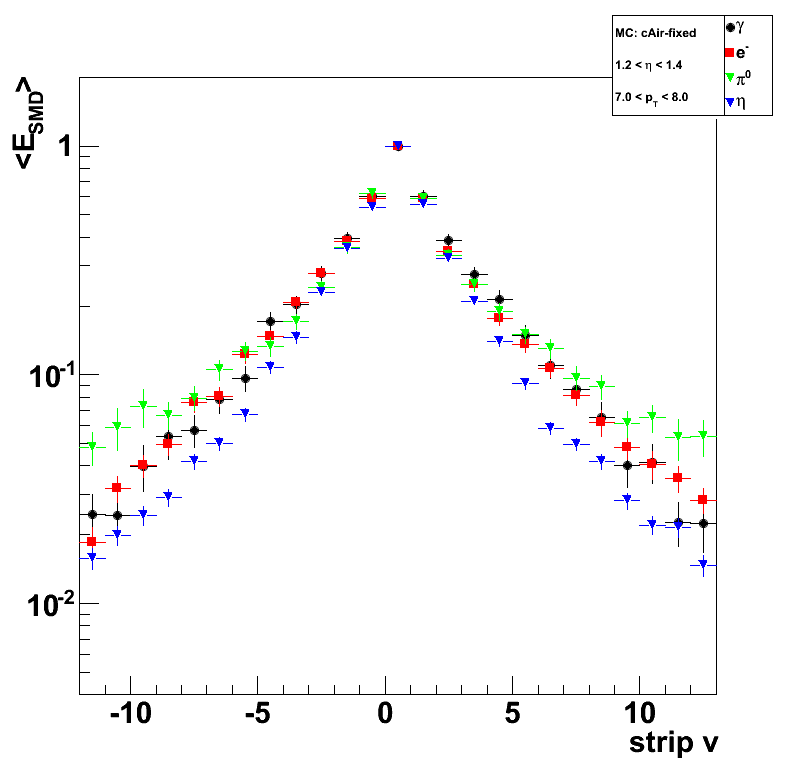
Shower shape ratios
Results only for corrected EEMC geometry
All shapes are divided by MC single-photon shower shape.
Figure 5a: Pre-shower bin 0: E_pre1=0; E_pre2=0
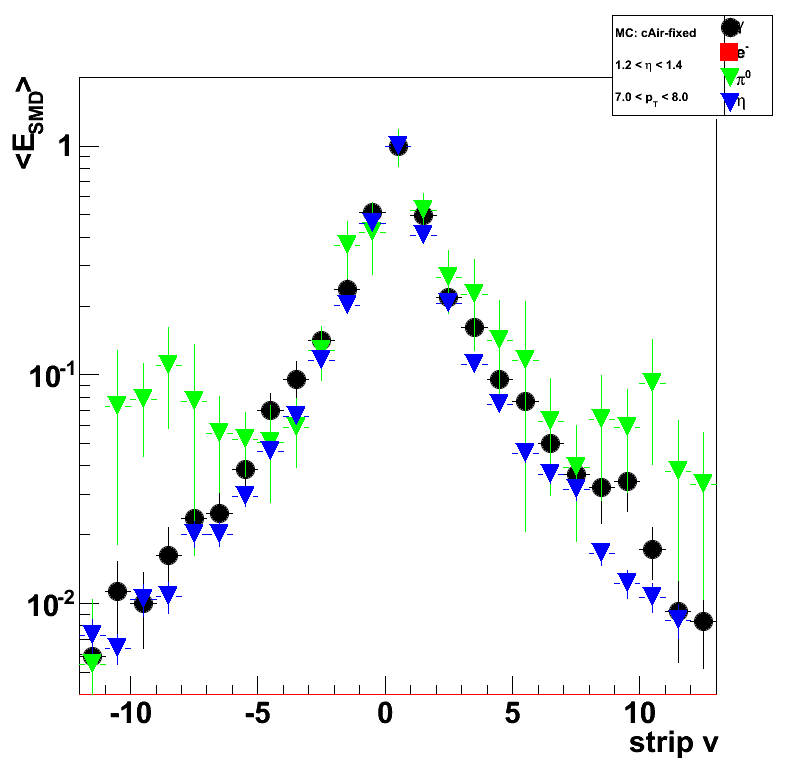
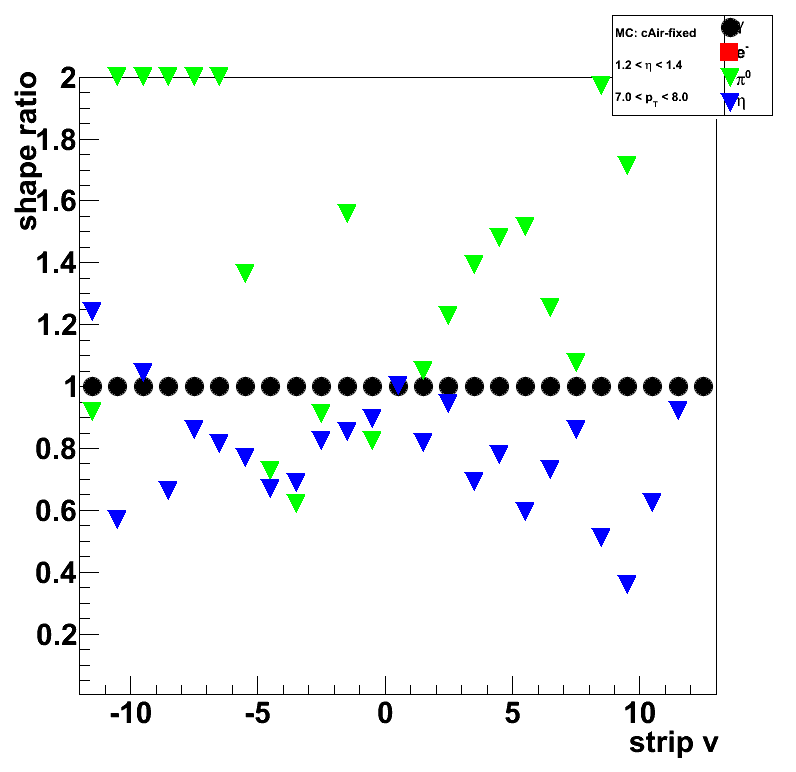
Figure 5b: Pre-shower bin 1: E_pre1=0; E_pre2>0
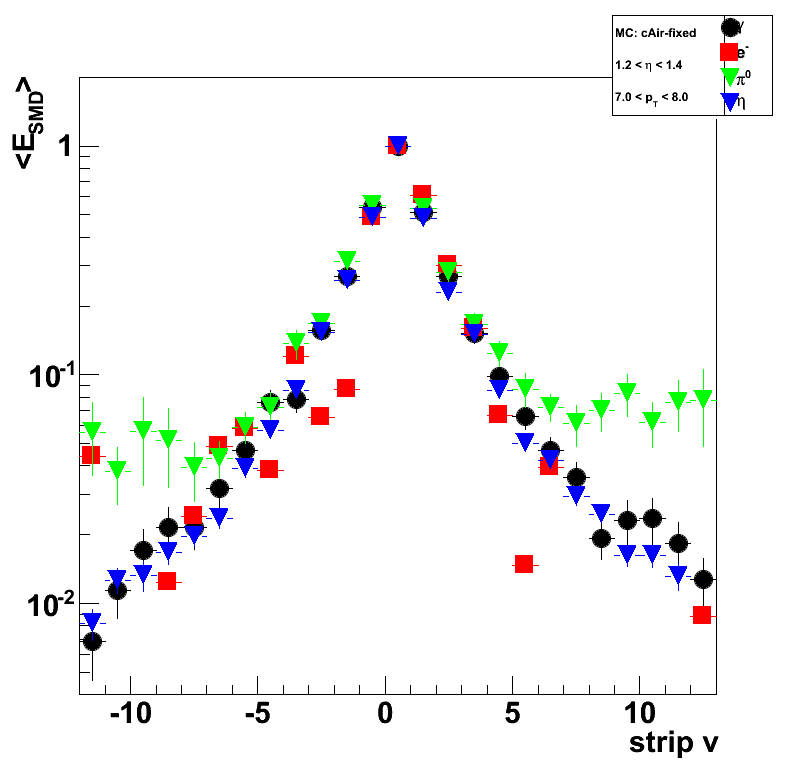
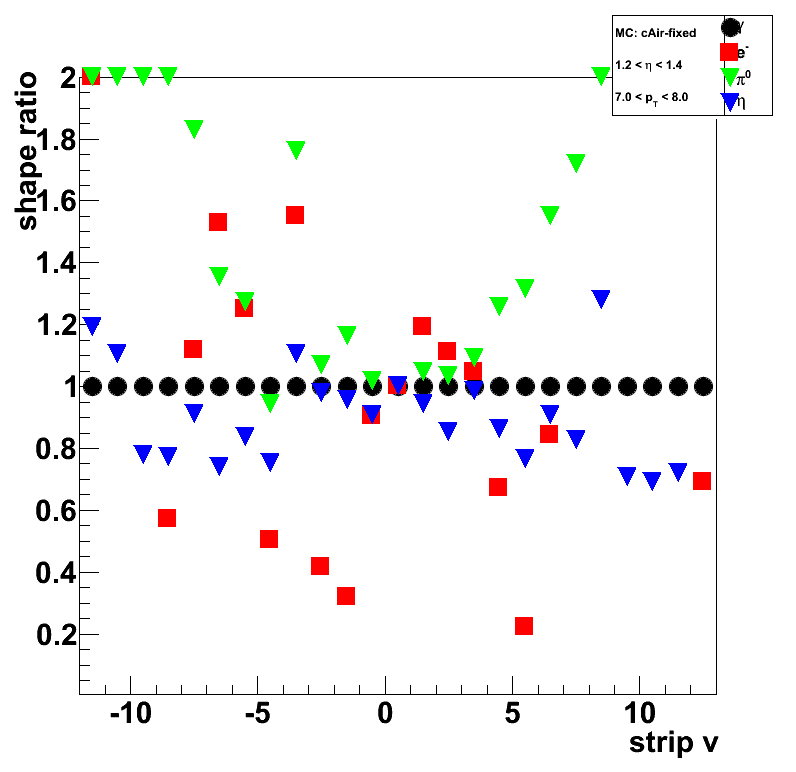
Figure 5c: Pre-shower bin 2: E_pre1>0; E_pre1<0.004
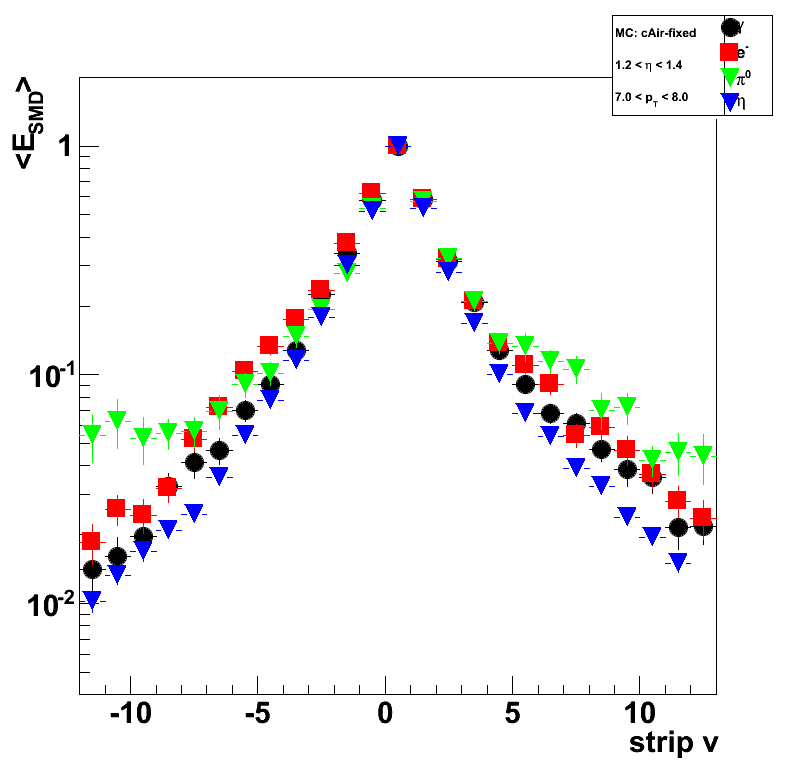
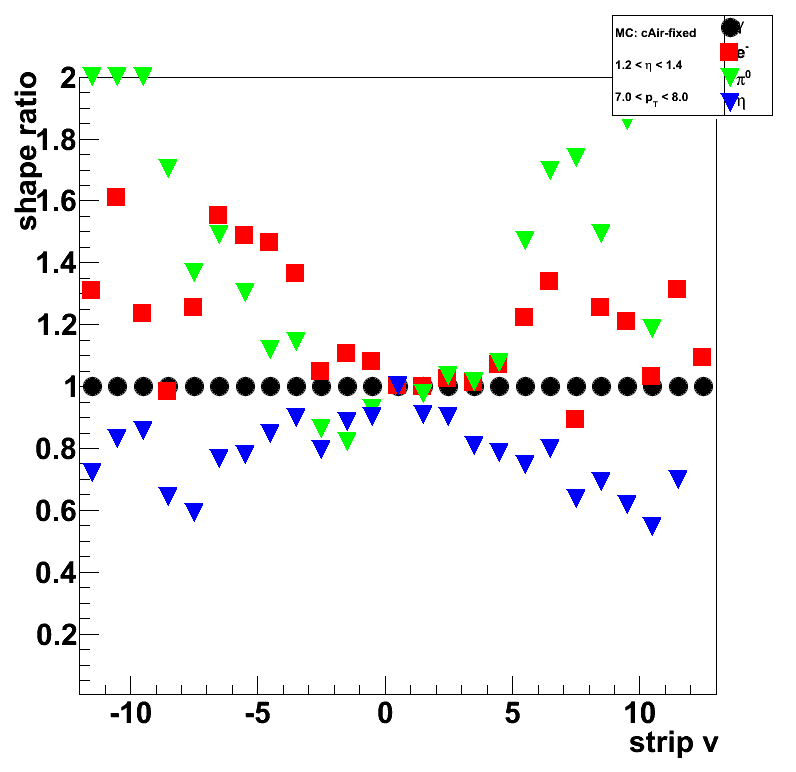
Figure 5d: Pre-shower bin 3: E_pre1>0.004; E_pre1<0.01
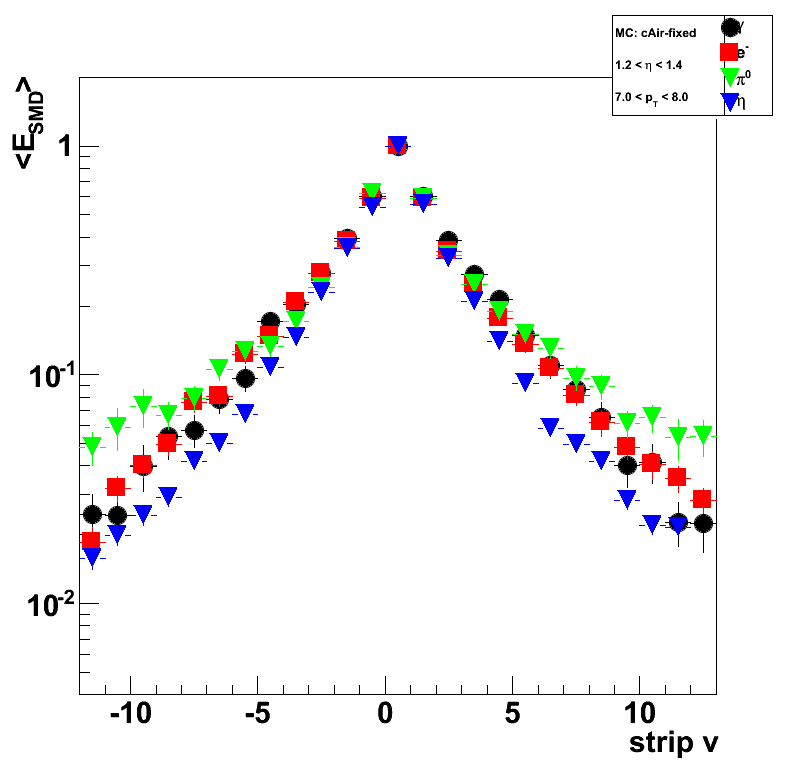
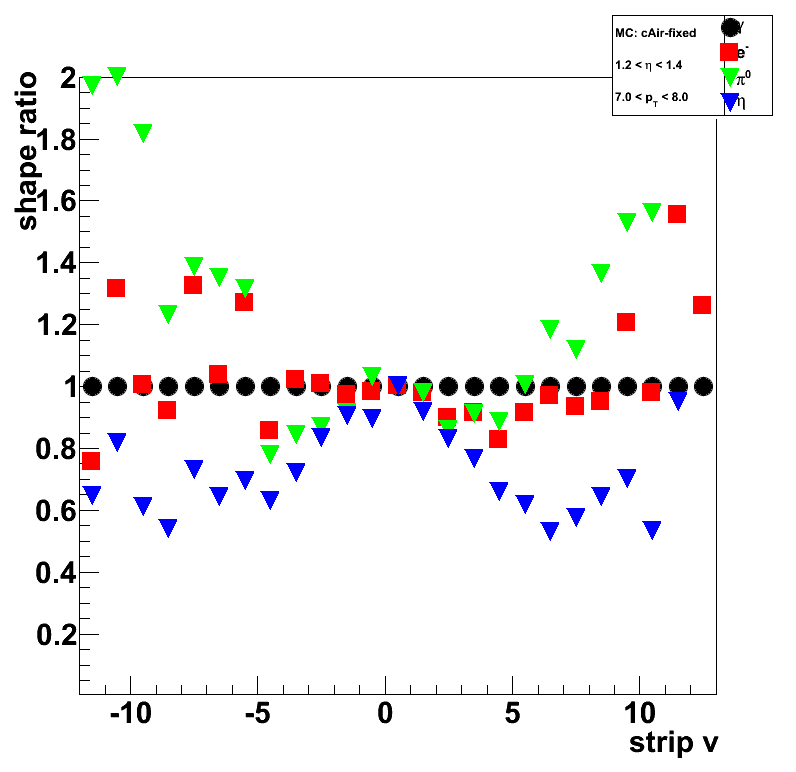
Figure 6: Single photon to eta-meson shape ratios only (with error bars):
Pre-shower bins 0 (upper-left),1 (upper-right),2 (lower-left), and 3 (lower-right)

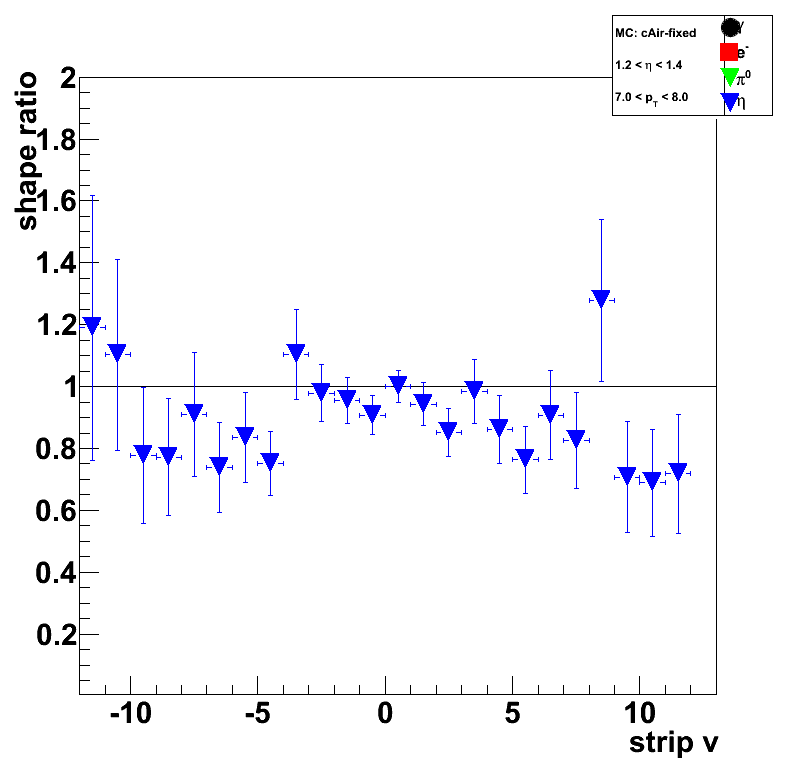
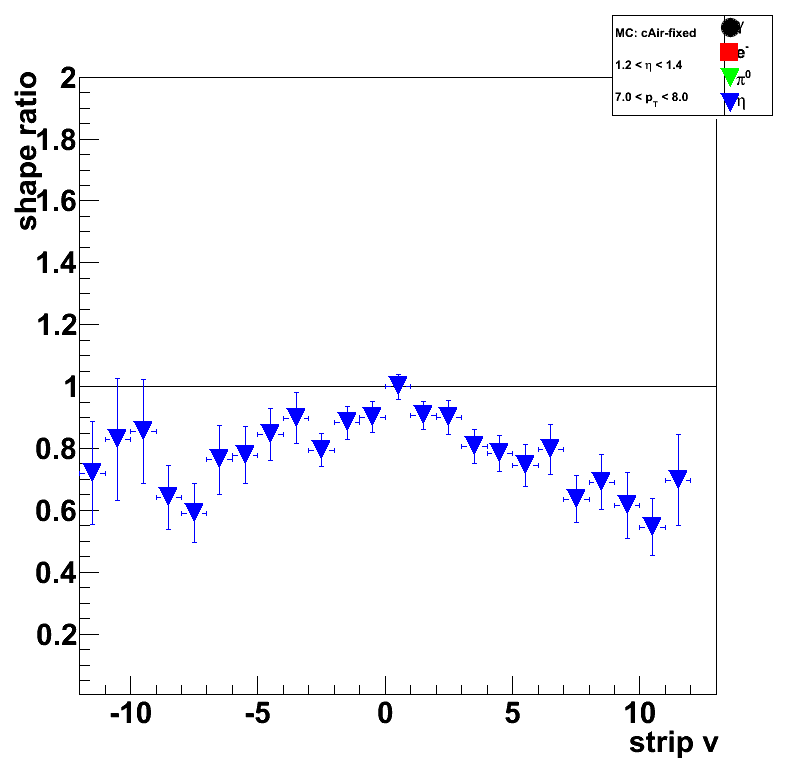

Extracting gamma-jet cross section at forward rapidity from pp@200GeV collisions
Analysis overview
- Data samples, event selection, luminosity determination
- Isolating photon-jet events
- Transverse shower shape analysis
- Isolation cuts
- Cut optimization
- Trigger effects study
- Data to Monte-Carlo comparison/normalization and raw yields
- Acceptance/efficiency corrections
- Corrected yields
- Background subtraction
- Systematic uncertainties
- Comparison with theory
Data samples, event selection, luminosity determination
Real data, and signal/background Monte-Carlo samples:
-
pp@200GeV collisions, STAR produnctionLong.
Trigger: eemc-http-mb-L2gamma [id:137641] (L ~ 3.164 pb^1) -
Pythia prompt photon (signal) Monte-Carlo sample.
Filtered Prompt Photon p6410EemcGammaFilter.
Partonic pt range 2-25 GeV. -
Pythia 2->2 hard QCD processes (background) Monte-Carlo sample.
Filtered QCD p6410EemcGammaFilter.
Partonic pt range 2-25 GeV.
Isolating photon-jet events
- Shower shape analysis
- Isolation cuts
- Energy clustering (2x1 vs. 2x2 vs. 3x3, cluster energy vs. rapidity)
- Charge particle veto
- photon and jet pt balance
- Tower multiplicity
- Cut optimization with LDA.
Input variables (list can be expanded):- Energy fraction in 3x3 cluster within a r=0.7 radius, E_3x3/E_0.7
- Photon-jet pt balance, [pt_gamma-pt_jet]/pt_gamma
- Number of charge tracks within r=0.7 around gamma candidate
- Number of Endcap towers fired within r=0.7 around gamma candidate
- Number of Barrel towers fired within r=0.7 around gamma candidate
- Shower shape analysis: distance to 80% cut line
- Energy fraction in E_2x1 and E_2x2 witin E_3x3
- Energy in post-shower layer under 3x3 tower patch
- Tower energy in 3x3 patch
- SMD-u/v energy in 25 central strips
- SMD-u/v peak energy (in 5 central strips)
Trigger effects study
No studies yet
- Trigger effects vs pt
- Trigger effects vs eta
- What else?
Data to Monte-Carlo comparison/normalization and raw yields
- Overall data to MC normalization based on vertex z distribution
- Data to MC comparison of raw yield in various detector subsystems
- Uncorrected yields optimized with different efficiency/purity
Acceptance/efficiency corrections
No studies yet
- What needs to be studied for acceptance/efficiency effects?
- Converting reconstructed photon (jet) energy/momentum to the true one
- Reconstruction efficiency vs. rapidity, pt, etc
Corrected yields
No studies yet
- Produce acceptance/efficiency corrected yields
Background subtraction
No studies yet
- Statistical background subtraction based on Pythia+GEANT Monte-Carlo
- Estimate systematic uncertainties due to background subtraction
Systematic uncertainties
No studies yet
- Calorimeter energy resolution
- Trigger bias
- Other effects
Comparison with theory
No comparison yet
- Request for pQCD calculations at forward rapidity
09 Sep
September 2009 posts
2009.09.04 Test of corrected EEMC geometry: SVT, slow-simulator on/off, pre-shower migration
Test of corrected EEMC geometry: shower shapes (bug 1618)
Monte-Carlo setup:
- One particle per event (photons, electrons, pions, and eta-meson)
- Full STAR 2006 geometry (with/without SVT)
In Kumac file: detp geom y2006g; gexec $STAR_LIB/geometry.so (remove SVT with SVTT_OFF option) - Throw particles flat in eta (1.08, 2.0), phi (0, 2pi), and pt (6-10 GeV)
- Using A2Emaker to get reconstructed Tower/SMD energy
(with/without EEMC SlowSimulator in chain) - Vertex z=0
- ~50K/per particle type
- Non-zero energy: 3 sigma above pedestal
Color coding:
- Photon (single particle MC)
- Electron (single particle MC)
- Neutral pion (single particle MC)
- Eta-meson (single particle MC)
- Eta-meson [pp2006 data] (single photons from eta-meson decay)
Pre-shower bins:
- Ep1 = 0, Ep2 = 0 (no energy in both EEMC pre-shower layers)
- Ep1 = 0, Ep2 > 0
- 0 < Ep1 < 4 MeV
- 4 < Ep1 < 10 MeV
- Ep1 > 10 MeV
- All pre-shower bins combined
Ep1/Ep2 is the energy deposited in the 1st/2nd EEMC pre-shower layer.
For a single particle MC it is a sum over
all pre-shower tiles in the EEMC with energy of 3 sigma above pedestal.
For eta-meson from pp2006 data the sum is over 3x3 tower patch
Shower shapes
Single particle kinematic cuts: pt=7-8GeV, eta=1.2-1.4
Eta-meson shower shapes (blue) taken from Fig. 1 from here of this post
All shapes are normalized to 1 at peak (central strip)
Figure 1: Shower shape sorted by pre-shower conditions.
cAir-Fixed EEMC geometry (NO slow simulator, WITH SVT)
Ratio plot
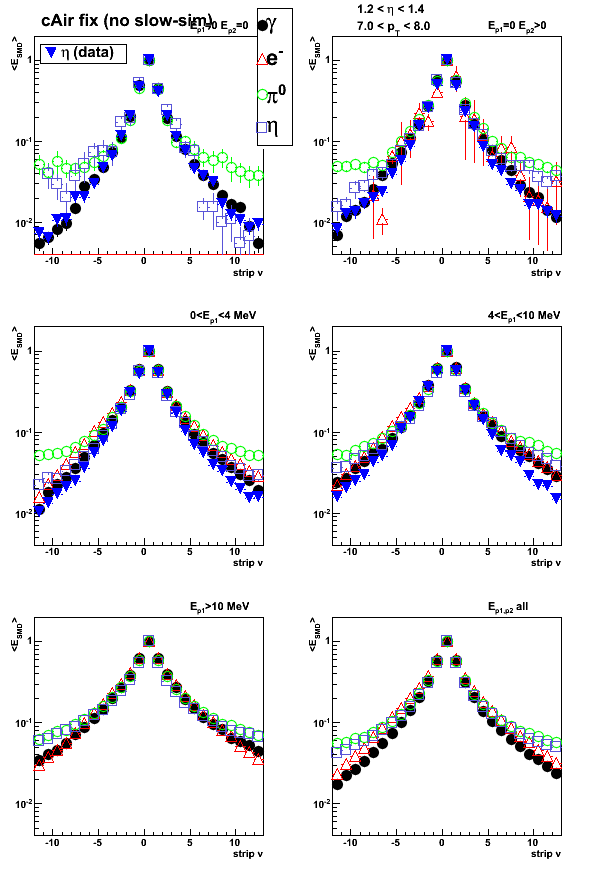
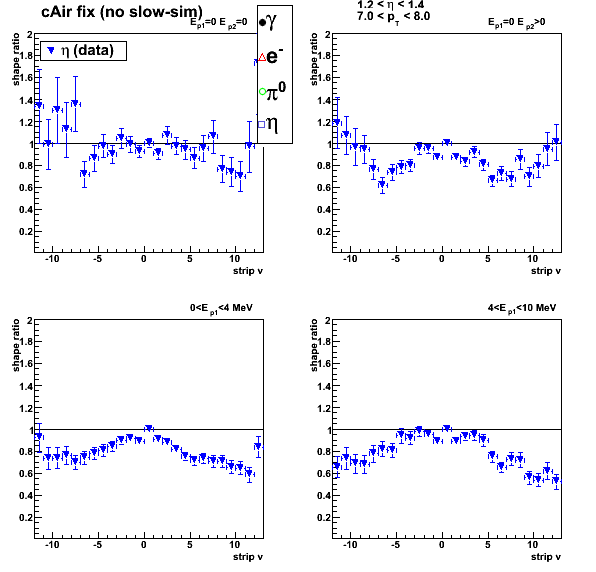
Figure 2: Shower shape sorted by pre-shower conditions.
cAir-Fixed EEMC geometry (NO slow simulator, NO SVT)
Ratio plot
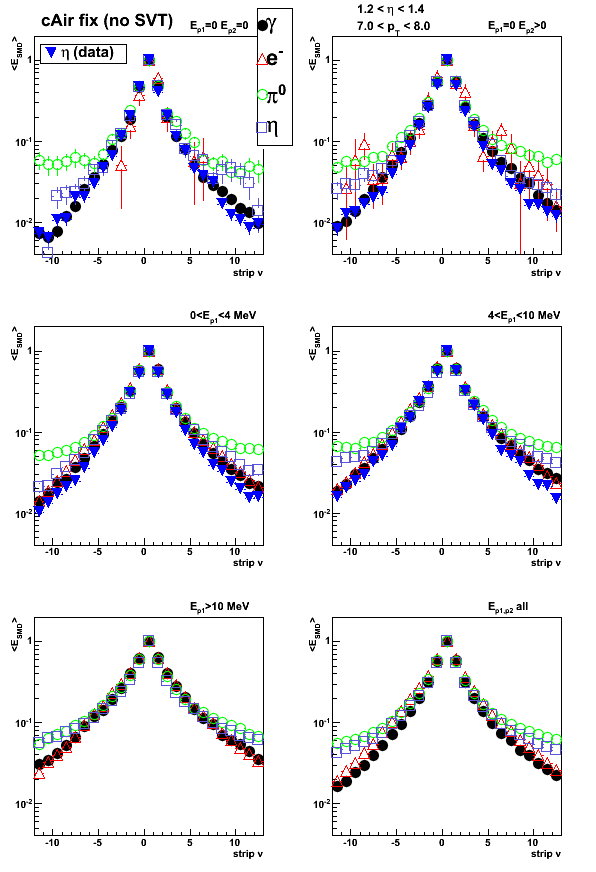
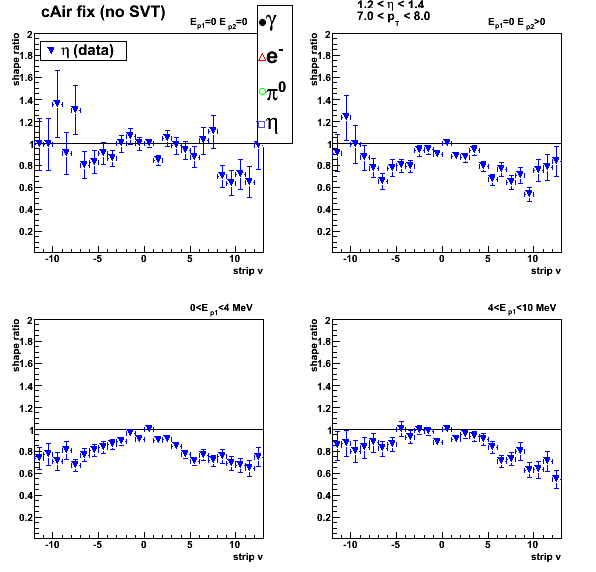
Figure 3: Shower shape sorted by pre-shower conditions.
cAir-Fixed EEMC geometry (WITH slow simulator, WITH SVT)
Ratio plot
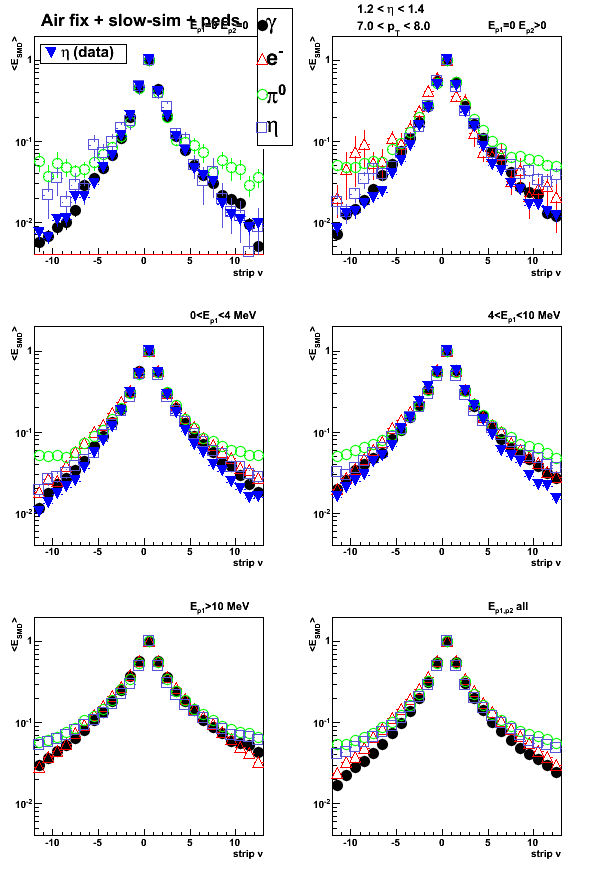
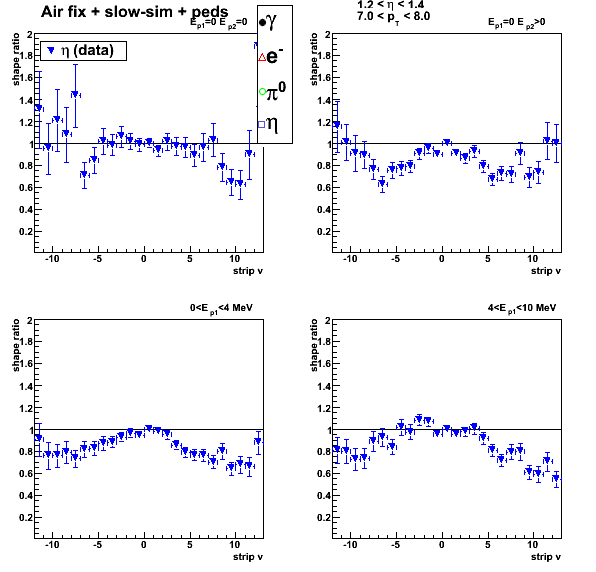
Figure 4: Shower shape sorted by pre-shower conditions.
Old cAir-bug EEMC geometry (NO slow simulator, WITH SVT)
Click here to see the plot
Pre-shower migration with/without SVT
Starting with a fixed (50K events) for each type of particle.
Change in number of counts for a given pre-shower bin
with different detector configuration shows pre-shower migration
Figure 5: Pre-shower migration.
cAir-Fixed EEMC geometry (WITH SVT)
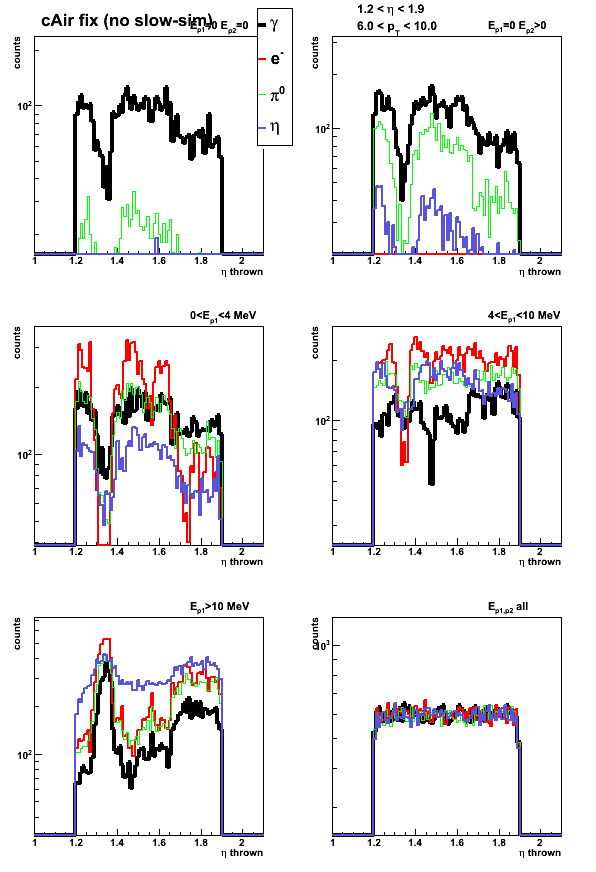
Figure 6: Pre-shower migration.
cAir-Fixed EEMC geometry (WITHOUT SVT)
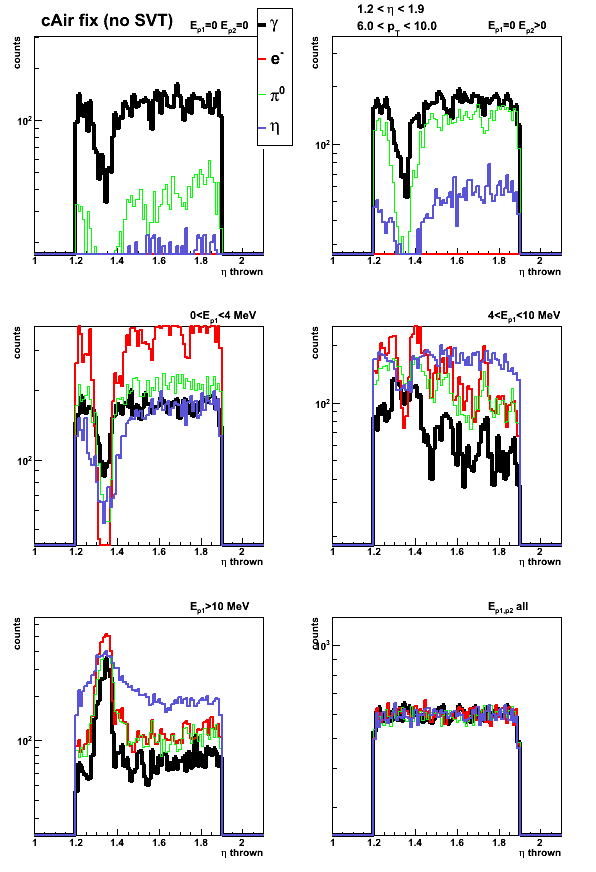
Sampling fraction with/without Slow-simulator
Figure 7: Sampling fraction (0.05 E_reco / E_thrown).
cAir-Fixed EEMC geometry (WITHOUT Slow-simulator)

Figure 8: Sampling fraction (0.05 E_reco / E_thrown).
cAir-Fixed EEMC geometry (WITH Slow-simulator)
Slow simulator introduce some non-linearity in the sampling fraction

Figure 9: Sampling fraction (0.05 E_reco / E_thrown).
cAir-Fixed EEMC geometry (WITHOUT SVT, WITHOUT Slow-simulator)
Click here to see the plot
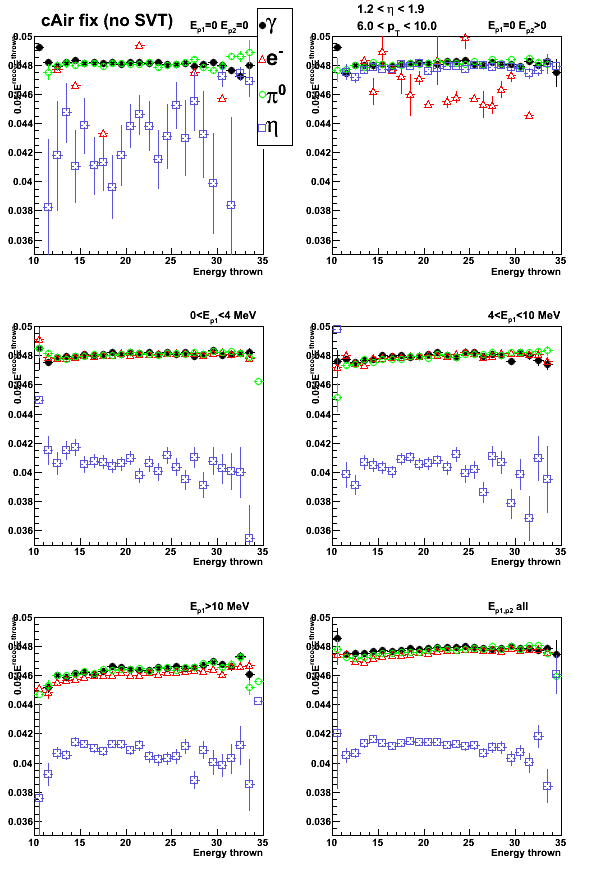
Figure 10: Sampling fraction (0.05 E_reco / E_thrown).
Old cAir-bug EEMC geometry (NO slow simulator, WITH SVT)
Click here to see the plot
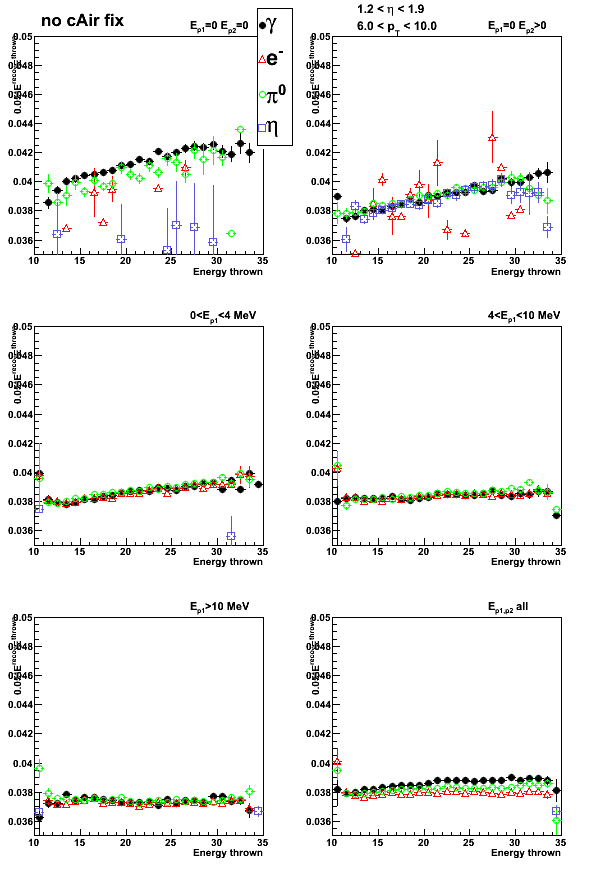
2009.09.11 Test of corrected EEMC geometry: LOW_EM cuts
Test of corrected EEMC geometry: SVT and LOW_EM cuts
Monte-Carlo setup:
- One particle per event (only photons in this post)
- Full STAR 2006 geometry (with/without SVT, LOW_EM cuts)
In Kumac file: detp geom y2006g; gexec $STAR_LIB/geometry.so (vary SVTT_OFF, LOW_EM)
LOW_EM cut definition is given at the end of this page - Throw particles flat in eta (1.2, 1.9), phi (0, 2pi), and pt (6-10 GeV)
- Using A2Emaker to get reconstructed Tower/SMD energy
(this post: no EEMC SlowSimulator) - Vertex z=0
- ~50K/per iteration
- Non-zero energy: 3 sigma above pedestal
Color coding:
- SVT, LOW_EM marked in legend as LowEM (single photon MC)
- STV, no-LOW_EM marked in legend as default (single photon MC)
- no-SVT, no-LOW_EM marked in legend as no-SVT (single photon MC)
- photon-jet candidates [pp2006] (used data points from this post)
- photons from eta-meson [pp2006]
Pre-shower bins:
- Ep1 = Ep2 = 0 (no energy in both EEMC pre-shower layers)
- Ep1 = 0, Ep2 > 0
- 0 < Ep1 < 4 MeV
- 4 < Ep1 < 10 MeV
- Ep1 > 10 MeV
- All pre-shower bins combined
Note: Ep1/Ep2 is the energy deposited in the 1st/2nd EEMC pre-shower layer.
For a single photon MC it is a sum over
all pre-shower tiles in the EEMC with energy of 3 sigma above pedestal.
For eta-meson/gamma-jet candidates from pp2006 data the sum is over 3x3 tower patch
Shower shapes
Single particle kinematic cuts: pt=7-8GeV, eta=1.2-1.4
Eta-meson shower shapes (blue) taken from Fig. 1 from here of this post
All shapes are normalized to 1 at peak (central strip)
Figure 1: Shower shape sorted by pre-shower conditions.

Figure 2: Shower shape ratio. All shapes in Fig. 1 are divided by single photon shape
for "SVT+LOW_EM" configuration (black circles in Fig. 1)
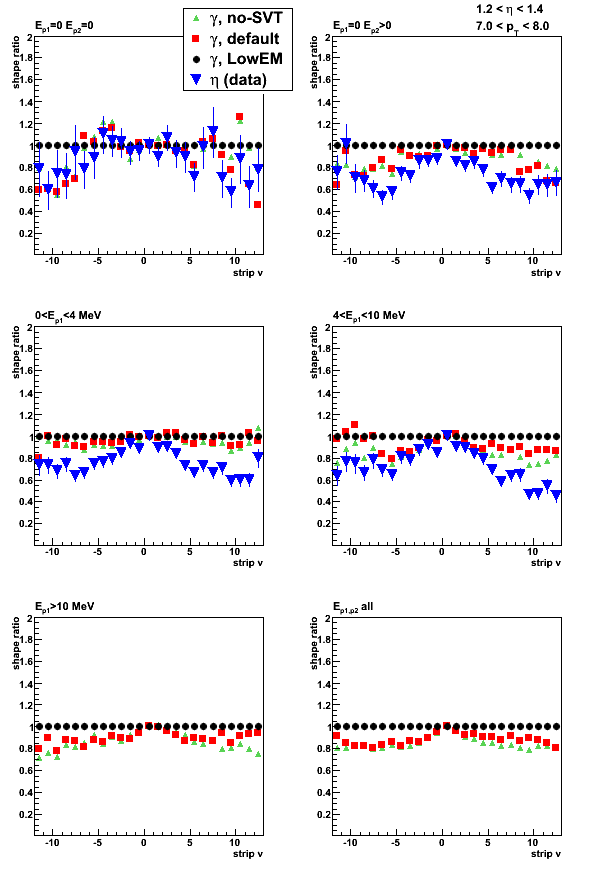
Sampling fraction
Figure 3: Sampling fraction (0.05 * E_reco/ E_thrown)
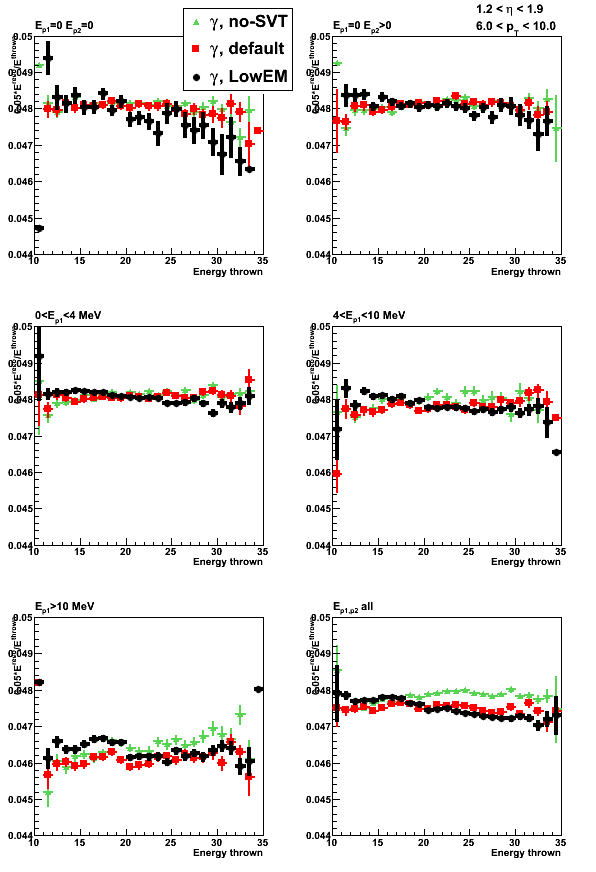
Pre/post-shower energy and migration
Figure 4: Pre-shower1 energy (all tiles)

Figure 5: Pre-shower2 energy (all tiles)

Figure 6: Post-shower energy (all tiles)
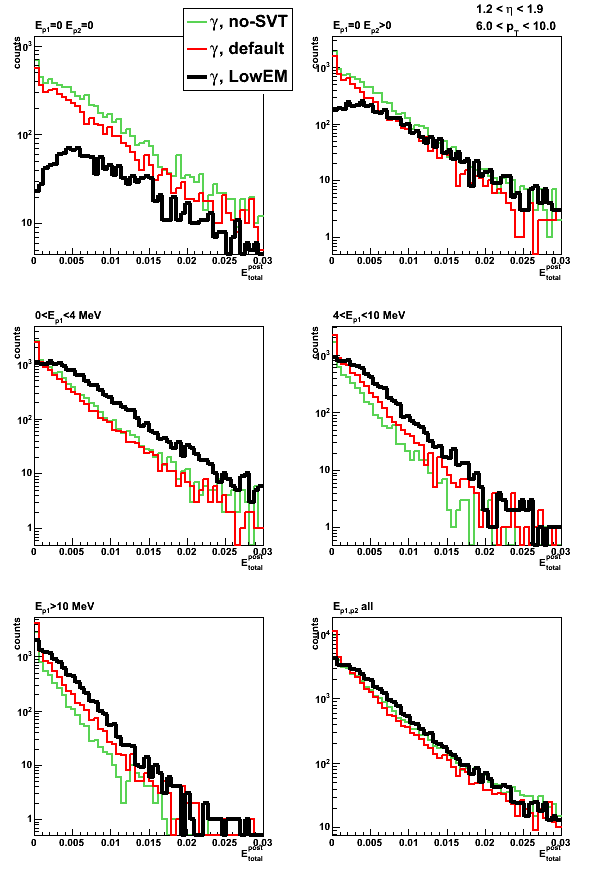
Figure 7: Pre-shower bin photon migration

Tower energy profile
Figure 8a: Energy ratio in 2x1 to 3x3 cluster
For the first 4 pre-shower bins total yield in MC is normalized to that of the data
Blue circles indicate photon-jet candidates [pp2006] (points from this post)
Same data on a linear scale

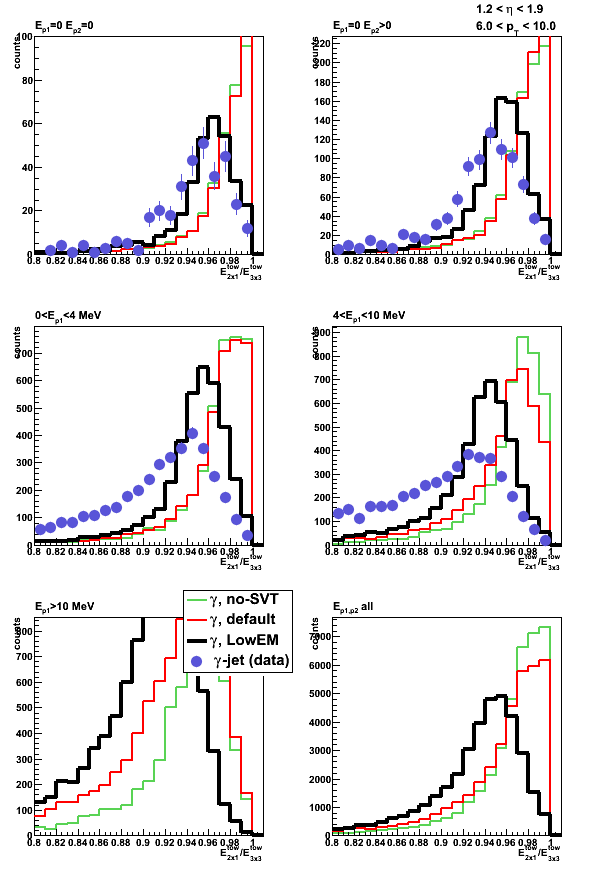
Figure 8b: Energy ratio in 2x1 to 3x3 cluster: 7 < pt < 8 and 1.2 < eta < 1.4
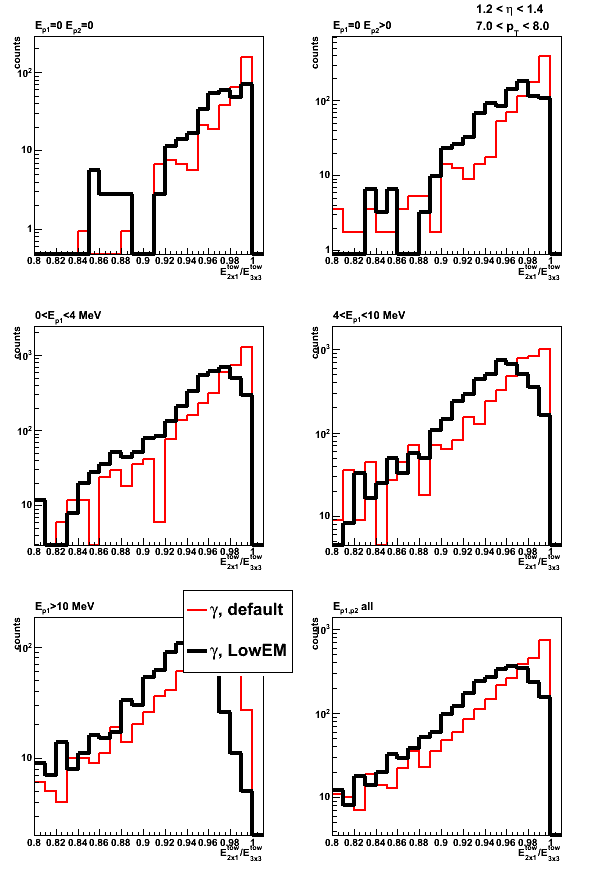
Figure 8c: Energy ratio in 2x1 to 3x3 cluster: 7 < pt < 8 and 1.6 < eta < 1.8
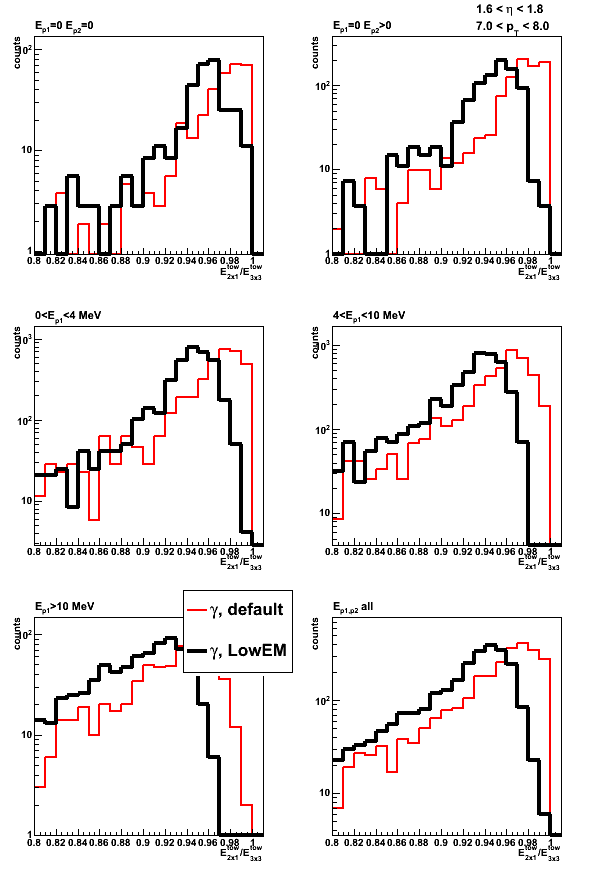
Figure 9: Average energy ratio in 2x1 to 3x3 cluster vs. thrown energy
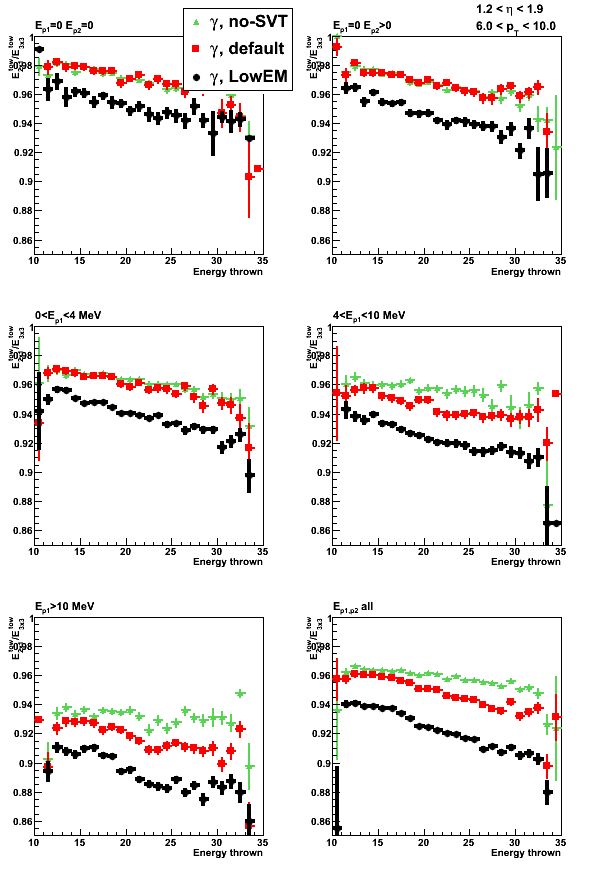
Figure 10: Average energy ratio in 2x1 to 3x3 cluster vs. thrown energy

LOW_EM cut definition
LOW_EM option for the STAR geometry (Low cuts on Electro-Magnetic processes)
is equivalent to the following set of GEANT cuts:
- CUTGAM=0.00001
- CUTELE=0.00001
- BCUTE =0.00001
- BCUTM =0.00001
- DCUTE =0.00001
- DCUTM =0.00001
All these values are for kinetic energy in GeV.
Cut meaning and GEANT default values:
- CUTGAM threshold for gamma transport (0.001);
- CUTELE threshold for electron and positron transport (0.001);
- BCUTE threshold for photons produced by electron bremsstrahlung (-1,);
- BCUTM threshold for photons produced by muon bremsstrahlung (-1);
- DCUTE threshold for electrons produced by electron delta-rays (-1);
- DCUTM threshold for electrons produced by muon or hadron delta-rays (-1);
Some details can be found at this link and in the GEANT manual
10 Oct
October 2009 posts
2009.10.02 Jason vs. CVS EEMC geometry: sampling fraction and shower shapes

Tests with Jason geometry file (ecalgeo.g23)
Monte-Carlo setup:
- One photon per event
- EEMC only geometry with LOW_EM option
- Throw particles flat in eta (1.08, 2.0), phi (0, 2pi), and pt (6-10 GeV)
- Using A2Emaker to get reconstructed Tower/SMD energy
(no EEMC SlowSimulator in chain) - Vertex z=0
- ~50K/per particle type
- Non-zero energy: 3 sigma above pedestal
Color coding:
- Photon with Jason geometry (single particle MC)
- Photon with CVS (cAir fix) geometry (single particle MC)
- Eta-meson [pp2006 data] (single photons from eta-meson decay)
Sampling fraction
Figure 1: Sampling fraction vs. thrown energy (upper plot)
and vs. azimuthal angle (lower left) and rapidity (lower right)

Shower shapes
Single particle kinematic cuts: pt=7-8GeV, eta=1.2-1.4
Eta-meson shower shapes (blue) taken from Fig. 1 from here of this post
All shapes are normalized to 1 at peak (central strip)
Figure 2: Shower shapes
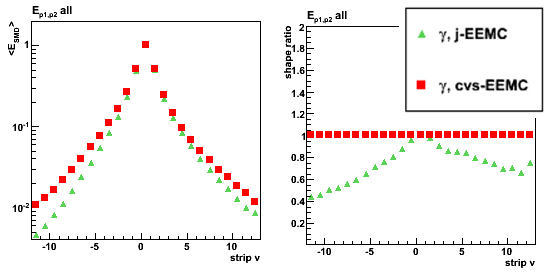
Shower shapes sorted by pre-shower energy
Pre-shower bins:
- Ep1 = 0, Ep2 = 0 (no energy in both EEMC pre-shower layers)
- Ep1 = 0, Ep2 > 0
- 0 < Ep1 < 4 MeV
- 4 < Ep1 < 10 MeV
- Ep1 > 10 MeV
- All pre-shower bins combined
Ep1/Ep2 is the energy deposited in the 1st/2nd EEMC pre-shower layer.
For a single particle MC it is a sum over
all pre-shower tiles in the EEMC with energy of 3 sigma above pedestal.
For eta-meson from pp2006 data the sum is over 3x3 tower patch
Figure 3: Shower shapes (left) and their ratio (right)
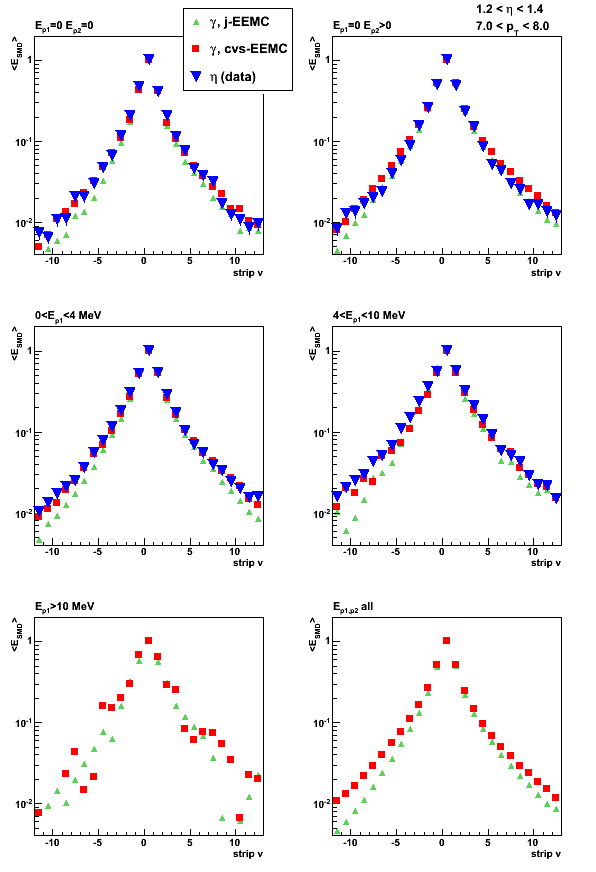
Figure 4: Shower shape ratios

2009.10.05 Fix to the Jason geometry file
Why volume numbers has changed in Jason geometry file?
The number of nested volumes (nv),
is the total number of parent volumes for the sensitive volume
(sensitive volume is indicated by the HITS in the tree structure below).
For the Jason and CVS files this nv number seems to be the same
(see block tree structures below).
Then why volume ids id in g2t tables has changed?
The answer I found (which seems trivial to me know)
is that in the original (CVS) file ECAL
block has been instantiated (positioned) twice.
The second appearance is the prototype (East) version of the Endcap
(Original ecalgeo.g from CVS)
        if (emcg_OnOff==1 | emcg_OnOff==3) then
             Position ECAL in CAVE z=+center
        endif
        if (emcg_OnOff==2 | emcg_OnOff==3) then
             Position ECAL in CAVE z=-center ThetaZ=180
        endif
In Jason version the second appearance has been removed
(what seems natural and it should not have any effect)
(ecalgeo.g Jason edits, g23):
        IF (emcg_OnOff>0) THEN
           Create ECAL

              .....

        IF (emcg_OnOff==2 ) THEN
           Prin1
             ('East Endcap has been removed from the geometry' )
        ENDIF               EndIF! emcg_OnOff
Unfortunately, this affects the way GEANT counts nested volumes
(effectively the total number was reduced by 1, from 8 to 7)
and this is the reason why the volume numbering scheme
in g2t tables has been affected.
I propose to put back these East Endcap line back,
since in this case it will not require any additional
changes to the EEMC decoder and g2t tables.
Block tree of the geometry file
blue - added volumes in Jason file
red - G10 volume removed in Jason file
HITS - sensitive volumes
---- Jason file ----
ECAL
EAGA
|EMSS
| -EFLP
| |ECVO
| | |EMOD
| | | |ESEC
| | | | |ERAD
| | | | | -ELED
| | | | |EMGT
| | | | | |EPER
| | | | | | |ETAR
| | | | | | | -EALP
| | | | | | | -ESCI -> HITS
| |ESHM
| | |ESPL
| | | |EXSG
| | | | -EXPS
| | | | -EHMS -> HITS
| | | | -EBLS
| | | | -EFLS
| | |ERSM
| -ESSP
| -ERCM
| -EPSB
|ECGH
| -ECHC
---- CVS file ----
ECAL
EAGA
|EMSS
| -EFLP
| |ECVO
| | |EMOD
| | | |ESEC
| | | | |ERAD
| | | | | -ELED
| | | | |EMGT
| | | | | |EPER
| | | | | | |ETAR
| | | | | | | -EALP
| | | | | | | -ESCI -> HITS
| |ESHM
| | |ESPL
| | | |EXSG
| | | | -EHMS -> HITS
| | | -EXGT
| | -ERSM
| -ESSP
| -ERCM
| -EPSB
|ECGH
| -ECHC
Block definitions
Jason geometry file
Create ECAL

Block ECAL is one EMC EndCap wheel
  Create and Position EAGA AlphaZ=halfi
EndBlock

Block EAGA IS HALF OF WHEEL AIR VOLUME FORTHE ENDCAP MODULE
  Create AND Position EMSS konly='MANY'
  Create AND Position ECGH alphaz=90 kOnly='ONLY'
EndBlock

Block EMSS is the steel support of the endcap module
  Create AND Position EFLP z=zslice-center+zwidth/2
  Create AND Position ECVO z=zslice-center+zwidth/2
  Create AND Position ESHM z=zslice-center+zwidth/2 kOnly='MANY'
  Create AND Position ECVO z=zslice-center+zwidth/2
  Create AND Position ESSP z=zslice-center+zwidth/2
  Create ERCM
  Create EPSB
EndBlock

Block ECVO is one of endcap volume with megatiles and radiators
  Create AND Position EMOD alphaz=d3 ncopy=i_sector
EndBlock

Block ESHM is the shower maxsection
  Create and Position ESPL z=currentk Only='MANY'
  Create ERSM
EndBlock

Block ECGH is air gap between endcap half wheels
  Create ECHC
EndBlock

Block ECHC is steel endcap half cover
EndBlock

Block ESSP is stainless steelback plate
EndBlock

Block EPSB IS A PROJECTILE STAINLESS STEEL BAR
EndBlock

Block ERCM is stainless steel tie rod in calorimeter sections
EndBlock

Block ERSM is stainless steel tie rod in shower max
EndBlock

Block EMOD (fsect,lsect) IS ONE MODULEOF THE EM ENDCAP
  Create AND Position ESEC z=section-curr+secwid/2
EndBlock

Block ESEC is a single em section
  Create AND Position ERAD z=length+(cell)/2+esec_deltaz
  Create AND Position EMGT z=length+(gap+cell)/2+esec_deltaz
  Create AND Position ERAD z=length+cell/2+esec_deltaz
EndBlock

Block EMGT is a 30 degree megatile
  Create AND Position EPER alphaz=myPhi
EndBlock

Block EPER is a 5 degree slice of a 30 degree megatile (subsector)
  Create and Position ETAR x=(rbot+rtop)/2ort=yzx
EndBlock

Block ETAR is a single calorimeter cell, containing scintillator, fiber router, etc...
  Create AND Position EALP y=(-megatile+emcs_alincell)/2
  Create AND Position ESCI y=(-megatile+g10)/2+emcs_alincell _
EndBlock

Block ESCI is the active scintillator (polystyrene) layer
EndBlock

Block ERAD is the lead radiator with stainless steel cladding
  Create AND Position ELED
EndBlock

Block ELED is a lead absorber plate
EndBlock

Block EFLP is the aluminum (aluminium) front plate of the endcap
EndBlock

Block EALP is the thin aluminium plate in calorimeter cell
EndBlock

Block ESPL is the logical volume containing an SMD plane
  Create and Position EXSG alphaz=d3 ncopy=isec kOnly='MANY'
  Create and Position EXSG alphaz=d3 ort=x-y-z ncopy=isec kOnly='MANY'
  Create and Position EXSG alphaz=d3 ncopy=isec kOnly='MANY'
  Create and Position EXSG alphaz=d3 ort=x-y-z ncopy=isec kOnly='MANY'
  Create and Position EXSG alphaz=d3 ncopy=isec kOnly='MANY'
EndBlock

Block EXSG Is another logical volume... this one acutally creates the planes
  Create and Position EXPS kONLY='MANY'
  Create and Position EHMS x=xc y=yc alphaz=-45 kOnly='ONLY'
  Create and Position EBLS x=xc y=yc z=(+esmd_apex/2+esmd_back_layer/2) alphaz=-45 kOnly='ONLY'
  Create and Position EHMS x=xc y=yc alphaz=-45 ort=x-y-z kOnly='ONLY'
  Create and Position EFLS x=xc y=yc z=(-esmd_apex/2-esmd_front_layer/2) alphaz=-45 ort=x-y-z kOnly='ONLY'
EndBlock

Block EHMS defines the triangular SMD strips
Endblock! EHMS

Block EFLS is the layer of material on the front of the SMD planes
EndBlock! EFLS

Block EBLS is the layer of material on the back of the SMD planes
EndBlock! EFLS

Block EXPS is the plastic spacer in the shower maximum section
EndBlock
CVS geometry file
Create ECAL

Block ECAL is one EMC EndCap wheel
  Create and Position EAGA AlphaZ=halfi
EndBlock

Block EAGA is half of wheel air volume forthe EndCap module
  Create and Position EMSS konly='MANY'
  Create and Position ECGH AlphaZ=90 konly='ONLY'
EndBlock

Block EMSS is steel support of the EndCap module
  Create and Position EFLP z=zslice-center+slcwid/2
  Create and Position ECVO z=zslice-center+slcwid/2
  Create and Position ESHM z=zslice-center+slcwid/2
  Create and Position ECVO z=zslice-center+slcwid/2
  Create and Position ESSP z=zslice-center+slcwid/2
  Create ERCM
  Create EPSB
EndBlock

Block ECVO is one of EndCap Volume with megatiles and radiators
  Create and Position EMOD AlphaZ=d3 Ncopy=J_section
EndBlock

Block ESHM is the SHower Maxsection
  Create and Position ESPL z=current
  Create ERSM
Endblock

Block ECGH is air Gap between endcap Half wheels
  Create ECHC
EndBlock

Block ECHC is steel EndCap Half Cover
EndBlock

Block ESSP is Stainless Steelback Plate
endblock

Block EPSB is Projectile Stainless steel Bar
endblock

Block ERCM is stainless steel tie Rod in CaloriMeter sections
endblock

Block ERSM is stainless steel tie Rod in Shower Max
endblock

Block EMOD is one moduleof the EM EndCap
  Create and Position ESEC z=section-curr+secwid/2
endblock

Block ESEC is a single EM section
  Create and Position ERAD z=len + (cell)/2
  Create and Position EMGT z=len +(gap+cell)/2
  Create and Position ERAD z=len + cell/2
Endblock

Block EMGT is a megatile EM section
  Create and Position EPER AlphaZ=(emcs_Nslices/2-isec+0.5)*dphi
Endblock

Block EPER is a EM subsection period (super layer)
  Create and Position ETAR x=(RBot+RTop)/2ORT=YZX
EndBlock

Block ETAR is one CELL of scintillator, fiber and plastic
  Create and Position EALP y=(-mgt+emcs_AlinCell)/2
  Create and Position ESCI y=(-mgt+G10)/2+emcs_AlinCell _
EndBlock

Block ESCI is the active scintillator (polystyren) layer
endblock

Block ERAD is radiator
  Create and PositionELED
endblock

Block ELED is lead absorber Plate
endblock

Block EFLP is First Aluminium plate
endblock

Block EALP is ALuminiumPlate in calorimeter cell
endblock

Block ESPL is one of the Shower maxPLanes
  Create and position EXSG AlphaZ=d3Ncopy=isec
  Create and position EXSG AlphaZ=d3Ncopy=isec
  Create and position EXGT z=msecwd AlphaZ=d3
  Create and position EXSG AlphaZ=d3 ORT=X-Y-Z Ncopy=isec
  Create and position EXGT z=-msecwd AlphaZ=d3
  Create and position EXSG AlphaZ=d3Ncopy=isec
  Create and position EXGT z=msecwd AlphaZ=d3
  Create and position EXSG AlphaZ=d3 ORT=X-Y-Z Ncopy=isec
  Create and position EXGT z=-msecwd AlphaZ=d3
Endblock

Block EXSG is the Shower maxGap for scintillator strips
  Create EHMS
endblock

Block EHMS is sHower Max Strip
Endblock

Block EXGT is the G10 layer in the Shower Max
EndBlock
Original (ecalgeo.g) file from CVS
Original (ecalgeo.g) file from CVS
****************************************************************************** Module ECALGEO is the EM EndCap Calorimeter GEOmetry Created 26 jan 1996 Author Rashid Mehdiyev * * Version 1.1, W.J. Llope * - changed sensitive medium names... * * Version 2.0, R.R. Mehdiyev 16.04.97 * - Support walls included * - intercell and intermodule gaps width updated * - G10 layers inserted * Version 2.1, R.R. Mehdiyev 23.04.97 * - Shower Max Detector geometry added * - Variable eta grid step size introduced * Version 2.2, R.R. Mehdiyev 03.12.97 * - Eta grid corrected * - Several changes in volume's dimensions * - Material changes in SMD * * Version 3.0, O. Rogachevsky 28.11.99 * - New proposal for calorimeter SN 0401 * * Version 4.1, O.Akio 3 Jan 01 * - Include forward pion detectors * Version 5.0, O. Rogachevsky 20.11.01 * - FPD is eliminated in this version * - More closed to proposal description * of calorimeter and SMD structure * ****************************************************************************** +CDE,AGECOM,GCONST,GCUNIT. * Content EAGA,EALP,ECAL,ECHC,ECVO,ECGH,EFLP,EHMS, ELED,EMGT,EMOD,EPER,EPSB,ERAD,ERCM,ERSM, ESHM,ESEC,ESCI,ESGH,ESPL,ESSP,EMSS, ETAR,EXGT,EXSG * Structure EMCG { Version, int Onoff, int fillMode} Structure EMCS { Type,ZOrig,ZEnd,EtaMin,EtaMax, PhiMin,PhiMax,Offset, Nsupsec,Nsector,Nsection,Nslices, Front,AlinCell,Frplast,Bkplast,PbPlate,LamPlate, BckPlate,Hub,Rmshift,SMShift,GapPlt,GapCel, GapSMD,SMDcentr,TieRod(2),Bckfrnt,GapHalf,Cover} * Structure EETR { Type,Etagr,Phigr,Neta,EtaBin(13)} * Structure ESEC { Isect, FPlmat, Cell, Scint, Nlayer } * Structure EMXG {Version,Sapex,Sbase,Rin,Rout,F4} * Structure EXSE {Jsect,Zshift,Sectype(6)} * Integer I_section,J_section,Ie,is,isec,i_str,Nstr,Type,ii,jj, cut,fsect,lsect,ihalf,filled * Real center,Plate,Cell,G10,diff,halfi, tan_low,tan_upp,Tanf,RBot,Rtop,Deta,etax,sq2,sq3, dup,dd,d2,d3,rshift,dphi,radiator,orgkeep,endkeep * Real maxcnt,msecwd,mxgten,curr,Secwid,Section, curcl,EtaTop,EtaBot,slcwid,zslice,Gap,mgt, xleft,xright,yleft,yright,current, rth,len,p,xc,yc,xx,yy,rbotrad, Rdel,dxy,ddn,ddup Integer N Parameter (N=12) * Tanf(etax) = tan(2*atan(exp(-etax))) * * ---------------------------------------------------------------------------- * * FillMode =1 only 2-5 sectors (in the first half) filled with scintillators * FillMode =2 all sectors filled (still only one half of one side) * FillMode =3 both halves (ie all 12 sectors are filled) Fill EMCG ! EM EndCAp Calorimeter basic data Version = 5.0 ! Geometry version OnOff = 3 ! Configurations 0-no, 1-west 2-east 3-both FillMode = 3 ! sectors fill mode Fill EMCS ! EM Endcap Calorimeter geometry Type = 1 ! =1 endcap, =2 fpd edcap prototype ZOrig = 268.763 ! calorimeter origin in z ZEnd = 310.007 ! Calorimeter end in z EtaMin = 1.086 ! upper feducial eta cut EtaMax = 2.0, ! lower feducial eta cut PhiMin = -90 ! Min phi PhiMax = 90 ! Max phi Offset = 0.0 ! offset in x Nsupsec = 6 ! Number of azimuthal supersectors Nsector = 30 ! Number of azimutal sectors (Phi granularity) Nslices = 5 ! number of phi slices in supersector Nsection = 4 ! Number of readout sections Front = 0.953 ! thickness of the front AL plates AlinCell = 0.02 ! Aluminim plate in cell Frplast = 0.015 ! Front plastic in megatile Bkplast = 0.155 ! Fiber routing guides and back plastic Pbplate = 0.457 ! Lead radiator thickness LamPlate = 0.05 ! Laminated SS plate thickness BckPlate = 3.175 ! Back SS plate thickness Hub = 3.81 ! thickness of EndCap hub Rmshift = 2.121 ! radial shift of module smshift = 0.12 ! radial shift of steel support walls GapPlt = 0.3/2 ! HALF of the inter-plate gap in phi GapCel = 0.03/2 ! HALF of the radial inter-cell gap GapSMD = 3.400 ! space for SMD detector SMDcentr = 279.542 ! SMD position TieRod = {160.,195} ! Radial position of tie rods Bckfrnt = 306.832 ! Backplate front Z GapHalf = 0.4 ! 1/2 Gap between halves of endcap wheel Cover = 0.075 ! Cover of wheel half * Rmshift = 2.121 ! radial shift of module * -------------------------------------------------------------------------- Fill EETR ! Eta and Phi grid values Type = 1 ! =1 endcap, =2 fpd EtaGr = 1.0536 ! eta_top/eta_bot tower granularity PhiGr = 0.0981747 ! Phi granularity (radians) NEta = 12 ! Eta granularity EtaBin = {2.0,1.9008,1.8065,1.7168,1.6317,1.5507,1.4738, 1.4007,1.3312,1.2651,1.2023,1.1427,1.086}! Eta rapidities *--------------------------------------------------------------------------- Fill ESEC ! First EM section ISect = 1 ! Section number Nlayer = 1 ! Number of Sci layers along z Cell = 1.505 ! Cell full width in z Scint = 0.5 ! Sci layer thickness * Fill ESEC ! First EM section ISect = 2 ! Section number Nlayer = 1 ! Number of Sci layers along z Cell = 1.505 ! Cell full width in z Scint = 0.5 ! Sci layer thickness * Fill ESEC ! Second EM section ISect = 3 ! Section number Nlayer = 4 ! Number of Sci layers along z Cell = 1.405 ! Cell full width in z Scint = 0.4 ! Sci layer thickness * Fill ESEC ! Third EM section ISect = 4 ! Section Nlayer = 18 ! Number of layers along z Cell = 1.405 ! Cell full width in z Scint = 0.4 ! Sci layer thickness * Fill ESEC ! 4th EM section ISect = 5 ! Section Nlayer = 1 ! Number of layers along z Cell = 1.505 ! Cell full width in z Scint = 0.5 ! Sci layer thickness *---------------------------------------------------------------------------- Fill EMXG ! EM Endcap SMD basic data Version = 1 ! Geometry version Sapex = 0.7 ! Scintillator strip apex Sbase = 1.0 ! Scintillator strip base Rin = 77.41 ! inner radius of SMD plane Rout = 213.922 ! outer radius of SMD plane F4 = .15 ! F4 thickness *---------------------------------------------------------------------------- Fill EXSE ! First SMD section JSect = 1 ! Section number Zshift = -1.215 ! Section width sectype = {4,1,0,2,1,0} ! 1-V,2-U,3-cutV,4-cutU * Fill EXSE ! Second SMD section JSect = 2 ! Section number Zshift = 0. ! Section width sectype = {0,2,1,0,2,3} ! 1-V,2-U,3-cutV,4-cutU * Fill EXSE ! Third SMD section JSect = 3 ! Section number Zshift = 1.215 ! Section width sectype = {1,0,2,1,0,2} ! 1-V,2-U,3-cutV,4-cutU *---------------------------------------------------------------------------- * Use EMCG * sq3 = sqrt(3.) sq2 = sqrt(2.) prin1 emcg_version ('ECALGEO version ', F4.2) * Endcap USE EMCS type=1 USE EETR type=1 orgkeep = emcs_ZOrig endkeep = emcs_ZEnd if(emcg_OnOff>0) then diff = 0.0 center = (emcs_ZOrig+emcs_ZEnd)/2 Tan_Upp = tanf(emcs_EtaMin) Tan_Low = tanf(emcs_EtaMax) rth = sqrt(1. + Tan_Low*Tan_Low) rshift = emcs_Hub * rth dup=emcs_Rmshift*Tan_Upp dd=emcs_Rmshift*rth d2=rshift + dd radiator = emcs_Pbplate + 2*emcs_LamPlate * d3=emcs_Rmshift-2*emcs_smshift dphi = (emcs_PhiMax-emcs_PhiMin)/emcs_Nsector Create ECAL if (emcg_OnOff==1 | emcg_OnOff==3) then Position ECAL in CAVE z=+center endif if (emcg_OnOff==2 | emcg_OnOff==3) then Position ECAL in CAVE z=-center ThetaZ=180 endif if(section > emcs_Zend) then prin0 section,emcs_Zend (' ECALGEO error: sum of sections exceeds maximum ',2F12.4) endif prin1 section (' EndCap calorimeter total depth ',F12.4) endif prin1 ('ECALGEO finished') * * ---------------------------------------------------------------------------- Block ECAL is one EMC EndCap wheel Material Air Medium standard Attribute ECAL seen=1 colo=7 ! lightblue shape CONE dz=(emcs_Zend-emcs_ZOrig)/2, Rmn1=orgkeep*Tan_Low-d2 Rmn2=endkeep*Tan_Low-d2, Rmx1=orgkeep*Tan_Upp+dup Rmx2=endkeep*Tan_Upp+dup do ihalf=1,2 filled=1 halfi = -105 + (ihalf-1)*180 if (ihalf=2 & emcg_FillMode<3) filled = 0 Create and Position EAGA AlphaZ=halfi enddo * EndBlock * ---------------------------------------------------------------------------- Block EAGA is half of wheel air volume for the EndCap module Attribute EAGA seen=1 colo=1 serial=filled ! black Material Air shape CONS dz=(emcs_Zend-emcs_ZOrig)/2, Rmn1=orgkeep*Tan_Low-d2 Rmn2=endkeep*Tan_Low-d2, Rmx1=orgkeep*Tan_Upp+dup Rmx2=endkeep*Tan_Upp+dup, phi1=emcs_PhiMin phi2=emcs_PhiMax if (filled=1) then Create and Position EMSS konly='MANY' curr = orgkeep ; curcl = endkeep Create and position ECGH AlphaZ=90 konly='ONLY' endif EndBlock * ---------------------------------------------------------------------------- Block EMSS is steel support of the EndCap module Attribute EMSS seen=1 colo=1 ! black Material Iron shape CONS dz=(emcs_Zend-emcs_ZOrig)/2, Rmn1=orgkeep*Tan_Low-d2 Rmn2=endkeep*Tan_Low-d2, Rmx1=orgkeep*Tan_Upp+dup Rmx2=endkeep*Tan_Upp+dup, phi1=emcs_PhiMin phi2=emcs_PhiMax zslice = emcs_ZOrig prin1 zslice (' Front Al plane starts at: ',F12.4) slcwid = emcs_Front Create and Position EFLP z=zslice-center+slcwid/2 zslice = zslice + slcwid prin1 zslice (' First calorimeter starts at: ',F12.4) fsect = 1; lsect = 3 slcwid = emcs_SMDcentr - emcs_GapSMD/2 - zslice * Create and Position ECVO z=zslice-center+slcwid/2 slcwid = emcs_GapSMD zslice = emcs_SMDcentr - emcs_GapSMD/2 prin1 section,zslice (' 1st calorimeter ends, SMD starts at: ',2F10.5) Create and Position ESHM z=zslice-center+slcwid/2 zslice = zslice + slcwid prin1 zslice (' SMD ends at: ',F10.5) * slcwid = 0 fsect = 4; lsect = 5 do I_section =fsect,lsect USE ESEC Isect=I_section Slcwid = slcwid + esec_cell*esec_Nlayer enddo slcwid = emcs_bckfrnt - zslice * Create and Position ECVO z = zslice-center+slcwid/2 zslice = emcs_bckfrnt prin1 section,zslice (' 2nd calorimeter ends, Back plate starts at: ',2F10.5) slcwid = emcs_BckPlate * Create and Position ESSP z=zslice-center+slcwid/2 zslice = zslice + slcwid prin1 zslice (' BackPlate ends at: ',F10.5) slcwid = emcs_Zend-emcs_ZOrig Create ERCM do i_str = 1,2 do is = 1,5 xx = emcs_phimin + is*30 yy = xx*degrad xc = cos(yy)*emcs_TieRod(i_str) yc = sin(yy)*emcs_TieRod(i_str) Position ERCM z=0 x=xc y=yc enddo enddo rth = orgkeep*Tan_Upp+dup + 2.5/2 xc = (endkeep - orgkeep)*Tan_Upp len = .5*(endkeep + orgkeep)*Tan_Upp + dup + 2.5/2 yc = emcs_Zend-emcs_ZOrig p = atan(xc/yc)/degrad Create EPSB do is = 1,6 xx = -75 + (is-1)*30 yy = xx*degrad xc = cos(yy)*len yc = sin(yy)*len Position EPSB x=xc y=yc AlphaZ=xx enddo EndBlock * ---------------------------------------------------------------------------- Block ECVO is one of EndCap Volume with megatiles and radiators Material Air Attribute ECVO seen=1 colo=3 ! green shape CONS dz=slcwid/2, Rmn1=zslice*Tan_Low-dd Rmn2=(zslice+slcwid)*Tan_Low-dd, Rmx1=zslice*Tan_Upp+dup Rmx2=(zslice+slcwid)*Tan_Upp+dup do J_section = 1,6 if (1 < J_section < 6 | emcg_FillMode > 1)then filled = 1 else filled = 0 endif d3 = 75 - (J_section-1)*30 Create and Position EMOD AlphaZ=d3 Ncopy=J_section enddo * EndBlock * ---------------------------------------------------------------------------- Block ESHM is the SHower Max section * Material Air Attribute ESHM seen=1 colo=4 ! blue Shape CONS dz=SlcWid/2, rmn1=zslice*Tan_Low-dd, rmn2=(zslice+slcwid)*Tan_Low-dd, rmx1=(zslice)*Tan_Upp+dup, rmx2=(zslice+slcwid)*Tan_Upp+dup, phi1=emcs_PhiMin phi2=emcs_PhiMax USE EMXG Version=1 maxcnt = emcs_SMDcentr prin1 zslice,section,center (' Z start for SMD,section: ',3F12.4) * do J_section = 1,3 USE EXSE Jsect=J_section * current = exse_Zshift secwid = emxg_Sapex + 2.*emxg_F4 section = maxcnt + exse_zshift prin1 j_section,current,section,secwid (' layer, Z, width : ',i3,3F12.4) rbot=section*Tan_Low rtop=section*Tan_Upp prin1 j_section,rbot,rtop (' layer, rbot,rtop : ',i3,2F12.4) Create and position ESPL z=current * end do Create ERSM do i_str = 1,2 do is = 1,5 xx = emcs_phimin + (is)*30 yy = xx*degrad xc = cos(yy)*emcs_TieRod(i_str) yc = sin(yy)*emcs_TieRod(i_str) Position ERSM z=0 x=xc y=yc enddo enddo Endblock * ---------------------------------------------------------------------------- Block ECGH is air Gap between endcap Half wheels Material Air Medium standard Attribute ECGH seen=0 colo=7 ! lightblue shape TRD1 dz=(emcs_Zend-emcs_ZOrig)/2, dy =(emcs_gaphalf+emcs_cover)/2, dx1=orgkeep*Tan_Upp+dup, dx2=endkeep*Tan_Upp+dup rth = emcs_GapHalf + emcs_cover xx=curr*Tan_Low-d2 xleft = sqrt(xx*xx - rth*rth) yy=curr*Tan_Upp+dup xright = sqrt(yy*yy - rth*rth) secwid = yy - xx xx=curcl*Tan_Low-d2 yleft = sqrt(xx*xx - rth*rth) yy=curcl*Tan_Upp+dup yright = sqrt(yy*yy - rth*rth) slcwid = yy - xx xx=(xleft+xright)/2 yy=(yleft + yright)/2 xc = yy - xx len = (xx+yy)/2 yc = curcl - curr p = atan(xc/yc)/degrad rth = -(emcs_GapHalf + emcs_cover)/2 Create ECHC Position ECHC x=len y=rth Position ECHC x=-len y=rth AlphaZ=180 EndBlock * ---------------------------------------------------------------------------- Block ECHC is steel EndCap Half Cover Attribute ECHC seen=1 colo=1 ! black Material Iron shape TRAP dz=(curcl-curr)/2, thet=p, bl1=secwid/2, tl1=secwid/2, bl2=slcwid/2, tl2=slcwid/2, h1=emcs_cover/2 h2=emcs_cover/2, phi=0 alp1=0 alp2=0 EndBlock * ---------------------------------------------------------------------------- Block ESSP is Stainless Steel back Plate * Material Iron Attribute ESSP seen=1 colo=6 fill=1 shape CONS dz=emcs_BckPlate/2, Rmn1=zslice*Tan_Low-dd Rmn2=(zslice+slcwid)*Tan_Low-dd, Rmx1=zslice*Tan_Upp+dup Rmx2=(zslice+slcwid)*Tan_Upp+dup, phi1=emcs_PhiMin phi2=emcs_PhiMax endblock * ---------------------------------------------------------------------------- Block EPSB is Projectile Stainless steel Bar * Material Iron Attribute EPSB seen=1 colo=6 fill=1 shape TRAP dz=(emcs_Zend-emcs_ZOrig)/2, thet=p, bl1=2.5/2, tl1=2.5/2, bl2=2.5/2, tl2=2.5/2, h1=2.0/2 h2=2.0/2, phi=0 alp1=0 alp2=0 endblock * ---------------------------------------------------------------------------- Block ERCM is stainless steel tie Rod in CaloriMeter sections * Material Iron Attribute ERSM seen=1 colo=6 fill=1 shape TUBE dz=slcwid/2, rmin=0, rmax=1.0425 ! nobody knows exactly endblock * ---------------------------------------------------------------------------- Block ERSM is stainless steel tie Rod in Shower Max * Material Iron Attribute ERSM seen=1 colo=6 fill=1 shape TUBE dz=slcwid/2, rmin=0, rmax=1.0425 endblock * ---------------------------------------------------------------------------- Block EMOD is one module of the EM EndCap Attribute EMOD seen=1 colo=3 serial=filled ! green Material Air Shape CONS dz=slcwid/2, phi1=emcs_PhiMin/emcs_Nsupsec, phi2=emcs_PhiMax/emcs_Nsupsec, Rmn1=zslice*Tan_Low-dd Rmn2=(zslice+slcwid)*Tan_Low-dd, Rmx1=zslice*Tan_Upp+dup Rmx2=(zslice+slcwid)*Tan_Upp+dup * * Running parameter 'section' contains the position of the current section * It should not be modified in daughters, use 'current' variable instead. * SecWid is used in all 'CONS' daughters to define dimensions. * * section = zslice curr = zslice + slcwid/2 Do I_section =fsect,lsect USE ESEC Isect=I_section * Secwid = esec_cell*esec_Nlayer if (I_section = 3 | I_section = 5) then ! no last radiator Secwid = Secwid - radiator else if (I_section = 4) then ! add one more radiator Secwid = Secwid - esec_cell + radiator endif Create and position ESEC z=section-curr+secwid/2 section = section + secwid * enddo endblock * ---------------------------------------------------------------------------- Block ESEC is a single EM section Attribute ESEC seen=1 colo=1 serial=filled Material Air Medium standard * Shape CONS dz=secwid/2, rmn1=(section-diff)*Tan_Low-dd, rmn2=(section+secwid-diff)*Tan_Low-dd, rmx1=(section-diff)*Tan_Upp+dup, rmx2=(section+secwid-diff)*Tan_Upp+dup * len = -secwid/2 current = section mgt = esec_scint + emcs_AlinCell _ + emcs_FrPlast + emcs_BkPlast gap = esec_cell - radiator - mgt prin2 I_section,section (' ESEC:I_section,section',i3,F12.4) Do is = 1,esec_Nlayer * define actual cell thickness: Cell = esec_cell plate = radiator * if (is=nint(esec_Nlayer) & (I_section = 3 | I_section = 5)) then Cell = mgt + gap Plate=0 else if (I_section = 4 & is = 1) then ! radiator only Cell = radiator endif * prin2 I_section,is,len,cell,current (' ESEC:I_section,is,len,cell,current ',2i3,3F12.4) if (I_section = 4 & is = 1) then ! radiator only cell = radiator + .14 Create and Position ERAD z=len + (cell)/2 len = len + cell current = current + cell else cell = mgt if(filled = 1) then Create and Position EMGT z=len +(gap+cell)/2 xx = current + (gap+cell)/2 prin2 I_section,is,xx (' MEGA I_section,is ',2i3,F10.4) endif len = len + cell + gap current = current + cell + gap if (Plate>0) then cell = radiator Create and Position ERAD z=len + cell/2 len = len + cell current = current + cell end if end if end do Endblock * ---------------------------------------------------------------------------- Block EMGT is a megatile EM section Attribute EMGT seen=1 colo=1 Material Air Medium standard * Shape CONS dz=mgt/2, rmn1=(current-diff)*Tan_Low-dd, rmn2=(current+mgt-diff)*Tan_Low-dd, rmx1=(current-diff)*Tan_Upp+dup, rmx2=(current+mgt-diff)*Tan_Upp+dup if (I_section=1 | I_section=2 | I_section=5) then Call GSTPAR (ag_imed,'CUTGAM',0.00001) Call GSTPAR (ag_imed,'CUTELE',0.00001) else Call GSTPAR (ag_imed,'CUTGAM',0.00008) Call GSTPAR (ag_imed,'CUTELE',0.001) Call GSTPAR (ag_imed,'BCUTE',0.0001) end if * Do isec=1,nint(emcs_Nslices) Create and Position EPER AlphaZ=(emcs_Nslices/2-isec+0.5)*dphi End Do Endblock *--------------------------------------------------------------------------- Block EPER is a EM subsection period (super layer) * Material POLYSTYREN Attribute EPER seen=1 colo=1 Shape CONS dz=mgt/2, phi1=emcs_PhiMin/emcs_Nsector, phi2=+emcs_PhiMax/emcs_Nsector, rmn1=(current-diff)*Tan_Low-dd, rmn2=(current+mgt-diff)*Tan_Low-dd, rmx1=(current-diff)*Tan_Upp+dup, rmx2=(current+mgt-diff)*Tan_Upp+dup * curcl = current+mgt/2 Do ie = 1,nint(eetr_NEta) EtaBot = eetr_EtaBin(ie) EtaTop = eetr_EtaBin(ie+1) RBot=(curcl-diff)*Tanf(EtaBot) * if(Plate > 0) then ! Ordinary Sci layer RTop=min((curcl-diff)*Tanf(EtaTop), _ ((current-diff)*Tan_Upp+dup)) else ! last Sci layer in section RTop=min((curcl-diff)*Tanf(EtaTop), _ ((current-diff)*Tan_Upp+dup)) endif check RBot<RTop * xx=tan(pi*emcs_PhiMax/180.0/emcs_Nsector) yy=cos(pi*emcs_PhiMax/180.0/emcs_Nsector) Create and Position ETAR x=(RBot+RTop)/2 ORT=YZX prin2 ie,EtaTop,EtaBot,rbot,rtop (' EPER : ie,EtaTop,EtaBot,rbot,rtop ',i3,4F12.4) enddo * EndBlock * - - - - - - - - - - - - - - - - - - - - - - - - - - - - - - - - - - - - - - Block ETAR is one CELL of scintillator, fiber and plastic * Attribute ETAR seen=1 colo=4 ! blue * local z goes along the radius, y is the thickness Shape TRD1 dy=mgt/2 dz=(RTop-RBot)/2, dx1=RBot*xx-emcs_GapCel/yy, dx2=RTop*xx-emcs_GapCel/yy * Create and Position EALP y=(-mgt+emcs_AlinCell)/2 G10 = esec_scint Create and Position ESCI y=(-mgt+G10)/2+emcs_AlinCell _ +emcs_FrPlast EndBlock * - - - - - - - - - - - - - - - - - - - - - - - - - - - - - - - - - - - - - - Block ESCI is the active scintillator (polystyren) layer * Material POLYSTYREN Material Cpolystyren Isvol=1 Attribute ESCI seen=1 colo=7 fill=0 ! lightblue * local z goes along the radius, y is the thickness Shape TRD1 dy=esec_scint/2, dz=(RTop-RBot)/2-emcs_GapCel Call GSTPAR (ag_imed,'CUTGAM',0.00008) Call GSTPAR (ag_imed,'CUTELE',0.001) Call GSTPAR (ag_imed,'BCUTE',0.0001) Call GSTPAR (ag_imed,'CUTNEU',0.001) Call GSTPAR (ag_imed,'CUTHAD',0.001) Call GSTPAR (ag_imed,'CUTMUO',0.001) * define Birks law parameters Call GSTPAR (ag_imed,'BIRK1',1.) Call GSTPAR (ag_imed,'BIRK2',0.013) Call GSTPAR (ag_imed,'BIRK3',9.6E-6) * HITS ESCI Birk:0:(0,10) * xx:16:H(-250,250) yy:16:(-250,250) zz:16:(-350,350), * px:16:(-100,100) py:16:(-100,100) pz:16:(-100,100), * Slen:16:(0,1.e4) Tof:16:(0,1.e-6) Step:16:(0,100), * none:16: endblock * ---------------------------------------------------------------------------- Block ERAD is radiator * Material Iron Attribute ERAD seen=1 colo=6 fill=1 ! violet Shape CONS dz=radiator/2, rmn1=(current)*Tan_Low-dd, rmn2=(current+cell)*Tan_Low-dd, rmx1=(current)*Tan_Upp+dup, rmx2=(current+radiator)*Tan_Upp+dup Create and Position ELED endblock * - - - - - - - - - - - - - - - - - - - - - - - - - - - - - - - - - - - - - Block ELED is lead absorber Plate * Material Lead Attribute ELED seen=1 colo=4 fill=1 Shape TUBS dz=emcs_Pbplate/2, rmin=(current)*Tan_Low, rmax=(current+emcs_Pbplate)*Tan_Upp, Call GSTPAR (ag_imed,'CUTGAM',0.00008) Call GSTPAR (ag_imed,'CUTELE',0.001) Call GSTPAR (ag_imed,'BCUTE',0.0001) Call GSTPAR (ag_imed,'CUTNEU',0.001) Call GSTPAR (ag_imed,'CUTHAD',0.001) Call GSTPAR (ag_imed,'CUTMUO',0.001) endblock * ---------------------------------------------------------------------------- Block EFLP is First Aluminium plate * Material Aluminium Attribute EFLP seen=1 colo=3 fill=1 ! green shape CONS dz=emcs_Front/2, Rmn1=68.813 Rmn2=68.813, Rmx1=(zslice-diff)*Tan_Upp+dup, Rmx2=(zslice + slcwid-diff)*Tan_Upp+dup, phi1=emcs_PhiMin phi2=emcs_PhiMax endblock * ---------------------------------------------------------------------------- Block EALP is ALuminium Plate in calorimeter cell * Material Aluminium Material StrAluminium isvol=0 Attribute EALP seen=1 colo=1 Shape TRD1 dy=emcs_AlinCell/2 dz=(RTop-RBot)/2 Call GSTPAR (ag_imed,'CUTGAM',0.00001) Call GSTPAR (ag_imed,'CUTELE',0.00001) Call GSTPAR (ag_imed,'LOSS',1.) Call GSTPAR (ag_imed,'STRA',1.) endblock * ---------------------------------------------------------------------------- Block ESPL is one of the Shower max PLanes * Material Air Attribute ESPL seen=1 colo=3 ! blue Shape TUBS dz=SecWid/2, rmin=section*Tan_Low-1.526, rmax=(section-secwid/2)*Tan_Upp+dup, phi1=emcs_PhiMin phi2=emcs_PhiMax USE EMXG Version=1 msecwd = (emxg_Sapex+emxg_F4)/2 do isec=1,6 cut=1 d3 = 75 - (isec-1)*30 if (exse_sectype(isec) = 0 | (emcg_FillMode=1 & (isec=6 | isec=1))) then cut = 0 Create and position EXSG AlphaZ=d3 Ncopy=isec else if(exse_sectype(isec) = 1) then ! V Create and position EXSG AlphaZ=d3 Ncopy=isec Create and position EXGT z=msecwd AlphaZ=d3 else if(exse_sectype(isec) = 2) then ! U Create and position EXSG AlphaZ=d3 ORT=X-Y-Z Ncopy=isec Create and position EXGT z=-msecwd AlphaZ=d3 else if(exse_sectype(isec) = 3) then ! cut V cut=2 Create and position EXSG AlphaZ=d3 Ncopy=isec Create and position EXGT z=msecwd AlphaZ=d3 else if(exse_sectype(isec) = 4) then ! cut U cut=2 Create and position EXSG AlphaZ=d3 ORT=X-Y-Z Ncopy=isec Create and position EXGT z=-msecwd AlphaZ=d3 endif enddo Endblock * ---------------------------------------------------------------------------- Block EXSG is the Shower max Gap for scintillator strips * Attribute EXSG seen=1 colo=7 serial=cut ! black Material Air Shape TUBS dz=SecWid/2, rmin=section*Tan_Low-1.526, rmax=(section-secwid/2)*Tan_Upp+dup, phi1=emcs_PhiMin/emcs_Nsupsec, phi2=emcs_PhiMax/emcs_Nsupsec * Rbot = emxg_Rin Rtop = emxg_Rout if(cut > 0) then if(cut = 1) then Rdel = 3.938 Nstr = 288 else Rdel = -.475 Nstr = 285 endif rth = .53*rdel ! .53 --- tentatavily ddn = sq3*1.713 + Rdel ddup = .5*1.846 + 1.713 prin2 Rbot,Rtop,Nstr (' EXSG: Rbot,Rtop,Nstr',2F12.4,I5) mgt = emxg_Sbase + .01 do i_str = 1,nstr p = .5*(i_str-1)*mgt + 41.3655 * if (p <= (.5*rbot*sq3 + rth)) then dxy = 1.9375*sq2 xleft = .5*sq2*p*(sq3 + 1.) - dxy yleft = .5*sq2*p*(sq3 - 1.) - dxy yright = .5*sq2*(sqrt( rbot*rbot - p*p) - p) xright = sq2*p + yright else if ((.5*rbot*sq3 + rth) < p <= (.5*Rtop + 1.5)) then prin2 i_str,p (' EXSG: 2 - -i_str,p:',i3,F12.4) dxy = 1.9375*sq2 xleft = .5*sq2*p*(sq3 + 1.) - dxy yleft = .5*sq2*p*(sq3 - 1.) - dxy dxy = rdel*sq2/sq3 yright = .5*sq2*p*(1.- 1./sq3) xright = sq2*p - yright - dxy yright = -yright - dxy else if (p > (.5*rtop +1.5)) then prin2 i_str,p (' EXSG: 3 - - i_str,p:',i3,F12.4) yleft = (sqrt(rtop*rtop - p*p) - p)/sq2 xleft = sq2*p + yleft dxy = rdel*sq2/sq3 yright = .5*sq2*p*(1.- 1./sq3) xright = sq2*p - yright - dxy yright = -yright - dxy dxy = 0. if ((.5*sq3*160.- ddn) < p <= (.5*sq3*160.+ ddup) ) then prin2 i_str,p (' EXSG: 4 - - i_str,p:',i3,F12.4) xc = .5*(sq3*160.+1.846) yc = xc - .5*sq3*1.713 if (p > yc) then dxy = .5*sq2*(2/sq3*rdel + .5*sq3*1.846 +_ sqrt(1.713*1.713 - (p-xc)*(p-xc))) else dxy = sq2/sq3*(p - .5*sq3* 160. + ddn) endif else if ((.5*sq3*195.- ddn) < p <= (.5*sq3*195. + ddup) ) then prin2 i_str,p (' EXSG: 5 - - i_str,p:',i3,F12.4) xc = .5*(sq3*195.+1.846) yc = xc - .5*sq3*1.713 if (p > yc) then dxy = .5*sq2*(2/sq3*rdel + .5*sq3*1.846 +_ sqrt(1.713*1.713 - (p-xc)*(p-xc))) else dxy = sq2/sq3*(p - .5*sq3*195. + ddn) endif endif xright = xright + dxy yright = yright + dxy endif dxy = section*Tan_Upp - Rtop xc = .5*(xright+xleft) + dxy yc = .5*(yright+yleft) xx = .5*sq2*(xleft+yleft) yy = .5*sq2*(xright+yright) len = xx-yy prin2 i_str,p,yy,xx,len,xc,yc (' EXSG: i_str,x,y1,y2,len,xc,yc:',i3,6F12.4) * Create EHMS if (mod(i_str,2) != 0 ) then Position EHMS x=xc y=yc AlphaZ=-45 else Position EHMS x=xc y=yc AlphaZ=-45 ORT=X-Y-Z endif end do endif * dcut exsg z 0 0 10 0.1 0.1 * dcut exsg y 0 10 -50 0.7 0.7 endblock * ---------------------------------------------------------------------------- Block EHMS is sHower Max Strip * Material POLYSTYREN Material Cpolystyren Isvol=1 Attribute EHMS seen=1 colo=2 serial=cut ! red Shape TRD1 dx1=0 dx2=emxg_Sbase/2 dy=len/2 dz=emxg_Sapex/2 Call GSTPAR (ag_imed,'CUTGAM',0.00008) Call GSTPAR (ag_imed,'CUTELE',0.001) Call GSTPAR (ag_imed,'BCUTE',0.0001) * define Birks law parameters Call GSTPAR (ag_imed,'BIRK1',1.) Call GSTPAR (ag_imed,'BIRK2',0.0130) Call GSTPAR (ag_imed,'BIRK3',9.6E-6) * HITS EHMS Birk:0:(0,10) * xx:16:SH(-250,250) yy:16:(-250,250) zz:16:(-350,350), * px:16:(-100,100) py:16:(-100,100) pz:16:(-100,100), * Slen:16:(0,1.e4) Tof:16:(0,1.e-6) Step:16:(0,100), * none:16: Eloss:0:(0,10) * Endblock * ---------------------------------------------------------------------------- Block EXGT is the G10 layer in the Shower Max * * G10 is about 60% SiO2 and 40% epoxy Component Si A=28.08 Z=14 W=0.6*1*28./60. Component O A=16 Z=8 W=0.6*2*16./60. Component C A=12 Z=6 W=0.4*8*12./174. Component H A=1 Z=1 W=0.4*14*1./174. Component O A=16 Z=8 W=0.4*4*16./174. Mixture g10 Dens=1.7 Attribute EXGT seen=1 colo=7 Shape TUBS dz=emxg_F4/2, rmin=(section-diff)*Tan_Low-1.526, rmax=(section+msecwd-diff)*Tan_Upp, phi1=emcs_PhiMin/emcs_Nsupsec, phi2=emcs_PhiMax/emcs_Nsupsec Call GSTPAR (ag_imed,'CUTGAM',0.00001) Call GSTPAR (ag_imed,'CUTELE',0.00001) EndBlock * ---------------------------------------------------------------------------- * ECAL nice views: dcut ecvo x 1 10 -5 .5 .1 * draw emdi 105 0 160 2 13 .2 .1 * draw emdi 120 180 150 1 14 .12 .12 * --------------------------------------------------------------------------- end
ecalgeo.g geometry file (Jason edits, g23)
ecalgeo.g geometry file (Jason Webb edits, g23)
c***************************************************************************** Module ECALGEO is the EM EndCap Calorimeter GEOmetry c-- Created 26 jan 1996 Author Rashid Mehdiyev c-- c Version 1.1, W.J. Llope c - changed sensitive medium names... c c Version 2.0, R.R. Mehdiyev 16.04.97 c - Support walls included c - intercell and intermodule gaps width updated c - G10 layers inserted c Version 2.1, R.R. Mehdiyev 23.04.97 c - Shower Max Detector geometry added c - Variable eta grid step size introduced c Version 2.2, R.R. Mehdiyev 03.12.97 c - Eta grid corrected c - Several changes in volumes dimensions c - Material changes in SMD c c Version 3.0, O. Rogachevsky 28.11.99 c - New proposal for calorimeter SN 0401 c c Version 4.1, O.Akio 3 Jan 01 c - Include forward pion detectors c c Version 5.0, O. Rogachevsky 20.11.01 c - FPD is eliminated in this version c - More closed to proposal description c of calorimeter and SMD structure c c***************************************************************************** +CDE,AGECOM,GCONST,GCUNIT. * Content EAGA,EALP,ECAL,ECHC,ECVO,ECGH,EFLP,EHMS, ELED,EMGT,EMOD,EPER,EPSB,ERAD,ERCM,ERSM, ESHM,ESEC,ESCI,ESGH,ESPL,ESSP,EMSS,ETAR, EXGT,EXSG,EXPS,EFLS,EBLS Structure EMCG { Version, int Onoff, int fillMode} Structure EMCS { Version,Type,zorg,zend,EtaMin,EtaMax, PhiMin,PhiMax,Offset, Nsupsec,Nsector,Nsection,Nslices, Front,AlinCell,Frplast,Bkplast,PbPlate,LamPlate, BckPlate,Hub,Rmshift,SMShift,GapPlt,GapCel, GapSMD,SMDcentr,TieRod(2),Bckfrnt,GapHalf,Cover, Rtie,slop} Structure EETR { Type,Etagr,Phigr,Neta,EtaBin(13)} Structure ESEC { Isect, FPlmat, Cell, Scint, Nlayer, deltaz, Jiggle(18) } Structure EMXG {Version,Sapex,Sbase,Rin,Rout,F4} Structure EXSE {Jsect,Zshift,Sectype(6)} Structure ESMD {Version, front_layer, back_layer, spacer_layer, base, apex } Integer I_section,J_section,Ie,is,isec,istrip,Nstr,Type,ii,jj, cut,fsect,lsect,ihalf,filled,i,j,k,i_sector Real center,Plate,Cell,G10,halfi, tan_low,tan_upp,Tanf,RBot,Rtop,Deta,etax,sq2,sq3, dup,dd,d2,d3,rshift,dphi,radiator Real maxcnt,msecwd,mxgten,curr,Secwid,Section, curcl,EtaTop,EtaBot,zwidth,zslice,Gap,megatile, xleft,xright,yleft,yright,current, rth,length,p,xc,yc,xx,yy,rdel,dxy,ddn,ddup Real myPhi Integer N Parameter (N=12) Tanf(etax) = tan(2*atan(exp(-etax))) c-------------------------------------------------------------------------------- c Data c c FillMode =1 only 2-5 sectors (in the first half) filled with scintillators c FillMode =2 all sectors filled (still only one half of one side) c FillMode =3 both halves (ie all 12 sectors are filled) c c OnOff =0 Do not build geometry c OnOff =1 Build West Endcap c OnOff =2 Build East Endcap (disabled) c OnOff =3 Build Both Endcaps (east disabled) c c Note: Fill EMCG ! EM EndCAp Calorimeter basic data Version = 5.0 ! Geometry version OnOff = 3 ! Configurations 0-no, 1-west 2-east 3-both FillMode = 3 ! sectors fill mode c-- Fill EMCS ! EM Endcap Calorimeter geometry Version = 1 ! Versioning Type = 1 ! =1 endcap, =2 fpd edcap prototype ZOrg = 268.763 ! calorimeter origin in z ZEnd = 310.007 ! Calorimeter end in z EtaMin = 1.086 ! upper feducial eta cut EtaMax = 2.0, ! lower feducial eta cut PhiMin = -90 ! Min phi PhiMax = 90 ! Max phi Offset = 0.0 ! offset in x Nsupsec = 6 ! Number of azimuthal supersectors Nsector = 30 ! Number of azimutal sectors (Phi granularity) Nslices = 5 ! number of phi slices in supersector Nsection = 4 ! Number of readout sections Front = 0.953 ! thickness of the front AL plates AlinCell = 0.02 ! Aluminim plate in cell Frplast = 0.015 ! Front plastic in megatile Bkplast = 0.155 ! Fiber routing guides and back plastic Pbplate = 0.457 ! Lead radiator thickness LamPlate = 0.05 ! Laminated SS plate thickness BckPlate = 3.175 ! Back SS plate thickness Hub = 3.81 ! thickness of EndCap hub Rmshift = 2.121 ! radial shift of module smshift = 0.12 ! radial shift of steel support walls GapPlt = 0.3/2 ! HALF of the inter-plate gap in phi GapCel = 0.03/2 ! HALF of the radial inter-cell gap GapSMD = 3.400 ! space for SMD detector << version 2 -- 3.600 >> SMDcentr = 279.542 ! SMD position TieRod = {160.,195} ! Radial position of tie rods Bckfrnt = 306.832 ! Backplate front Z GapHalf = 0.4 ! 1/2 Gap between halves of endcap wheel Cover = 0.075 ! Cover of wheel half Rtie = 1.0425 ! Radius of tie rod Slop = 0.1400 ! Added to cell containing radiator 6 (formerly hardcoded in geom) c-- Fill EMCS ! EM Endcap Calorimeter geometry Version = 2 ! Versioning Type = 1 ! =1 endcap, =2 fpd edcap prototype ZOrg = 268.763 ! calorimeter origin in z ZEnd = 310.007 ! Calorimeter end in z EtaMin = 1.086 ! upper feducial eta cut EtaMax = 2.0, ! lower feducial eta cut PhiMin = -90 ! Min phi PhiMax = 90 ! Max phi Offset = 0.0 ! offset in x Nsupsec = 6 ! Number of azimuthal supersectors Nsector = 30 ! Number of azimutal sectors (Phi granularity) Nslices = 5 ! number of phi slices in supersector Nsection = 4 ! Number of readout sections Front = 0.953 ! thickness of the front AL plates AlinCell = 0.02 ! Aluminim plate in cell Frplast = 0.015 ! Front plastic in megatile Bkplast = 0.155 ! Fiber routing guides and back plastic Pbplate = 0.457 ! Lead radiator thickness LamPlate = 0.05 ! Laminated SS plate thickness BckPlate = 3.175 ! Back SS plate thickness Hub = 3.81 ! thickness of EndCap hub Rmshift = 2.121 ! radial shift of module smshift = 0.12 ! radial shift of steel support walls GapPlt = 0.3/2 ! HALF of the inter-plate gap in phi GapCel = 0.03/2 ! HALF of the radial inter-cell gap GapSMD = 3.600 ! space for SMD detector (* from master_geom_bmp.xls *) SMDcentr = 279.542 ! SMD position TieRod = {160.,195} ! Radial position of tie rods Bckfrnt = 306.832 ! Backplate front Z GapHalf = 0.4 ! 1/2 Gap between halves of endcap wheel Cover = 0.075 ! Cover of wheel half Rtie = 0.75 ! Radius of tie rod Slop = 0.0000 ! Added to cell containing radiator 6 (formerly hardcoded in geom) c-- c--------------------------------------------------------------------------- c-- c-- Supporting documentation: c-- http://drupal.star.bnl.gov/STAR/system/files/SMD_module_stack.pdf c-- Fill ESMD ! shower maximum detector information Version = 1 ! versioning information front_layer = 0.161 ! thickness of front layer back_layer = 0.210 ! thickness of back layer base = 1.0 ! base of the SMD strip apex = 0.7 ! apex of the SMD strip spacer_layer = 1.2 ! spacer layer c-- Fill EETR ! Eta and Phi grid values Type = 1 ! =1 endcap, =2 fpd EtaGr = 1.0536 ! eta_top/eta_bot tower granularity PhiGr = 0.0981747 ! Phi granularity (radians) NEta = 12 ! Eta granularity EtaBin = {2.0,1.9008,1.8065,1.7168,1.6317,1.5507,1.4738, 1.4007,1.3312,1.2651,1.2023,1.1427,1.086}! Eta rapidities c-- c--------------------------------------------------------------------------- c-- Fill ESEC ! Preshower 1 / Radiator 1 ISect = 1 ! Section number Nlayer = 1 ! Number of Sci layers along z Cell = 1.505 ! Cell full width in z Scint = 0.475 ! Sci layer thickness (4.75mm Bicron) deltaz = -0.014 ! Amount to shift section in z to align with as-built numbers Jiggle = {0,0,0,0,0,0,0,0,0,0,0,0,0,0,0,0,0,0} ! Degrees to shift EPER in each layer c-- c-- Note: Jiggle allows one to shift each megatile by Jiggle(i) degrees, where c-- i indicates the layer within the section of the calorimeter. This feature c-- has only been crudely tested... i.e. it compiles and creates a reasonable c-- set of pictures, but I have not verified that every scintillator shows up... c-- There could be volume conflicts and this would need to be checked. --JW c-- Fill ESEC ! Preshower 2 / Radiator 2 ISect = 2 ! Section number Nlayer = 1 ! Number of Sci layers along z Cell = 1.505 ! Cell full width in z Scint = 0.475 ! Sci layer thickness (4.75mm Bicron) deltaz = -0.0182 ! Amount to shift section in z to align with as-built numbers Jiggle = {0,0,0,0,0,0,0,0,0,0,0,0,0,0,0,0,0,0} ! Degrees to shift EPER in each layer c-- Fill ESEC ! Megatiles 3-6 / Radiators 3-5 ISect = 3 ! Section number Nlayer = 4 ! Number of Sci layers along z Cell = 1.405 ! Cell full width in z Scint = 0.4 ! Sci layer thickness deltaz = -0.0145 ! Amount to shift section in z to align with as-built numbers Jiggle = {0,0,0,0,0,0,0,0,0,0,0,0,0,0,0,0,0,0} ! Degrees to shift EPER in each layer c-- Fill ESEC ! Megatiles 7-23 / Radiators 6-23 ISect = 4 ! Section Nlayer = 18 ! Number of layers along z Cell = 1.405 ! Cell full width in z Scint = 0.4 ! Sci layer thickness deltaz = +0.0336 ! Amount to shift section in z to align with as-built numbers Jiggle = {0,0,0,0,0,0,0,0,0,0,0,0,0,0,0,0,0,0} ! Degrees to shift EPER in each layer c-- Fill ESEC ! Postshower ISect = 5 ! Section Nlayer = 1 ! Number of layers along z Cell = 1.505 ! Cell full width in z Scint = 0.5 ! Sci layer thickness (5.0mm Kurarary) deltaz = +0.036 ! Amount to shift section in z to align with as-built numbers Jiggle = {0,0,0,0,0,0,0,0,0,0,0,0,0,0,0,0,0,0} ! Degrees to shift EPER in each layer c-- c---------------------------------------------------------------------------- c-- Fill EMXG ! EM Endcap SMD basic data Version = 1 ! Geometry version Sapex = 0.7 ! Scintillator strip apex Sbase = 1.0 ! Scintillator strip base Rin = 77.41 ! inner radius of SMD plane Rout = 213.922 ! outer radius of SMD plane F4 = .15 ! F4 thickness c-- c---------------------------------------------------------------------------- c-- Fill EXSE ! First SMD section JSect = 1 ! Section number Zshift = -1.215 ! Section width sectype = {4,1,0,2,1,0} ! 1-V,2-U,3-cutV,4-cutU c-- Fill EXSE ! Second SMD section JSect = 2 ! Section number Zshift = 0. ! Section width sectype = {0,2,1,0,2,3} ! 1-V,2-U,3-cutV,4-cutU c-- Fill EXSE ! Third SMD section JSect = 3 ! Section number Zshift = 1.215 ! Section width sectype = {1,0,2,1,0,2} ! 1-V,2-U,3-cutV,4-cutU c-- c---------------------------------------------------------------------------- c-- Materials c-- c-- PVC used in the SMD spacer layers c-- Component H A=1 Z=1 W=3.0*1.0/62.453 Component C A=12 Z=6 W=2.0*12.0/62.453 Component Cl A=35.453 Z=17 W=1.0*35.453/62.453 Mixture PVC_Spacer Dens=1.390*(1.20/1.00) c-- c-- Lead alloy used in the radiators c-- Component Sn A=118.710 Z=50 W=0.014 Component Ca A=40.0780 Z=20 W=0.00075 Component Al A=26.9815 Z=13 W=0.0003 Component Pb A=207.190 Z=82 W=0.98495 Mixture PbAlloy DENS=11.35 c-- c-- Stainless Steel used in various places c-- Component Cr A=51.9960 Z=24 W=0.19 Component Ni A=58.6934 Z=28 W=0.09 Component Fe A=55.8450 Z=26 W=0.72 Mixture Steel DENS=8.03 c-- c-- Aluminized mylar. According to information which I dug up on a google c-- search, this is typically mylar coated with a thin (1000 angstrom) layer c-- of aluminium on each side. c-- c-- http://www.eljentechnology.com/datasheets/EJ590-B10HH%20data%20sheet.pdf c-- Component Mylar A=12.875 Z=6.4580 w=0.999 Component Al A=26.980 Z=13.000 w=0.001 Mixture AlMylar dens=1.390 c-- c-- G10 Epoxy used in various places c-- Component Si A=28.08 Z=14 W=0.6*1*28./60. Component O A=16 Z=8 W=0.6*2*16./60. Component C A=12 Z=6 W=0.4*8*12./174. Component H A=1 Z=1 W=0.4*14*1./174. Component O A=16 Z=8 W=0.4*4*16./174. Mixture G10 Dens=1.7 c-- c-- Fibreglass cloth used in SMD stackup. I googled this one too... a self- c-- described expert quotes typical densities and percent by volume c-- http://en.allexperts.com/q/Composite-Materials-2430/fiberglass-1.htm c-- c-- glass fiber: 2.6 g/cm3 (17.6%) resin: 1.3 g/cm3 (82.4%) c-- c-- Fiberglass density = 1.529 g/cm3 c-- c-- I will assume that G10 epoxy is close enough to the typical resins c-- used, at least in terms of chemical composition. Then c-- Component G10 A=18.017 Z=9.013 W=1.3*0.824/(1.3*0.824+2.6*0.176) Component Si A=28.08 Z=14 W=2.6*0.176/(1.3*0.824+2.6*0.176)*28.08/60.08 Component O A=16 Z=8 W=2.6*0.176/(1.3*0.824+2.6*0.176)*32.00/60.08 Mixture Fiberglass dens=1.53 c-- c-- c---------------------------------------------------------------------------- c-- Select versions of various geometry data c-- Use EMCG Use EMCS Version=2 Use EETR c-- c---------------------------------------------------------------------------- c-- Calculate frequently used quantities c-- sq3 = sqrt(3.) ! 1/tan(30deg) = sq3 sq2 = sqrt(2.) c-- c-- center = (emcs_zorg+emcs_zend)/2 ! center of the calorimeter tan_upp = tanf(emcs_etamin) ! think this is angle pointing to top of calo tan_low = tanf(emcs_etamax) ! think this is angle pointing to bot of calo rth = sqrt(1. + tan_low*tan_low) ! ?? rshift = emcs_hub * rth ! ?? dup = emcs_rmshift*tan_upp ! dd = emcs_rmshift*rth ! d2 = rshift + dd ! radiator = emcs_pbplate + 2*emcs_lamplate ! thickness of radiator assembly dphi = (emcs_phimax-emcs_phimin)/emcs_nsector ! single endcap sector c-- c---------------------------------------------------------------------------- c---------------------------------------------------------------------------- c-- BEGIN Prin1 emcg_version ('ecalgeo version: ',F4.2) c-- IF (emcg_OnOff>0) THEN c-- c-- Build the EEMC geometry for one half wheel c-- Create ECAL c-- c-- Position the two halves. Bottom half installed in 2003, top c-- half in 2004... so we allow logic to allow for the time c-- evolution of the calorimeter c-- c-- c-- West Endcap c-- IF (emcg_OnOff==1 | emcg_OnOff==3) THEN Position ECAL in CAVE z=+center ENDIF IF (section > emcs_zend) THEN Prin1 section, emcs_zend (' ECALGEO error: sum of sections exceeds maximum ',2F12.4) ENDIF IF (emcg_OnOff==2 ) THEN Prin1 ('East Endcap has been removed from the geometry' ) ENDIF c-- EndIF! emcg_OnOff c-- Prin1 ('ECALGEO finished') c-- c-- END c---------------------------------------------------------------------------- c----------------------------------------------------------------- Block ECAL -- c-- Block ECAL is one EMC EndCap wheel c-- c-- The EEMC is built from two 180 degree half-wheels tilted at an angle c-- with respect to zero in the STAR reference frame. This block is serves c-- as a logical volume which creates the two half wheels. c-- c-- Creates: c-- + EAGA c-- Material Air Attribute ECAL seen=0 colo=7 ! lightblue c-- Shape CONE dz=(emcs_zend-emcs_zorg)/2, rmn1=emcs_zorg*tan_low-d2, rmn2=emcs_zend*tan_low-d2, rmx1=emcs_zorg*tan_upp+dup, rmx2=emcs_zend*tan_upp+dup c-- c-- DO ihalf=1,2 c-- filled = 1 halfi = -105 + (ihalf-1)*180 if (ihalf=2 & emcg_FillMode<3) filled = 0 c-- Create and Position EAGA AlphaZ=halfi c-- ENDDO c-- EndBlock c----------------------------------------------------------------- Block EAGA -- c-- Block EAGA IS HALF OF WHEEL AIR VOLUME FOR THE ENDCAP MODULE c-- c-- The eemc is divided into two halves. one half installed for 2003 run, c-- second half added for 2004 and beyond. the eaga block represents one c-- of these half-wheels. it is an air volume which will be filled in c-- with additional detector components. c-- c-- Creates: c-- + EMSS -- steel support block c-- + ECGH -- air gap between the two halves c-- C-- Material AIR Attribute EAGA seen=0 colo=1 serial=FILLED ! BLACK C-- Shape CONS dz=(emcs_zend-emcs_zorg)/2, rmn1=emcs_zorg*tan_low-d2 rmn2=emcs_zend*tan_low-d2, rmx1=emcs_zorg*tan_upp+dup rmx2=emcs_zend*tan_upp+dup, phi1=emcs_phimin phi2=emcs_phimax c-- c-- IF ( FILLED .EQ. 1 ) THEN c-- Create AND Position EMSS konly='MANY' c-- curr = emcs_zorg curcl = emcs_zend c-- Create AND Position ECGH alphaz=90 kOnly='ONLY' c-- ENDIF c-- EndBlock c----------------------------------------------------------------- Block EMSS -- c-- Block EMSS is the steel support of the endcap module c-- c-- Creates: c-- + EFLP -- ALUMINIUM FRONT PLATE c-- + ECVO -- VOLUMES TO CONTAIN RADIATORS AND MEGATILES c-- + ESHM -- SHOWER MAX DETECTOR VOLUME c-- + ESSP -- STAINLESS STEEL BACKPLATE c-- + ERCM -- STAINLESS STEEL TIE-RODS PENETRATING ECVO c-- c-- Material Steel c-- Attribute EMSS seen=1 colo=1 ! BLACK Shape CONS dz=(emcs_zend-emcs_zorg)/2, rmn1=emcs_zorg*tan_low-d2 rmn2=emcs_zend*tan_low-d2, rmx1=emcs_zorg*tan_upp+dup rmx2=emcs_zend*tan_upp+dup, phi1=emcs_phimin phi2=emcs_phimax c-- c-- Aluminium front plate C-- zslice = emcs_zorg zwidth = emcs_front c-- Prin1 zslice+zwidth/2 (' Front Al plate centered at: ', F12.4 ) c-- Create AND Position EFLP z=zslice-center+zwidth/2 zslice = zslice + zwidth C-- Prin1 zslice (' FIRST CALORIMETER STARTS AT: ',F12.4) c-- c-- Preshower 1, preshower 2, and calorimeter tiles up to c-- megatile number six. c-- fsect = 1 ! first section lsect = 3 ! last section c-- zwidth = emcs_smdcentr - emcs_gapsmd/2 - zslice ! width of current slice c-- Prin1 zslice+zwidth/2 ('Sections 1-3 positioned at: ', F12.4 ) c-- Create AND Position ECVO z=zslice-center+zwidth/2 c-- zwidth = emcs_gapsmd zslice = emcs_smdcentr - emcs_gapsmd/2 c-- Prin1 section, zslice (' 1st calorimeter ends, smd starts at: ',2f10.5) Prin1 zwidth (' smd width = ',f10.5 ) c-- Prin1 zslice+zwidth/2 ('SMD section centered at: ', F12.4 ) c-- Do not kill neighbors Create AND Position ESHM z=zslice-center+zwidth/2 kOnly='MANY' zslice = zslice + zwidth c-- Prin1 zslice (' SMD ends at: ',f10.5) c-- c-- fsect = 4 ! first section lsect = 5 ! last section c-- c-- Calculate the width of the last two calorimeter sections c-- zwidth = 0 DO i_section = fsect,lsect c-- USE ESEC isect=i_section zwidth = zwidth + esec_cell*esec_nlayer c-- ENDDO c-- c-- ============================================================= c-- c-- Total width will be between the back plate and the current c-- position... this effectively turns the geometry into an c-- accordian... whatever was defined earlier will compress c-- / expand this section. so correcting the smd gap will c-- result in some small, sub-mm shifts of radiators and c-- megatiles... one would like to actually place these c-- into their absolute positions. c-- c-- ============================================================== c-- zwidth = emcs_bckfrnt - zslice c-- Prin1 zslice+zwidth/2 ('Sections 4-5 positioned at: ', F12.4 ) c-- Create AND Position ECVO z=zslice-center+zwidth/2 c-- zslice = emcs_bckfrnt c-- Prin1 section,zslice (' 2nd calorimeter ends, back plate starts at: ',2f10.5) c-- zwidth = emcs_bckplate c-- Create AND Position ESSP z=zslice-center+zwidth/2 c-- zslice = zslice + zwidth c-- Prin1 zslice ('EEMC Al backplate ends at: ',F12.4 ) c-- c-- Done with the calorimeter stackup. now go back and cut through the c-- calorimeter stack with the tie rods c-- c-- slice width will be full calorimeter depth zwidth = emcs_zend-emcs_zorg c-- Create ERCM c-- DO i = 1,2 ! two tie rods along DO j = 1,5 ! each gap between sectors (5 gaps) xx = emcs_phimin + j*30 yy = xx*degrad xc = cos(yy)*emcs_tierod(i) yc = sin(yy)*emcs_tierod(i) Position ERCM z=0 x=xc y=yc ENDDO ENDDO c-- c-- Now add in projective steel bars which form part of the support c-- structure of the eemc c-- rth = emcs_zorg*tan_upp+dup + 2.5/2 xc = (emcs_zend - emcs_zorg)*tan_upp length = .5*(emcs_zend + emcs_zorg)*tan_upp + dup + 2.5/2 yc = emcs_zend-emcs_zorg p = atan(xc/yc)/degrad c-- Create EPSB DO i = 1,6 c-- xx = -75 + (i-1)*30 yy = xx*degrad xc = cos(yy)*length yc = sin(yy)*length c-- Position EPSB X=XC Y=YC ALPHAZ=XX c-- ENDDO c-- EndBlock c----------------------------------------------------------------- Block ECVO -- c-- Block ECVO is one of endcap volume with megatiles and radiators c-- c-- CreateS: c-- + EMOD -- Responsible for creating esec which, in a glorious example c-- of spaghetti code, turns around and creates esec, which is c-- responsible for creating the radiators before and after the c-- smd layers. C-- Material AIR Attribute ECVO seen=1 colo=3 ! GREEN Shape CONS dz=zwidth/2, rmn1=zslice*tan_low-dd, rmn2=(zslice+zwidth)*tan_low-dd, rmx1=zslice*tan_upp+dup, rmx2=(zslice+zwidth)*tan_upp+dup c-- c-- Loop over the SIX SECTORS in the current half-wheel. determine c-- whether the sector is filled or not, and create the "module". c-- By "module", we really mean endcap sector. (Lots of code in the c-- EEMC borrows from the barrel, and so barrel modlues get mapped c-- to EEMC sectors). c-- DO i_sector = 1,6 c-- IF (1 < I_SECTOR < 6 | EMCG_FILLMODE > 1) THEN filled = 1 ELSE filled = 0 ENDIF c-- d3 = 75 - (i_sector-1)*30 Create AND Position EMOD alphaz=d3 ncopy=i_sector c-- ENDDO c-- EndBlock c----------------------------------------------------------------- Block ESHM -- c-- Block ESHM is the shower max section c-- c-- CreateS: c-- + ESPL -- SHOWER MAXIMUM DETECTOR PLANES c-- + ERSM -- TIE RODS W/IN THE SHOWER MAXIMUM DETECTOR c-- Material AIR Attribute ESHM seen=1 colo=4 ! BLUE c-- Shape CONS dz=zwidth/2, rmn1=(zslice*tan_low)-dd, rmn2=(zslice+zwidth)*tan_low-dd, rmx1=(zslice)*tan_upp+dup, rmx2=(zslice+zwidth)*tan_upp+dup, phi1=emcs_phimin phi2=emcs_phimax c-- USE EMXG c-- maxcnt = emcs_smdcentr Prin1 zslice, section, center (' === z start for smd,section: ',3f12.4) c-- c-- Loop over the three possible locations for the smd planes and c-- create them. note that code w/in espl will decide which of c-- 5 types of smd planes are created... u, v, cutu,cutv or spacer. c-- DO j_section = 1,3 c-- USE EXSE jsect=j_section c-- current = exse_zshift secwid = emxg_sapex + 2.*emxg_f4 section = maxcnt + exse_zshift c-- Prin1 j_section,current,section,secwid (' layer, z, width : ',i3,3f12.4) c-- rbot=section*tan_low rtop=section*tan_upp c-- Prin1 j_section,rbot,rtop (' layer, rbot,rtop : ',i3,2f12.4) c-- Prin1 j_section, center+current (' smd layer=',I1,' z=',F12.4 ) c-- Do not kill neighbors Create and Position ESPL z=current kOnly='MANY' c-- ENDDO c-- c-- Add in the tie rods which penetrate the SMD layers c-- Create ERSM c-- DO i = 1,2 DO j = 1,5 xx = emcs_phimin + j*30 yy = xx*degrad xc = cos(yy)*emcs_tierod(i) yc = sin(yy)*emcs_tierod(i) Position ERSM Z=0 X=XC Y=YC END DO END DO C-- EndBlock c----------------------------------------------------------------- Block ECGH -- c-- Block ECGH is air gap between endcap half wheels c-- c-- Creates: c-- + ECHC -- THE STAINLESS STEEL COVER FOR 1/2 OF THE EEMC. c-- Material AIR Medium standard Attribute ECGH seen=0 colo=7 ! LIGHTBLUE Shape TRD1 dz=(emcs_zend-emcs_zorg)/2, dy =(emcs_gaphalf+emcs_cover)/2, dx1=emcs_zorg*tan_upp+dup, dx2=emcs_zend*tan_upp+dup c-- c-- rth = emcs_gaphalf + emcs_cover xx=curr*tan_low-d2 xleft = sqrt(xx*xx - rth*rth) yy=curr*tan_upp+dup xright = sqrt(yy*yy - rth*rth) secwid = yy - xx xx=curcl*tan_low-d2 yleft = sqrt(xx*xx - rth*rth) yy=curcl*tan_upp+dup yright = sqrt(yy*yy - rth*rth) zwidth = yy - xx xx=(xleft+xright)/2 yy=(yleft + yright)/2 xc = yy - xx length = (xx+yy)/2 yc = curcl - curr p = atan(xc/yc)/degrad rth = -(emcs_gaphalf + emcs_cover)/2 c-- Create ECHC c-- Position ECHC X=+LENGTH Y=RTH Position ECHC X=-LENGTH Y=RTH ALPHAZ=180 c-- EndBlock c----------------------------------------------------------------- Block ECHC -- c-- Block ECHC is steel endcap half cover c-- Material steel Attribute ECHC seen=1 colo=1 ! BLACK c-- Shape TRAP dz=(curcl-curr)/2, thet=p, bl1=secwid/2, tl1=secwid/2, bl2=zwidth/2, tl2=zwidth/2, h1=emcs_cover/2, h2=emcs_cover/2, phi=0, alp1=0, alp2=0 c-- EndBlock c----------------------------------------------------------------- Block ESSP -- c-- Block ESSP is stainless steel back plate c-- Material steel Attribute ESSP seen=1 colo=6 fill=1 Shape CONS dz=emcs_bckplate/2, rmn1=zslice*tan_low-dd, rmn2=(zslice+zwidth)*tan_low-dd, rmx1=zslice*tan_upp+dup, rmx2=(zslice+zwidth)*tan_upp+dup, phi1=emcs_phimin, phi2=emcs_phimax c-- EndBlock c----------------------------------------------------------------- Block EPSB -- c-- Block EPSB IS A PROJECTILE STAINLESS STEEL BAR C-- Material Steel Attribute EPSB seen=1 colo=6 FILL=1 Shape TRAP dz=(emcs_zend-emcs_zorg)/2, thet=p, bl1=2.5/2, tl1=2.5/2, bl2=2.5/2, tl2=2.5/2, h1=2.0/2, h2=2.0/2, phi=0, alp1=0, alp2=0 c-- c-- EndBlock c----------------------------------------------------------------- Block ERCM -- c-- Block ERCM is stainless steel tie rod in calorimeter sections c-- Material Steel Attribute ERSM seen=1 colo=6 FILL=1 c-- Shape TUBE dz=zwidth/2, rmin=0, rmax=emcs_rtie c-- c-- Looks like the tie rods are meant to engage the 1.525 cm diameter holes c-- piercing the ears of the smd spacer... 1.5 cm may be a better approximation c-- here. c-- c-- http://drupal.star.bnl.gov/star/system/files/smd_spacer_drawings.pdf c-- EndBlock c----------------------------------------------------------------- Block ERSM -- c-- Block ERSM is stainless steel tie rod in shower max c-- Material Steel Attribute ERSM seen=1 colo=6 FILL=1 c-- Shape TUBE dz=zwidth/2, rmin=0, rmax=emcs_rtie c-- c-- see comments above c-- EndBlock c----------------------------------------------------------------- Block EMOD -- c-- Block EMOD (fsect,lsect) IS ONE MODULE OF THE EM ENDCAP c-- c-- Arguements: (do be defined prior to the creation of this block) c-- c-- fsect -- first section to create c-- lsect -- last section to create c-- Attribute EMOD seen=1 colo=3 serial=FILLED ! GREEN Material Air Shape CONS dz=zwidth/2, phi1=emcs_phimin/emcs_nsupsec, phi2=emcs_phimax/emcs_nsupsec, rmn1=zslice*tan_low-dd, rmn2=(zslice+zwidth)*tan_low-dd, rmx1=zslice*tan_upp+dup, rmx2=(zslice+zwidth)*tan_upp+dup c-- c-- Running parameter 'section' contains the position of the current section c-- it should not be modified in daughters, use 'current' variable instead. c-- secwid is used in all 'cons' daughters to define dimensions. c-- section = zslice curr = zslice + zwidth/2 c-- c-- DO i_section = fsect, lsect USE ESEC isect=i_section c-- secwid = esec_cell*esec_nlayer c-- c-- Section 3 precedes the smd. section 5 is the post shower. in c-- both cases these sections end with a scintillator layer and no c-- radiator. c-- IF (I_SECTION = 3 | I_SECTION = 5) THEN secwid = secwid - radiator ELSE IF (I_SECTION = 4) THEN ! add one more radiator secwid = secwid - esec_cell + radiator ENDIF c-- Prin1 i_section, section-curr+secwid/2 ('+ ECVO isection=',I1,' zcenter=', F12.4) c-- Create AND Position ESEC z=section-curr+secwid/2 c-- section = section + secwid c-- ENDDO! Loop over sections c-- EndBlock c----------------------------------------------------------------- Block ESEC -- c-- Block ESEC is a single em section Material AIR Medium standard Attribute ESEC seen=1 colo=1 serial=filled lsty=2 c-- Shape CONS dz=secwid/2, rmn1=(section)*tan_low-dd, rmn2=(section+secwid)*tan_low-dd, rmx1=(section)*tan_upp+dup, rmx2=(section+secwid)*tan_upp+dup c-- length = -secwid/2 current = section c-- megatile = esec_scint+emcs_alincell+emcs_frplast+emcs_bkplast c-- gap = esec_cell - radiator - megatile Prin2 i_section,section (' ESEC:i_section,section',i3,f12.4) c-- c-- Loop over all layers in this section c-- DO is = 1,esec_nlayer c-- c-- Define actual cell thickness: cell = esec_cell plate = radiator c-- IF (is=nint(esec_nlayer) & (i_section = 3 | i_section = 5)) THEN c-- cell = megatile + gap plate=0 c-- ELSE IF (i_section = 4 & is = 1) THEN ! RADIATOR ONLY c-- cell = radiator c-- ENDIF c-- Prin2 i_section,is,length,cell,current (' esec:i_section,is,length,cell,current ',2i3,3f12.4) C-- C-- This handles the special case in the section after the smd. c-- this section begins with a lead radiator. the previous section c-- ended with a plastic scintillator c-- IF (i_section = 4 & is = 1) THEN ! radiator only c-- c$$$ cell = radiator + .14 cell = radiator + emcs_slop ! ^^^^ probably the fiber router layer... but is this needed here? c-- Prin1 is, current + cell/2+esec_deltaz ( ' + ESEC radiator ilayer=',I2,' z=',F12.4 ) Create AND Position ERAD z=length+(cell)/2+esec_deltaz c-- length = length + cell current = current + cell c-- c-- All other cases are standard radiator followed by scintillator c-- ELSE c-- cell = megatile IF (FILLED = 1) THEN c-- Create AND Position EMGT z=length+(gap+cell)/2+esec_deltaz c-- xx = current + (gap+cell)/2+esec_deltaz prin2 i_section,is,xx (' mega i_section,is ',2i3,f10.4) Prin1 is, xx (' + ESEC megatile ilayer=',I2,' z=',F12.4) c-- ENDIF c-- length = length + cell + gap current = current + cell + gap c-- IF (PLATE>0) THEN c-- cell = radiator Prin1 is, current + cell/2+esec_deltaz ( ' + ESEC radiator ilayer=',I2,' z=',F12.4 ) Create AND Position ERAD z=length+cell/2+esec_deltaz c-- length = length + cell current = current + cell c-- ENDIF c-- ENDIF c-- ENDDO c-- c-- EndBlock c----------------------------------------------------------------- Block EMGT -- c-- Block EMGT is a 30 degree megatile c-- Material Air Medium Standard Attribute EMGT seen=1 colo=1 lsty=2 c-- Shape CONS dz=megatile/2, rmn1=(current)*tan_low-dd, rmn2=(current+megatile)*tan_low-dd, rmx1=(current)*tan_upp+dup, rmx2=(current+megatile)*tan_upp+dup c-- c-- DO isec=1,nint(emcs_nslices) c-- myPhi = (emcs_nslices/2-isec+0.5)*dphi + esec_jiggle(is) c-- Create AND Position EPER alphaz=myPhi c-- END DO c-- EndBlock c----------------------------------------------------------------- Block EPER -- c-- Block EPER is a 5 degree slice of a 30 degree megatile (subsector) c-- c-- Creates: c-- + ETAR -- The pseudo-rapidity divivisions in the megatiles c-- Material Polystyren Attribute EPER seen=1 colo=1 lsty=1 c-- c-- c-- Shape CONS dz=megatile/2, phi1=emcs_phimin/emcs_nsector, phi2=emcs_phimax/emcs_nsector, rmn1=(current)*tan_low-dd, rmn2=(current+megatile)*tan_low-dd, rmx1=(current)*tan_upp+dup, rmx2=(current+megatile)*tan_upp+dup c-- curcl = current+megatile/2 DO ie = 1, nint(eetr_neta) c-- etabot = eetr_etabin(ie) etatop = eetr_etabin(ie+1) rbot=(curcl)*tanf(etabot) rtop=min((curcl)*tanf(etatop), ((current)*tan_upp+dup)) c-- check rbot<rtop c-- xx=tan(pi*emcs_phimax/180.0/emcs_nsector) yy=cos(pi*emcs_phimax/180.0/emcs_nsector) Create and Position ETAR x=(rbot+rtop)/2 ort=yzx prin2 ie,etatop,etabot,rbot,rtop (' EPER : ie,etatop,etabot,rbot,rtop ',i3,4f12.4) c-- ENDDO c-- EndBlock c----------------------------------------------------------------- Block ETAR -- c-- c-- ETAR is a single cell of scintillator, including fiber router, plastic, c-- etc... c-- c-- local z is radially outward in star c-- local y is the thickness of the layer c-- Block ETAR is a single calorimeter cell, containing scintillator, fiber router, etc... c-- Material POLYSTYREN Attribute ETAR seen=1 colo=4 lsty=1 ! BLUE c-- Shape TRD1 dy=megatile/2 dz=(rtop-rbot)/2, dx1=rbot*xx-emcs_gapcel/yy, dx2=rtop*xx-emcs_gapcel/yy c-- Create AND Position EALP y=(-megatile+emcs_alincell)/2 g10 = esec_scint Create AND Position ESCI y=(-megatile+g10)/2+emcs_alincell _ +emcs_frplast c-- EndBlock c----------------------------------------------------------------- Block ESCI -- c-- Block ESCI is the active scintillator (polystyrene) layer c-- c-- Obtain the definition of polystyrene on this line, next line clones Material Polystyren Material Ecal_scint isvol=1 Medium Ecal_active isvol=1 c-- Attribute ESCI seen=1 colo=7 fill=0 lsty=1 ! LIGHTBLUE c-- local z goes along the radius, y is the thickness Shape TRD1 dy=esec_scint/2, dz=(rtop-rbot)/2-emcs_gapcel c-- c-- Call ecal_set_cuts( ag_imed, 'detector' ) c-- c-- HITS ESCI BIRK:0:(0,10) c-- c-- EndBlock c----------------------------------------------------------------- Block ERAD -- c-- Block ERAD is the lead radiator with stainless steel cladding c-- c-- Creates: c-- + ELED -- the business end of the calorimeter... c-- Material STEEL c-- Attribute ERAD seen=1 colo=6 fill=1 lsty=1 ! VIOLET Shape CONS dz=radiator/2, rmn1=(current)*tan_low-dd, rmn2=(current+cell)*tan_low-dd, rmx1=(current)*tan_upp+dup, rmx2=(current+radiator)*tan_upp+dup c-- Create AND Position ELED c-- EndBlock c------------------------------------------------------------------------- c----------------------------------------------------------------- Block ELED -- c-- Block ELED is a lead absorber plate c-- c-- Material PbAlloy Medium Ecal_lead Attribute ELED seen=1 colo=4 fill=1 lsty=1 c-- Shape TUBS dz=emcs_pbplate/2, rmin=(current)*tan_low, rmax=(current+emcs_pbplate)*tan_upp, c-- Call ecal_set_cuts( ag_imed, 'radiator' ) c-- EndBlock c-- c----------------------------------------------------------------------------- c----------------------------------------------------------------- Block EFLP -- c-- Block EFLP is the aluminum (aluminium) front plate of the endcap c-- Material ALUMINIUM Attribute EFLP seen=1 colo=3 fill=1 lsty=1 ! GREEN Shape CONS dz=emcs_front/2, rmn1=68.813 rmn2=68.813, rmx1=(zslice)*tan_upp+dup, rmx2=(zslice+zwidth)*tan_upp+dup, phi1=emcs_phimin phi2=emcs_phimax c-- EndBlock c----------------------------------------------------------------------------- c----------------------------------------------------------------- Block EALP -- c-- Block EALP is the thin aluminium plate in calorimeter cell c-- c-- Material Aluminium Attribute EALP seen=1 colo=1 lsty=1 c-- c-- Shape TRD1 dy=emcs_alincell/2 dz=(rtop-rbot)/2 c-- c-- Thin aluminium plate in each calorimeter cell. The energy-loss c-- fluctuations are restricted in this thin material. c-- CALL GsTPar (AG_IMED,'CUTGAM',0.00001) CALL GsTPar (AG_IMED,'CUTELE',0.00001) CALL GsTPar (AG_IMED,'LOSS',1.) CALL GsTPar (AG_IMED,'STRA',1.) c-- EndBlock c----------------------------------------------------------------- Block ESPL -- c-- Block ESPL is the logical volume containing an SMD plane c-- Material Air Attribute ESPL seen=1 colo=4 lsty=4 Shape TUBS dz=emcs_gapsmd/3/2, rmin=section*tan_low-1.526, rmax=(section-secwid/2)*tan_upp+dup, phi1=emcs_phimin phi2=emcs_phimax c-- USE EMXG version=1 msecwd = (emxg_sapex+emxg_f4)/2 c-- ^^^^^^ what is this used for? --jw c-- looks like the g10 layer which we are retiring c-- c-- loop over the six sectors in an endcap half wheel c-- DO isec=1,6 cut=1 d3 = 75 - (isec-1)*30 c-- IF (exse_sectype(isec)=0|(emcg_fillmode=1&(isec=6|isec=1))) THEN cut = 0 c -- come back and build spacers -- ElseIF (exse_sectype(isec) = 1) then ! v c-- Create and Position EXSG alphaz=d3 ncopy=isec kOnly='MANY' c-- ElseIF (exse_sectype(isec) = 2) then ! u c-- Create and Position EXSG alphaz=d3 ort=x-y-z ncopy=isec kOnly='MANY' c-- ElseIF (exse_sectype(isec) = 3) then ! cut v c-- cut=2 Create and Position EXSG alphaz=d3 ncopy=isec kOnly='MANY' c-- ElseIF (exse_sectype(isec) = 4) then ! cut u c-- cut=2 Create and Position EXSG alphaz=d3 ort=x-y-z ncopy=isec kOnly='MANY' c-- EndIF c-- EndDO! loop over six sectors in eemc half wheel c-- c-- repeat the loop and add in the spacer layers c-- DO isec=1,6 d3=75 - (isec-1)*30 IF (exse_sectype(isec)=0|(emcg_fillmode=1&(isec=6|isec=1))) then cut = 0 c-- Do not kill neighbors Create and Position EXSG alphaz=d3 ncopy=isec kOnly='MANY' c ^^^^^^^^^^^^^^^^^^^^^^^^^^^^^^^^^^^^^^^^^^^^^ c potential side effect... may screw up the mapping c of the smd strips into the tables? c EndIF EndDO c-- EndBlock c----------------------------------------------------------------- Block EXSG -- c-- Block EXSG Is another logical volume... this one acutally creates the planes c-- c-- Creates: c-- + EHMS -- shower max strips c-- + EFLS -- front cover for SMD planes c-- + EBLS -- back cover for SMD planes c-- Attribute EXSG seen=1 colo=7 serial=cut lsty=3 ! MEH Material Air c$$$ Medium TMED_EXSG stemax=0.01 Shape TUBS dz=emcs_gapsmd/3/2, rmin=section*tan_low-1.526, rmax=(section-secwid/2)*tan_upp+dup, phi1=emcs_phimin/emcs_nsupsec-5, phi2=emcs_phimax/emcs_nsupsec+5 c-- rbot = emxg_rin rtop = emxg_rout c-- c-- Code to handle smd spacers c-- IF ( cut .eq. 0 ) THEN Create and Position EXPS kONLY='MANY' ENDIF c-- c-- Code to handle smd planes c-- IF (cut > 0) THEN c-- c-- setup which plane we are utilizing c-- IF (cut = 1) THEN nstr = 288 ELSE nstr = 285 ENDIF c-- c-- loop over all smd strips and place them w/in this smd plane c-- DO istrip = 1,nstr c-- Call ecal_get_strip( section, cut, istrip, xc, yc, length ) c-- IF (mod(istrip,2) != 0 ) THEN Create and Position EHMS x=xc y=yc alphaz=-45 kOnly='ONLY' Create and Position EBLS x=xc y=yc z=(+esmd_apex/2+esmd_back_layer/2) alphaz=-45 kOnly='ONLY' ELSE Create and Position EHMS x=xc y=yc alphaz=-45 ort=x-y-z kOnly='ONLY' Create and Position EFLS x=xc y=yc z=(-esmd_apex/2-esmd_front_layer/2) alphaz=-45 ort=x-y-z kOnly='ONLY' ENDIF c-- Prin1 istrip, xc, yc, length ( 'SMD Plane: strip=',I3,' xc=',F5.1,' yc=,'F5.1,' length=',F5.1 ) c-- ENDDO c-- ENDIF c-- c-- * dcut exsg z 0 0 10 0.1 0.1 * dcut exsg y 0 10 -50 0.7 0.7 c-- EndBlock c-- c-- c----------------------------------------------------------------------------- c----------------------------------------------------------------- Block EHMS -- c-- Block EHMS defines the triangular SMD strips c-- Material Ecal_scint Medium Ecal_active isvol=1 Attribute EHMS seen=1 colo=2 serial=cut lsty=1 ! red c-- Shape TRD1 dx1=0 dx2=emxg_Sbase/2 dy=length/2 dz=emxg_Sapex/2 c-- HITS EHMS Birk:0:(0,10) c-- Endblock! EHMS c----------------------------------------------------------------------------- c--- c-- Several thin layers of material are applied to the front and back of the c-- SMD planes to provide structural support. We combine these layers into c-- a single effective volume, which is affixed to the base of the SMD c-- strips. As with the SMD strips, z along the depth, y is length c-- c-- http://drupal.star.bnl.gov/STAR/system/files/SMD_module_stack.pdf c-- c-- 1.19 mm G10 c-- 0.25 mm Fiberglass and epoxy c-- 0.17 mm Aluminized mylar c-- c-- Weight in mixture by mass = (depth)*(Area) c-- c-- Weighted density is given by sum (density)_i * (depth)_i / sum (depth)_i c-- c----------------------------------------------------------------- Block EFLS -- c-- Block EFLS is the layer of material on the front of the SMD planes c-- c-- Component G10 A=18.017 Z=9.013 w=1.19*1.700/(1.19*1.700+0.25*1.530+0.17*1.390) Component Fiberglass A=19.103 Z=9.549 w=0.25*1.530/(1.19*1.700+0.25*1.530+0.17*1.390) Component AlMylar A=12.889 Z=6.465 w=0.17*1.390/(1.19*1.700+0.25*1.530+0.17*1.390) Mixture EFLS dens=(1.19*1.7+0.25*1.53+0.17*1.39)/(1.19+0.25+0.17) Attribute EFLS seen=1 colo=22 lsty=1 Shape TRD1 dz=esmd_front_layer/2 dy=length/2 dx1=esmd_base/2 dx2=esmd_base/2 c-- EndBlock! EFLS c-- c-- see link above for documentation c-- c-- 0.10 mm aluminized mylar c-- 0.25 mm fiberglass and epoxy c-- 1.50 mm WLS fiber router layer (polystyrene) c-- 0.25 mm aluminum c-- c----------------------------------------------------------------- Block EBLS -- c-- Block EBLS is the layer of material on the back of the SMD planes c-- Component AlMylar A=12.889 Z=6.465 w=0.10*1.390/(0.10*1.390+0.25*1.530+1.50*1.032+0.25*2.699) Component Fiberglass A=19.103 Z=9.549 w=0.25*1.530/(0.10*1.390+0.25*1.530+1.50*1.032+0.25*2.699) Component Polystyren A=11.154 Z=5.615 w=1.50*1.032/(0.10*1.390+0.25*1.530+1.50*1.032+0.25*2.699) Component Al A=28.08 Z=14.00 w=0.25*2.699/(0.10*1.390+0.25*1.530+1.50*1.032+0.25*2.699) Mixture EBLS dens=(0.10*1.390+0.25*1.530+1.50*1.032+0.25*2.699)/(0.10+0.25+1.50+0.25) c-- Attribute EFLS seen=1 colo=22 lsty=1 Shape TRD1 dz=esmd_back_layer/2 dy=length/2 dx1=esmd_base/2 dx2=esmd_base/2 c-- EndBlock! EFLS c----------------------------------------------------------------- Block EXPS -- c-- Block EXPS is the plastic spacer in the shower maximum section c-- c-- Simple implementation of the spacer in the shwoer maximum detector. c-- This implmentation neglects the ears and the source tube. c-- c-- n.b. There may be a side effect in the way this gets created... c-- it could overwrite SMD strips which extend into this plane. c-- Probably need to go with a different approach here. c-- c-- Scanned Drawings: c-- + http://drupal.star.bnl.gov/STAR/system/files/SMD_spacer_drawings.pdf c-- c-- thickness is 1.2 cm, as given by detail B and C... but I do not want c-- to do alot of complicated recoding of the geometry. So I am limiting c-- it to be the same width as a normal SMD volume. c-- Material PVC_Spacer Attribute EXPS seen=1 colo=6 lsty=1 lwid=2 c-- c-- Spacer layers are extended by +/- 5 degrees into the adjacent sectors. c-- The kONLY='Many' option at creation time should mean that conflicts c-- in volume will be resolved in favor of the SMD strips. c-- Shape TUBS dz=esmd_apex/2, rmin=(section)*Tan_Low-1.526, rmax=(section+msecwd)*Tan_Upp, phi1=emcs_PhiMin/emcs_Nsupsec, phi2=emcs_PhiMax/emcs_Nsupsec c-- EndBlock c-- END c----------------------------------------------------------------- End Module -- c------------------------------------------------------------------------------ c-- Helper subroutines and functions c------------------------------------------------------------------------------ c-- c-- Subroutine ecal_set_cuts(id, medium) c-- c-- id -- integer ID idetifying the current tracking medium c-- medium -- character switch selecting the type of cuts to be c-- used in this tracking volumne c-- c------------------------------------------------------------------------------ Subroutine ecal_set_cuts(id,medium) c-- Implicit NONE Integer id Character medium*(*) c-- Integer radiator, megatile, detector Save radiator, megatile, detector c-- IF ( medium == 'print' ) THEN c-- Write (*,400) radiator Write (*,401) megatile Write (*,402) detector c-- Call GpTMed( +radiator ) Call GpTMed( -megatile ) Call GpTMed( -detector ) c-- Return c-- ENDIF c-- 400 Format('radiator cuts set for ag_imed=',I3) 401 Format('megatile cuts set for ag_imed=',I3) 402 Format('detector cuts set for ag_imed=',I3) c-- c-- c-- Setup common cuts for neutrons, hadrons and muons c-- Call GsTPar (id,'CUTNEU',0.001) Call GsTPar (id,'CUTHAD',0.001) Call GsTPar (id,'CUTMUO',0.001) c-- IF ( medium == 'radiator' ) THEN Call GsTPar (id,'CUTGAM',0.00008) Call GsTPar (id,'CUTELE',0.001) Call GsTPar (id,'BCUTE' ,0.0001) radiator = id C-- c-- ELSEIF ( medium == 'megatile' ) THEN Call GsTPar (id,'CUTGAM',0.00008) Call GsTPar (id,'CUTELE',0.001) Call GsTPar (id,'BCUTE' ,0.0001) megatile = id c-- c-- ELSEIF ( medium == 'detector' ) THEN Call GsTPar (id,'CUTGAM',0.00008) Call GsTPar (id,'CUTELE',0.001) Call GsTPar (id,'BCUTE' ,0.0001) c-- Call GsTPar (id,'BIRK1',1.) Call GsTPar (id,'BIRK2',0.0130) Call GsTPar (id,'BIRK3',9.6E-6) detector = id c-- c-- ELSE Call GsTPar (id,'CUTGAM',0.00008) Call GsTPar (id,'CUTELE',0.001) Call GsTPar (id,'BCUTE' ,0.0001) Write(*,300) 300 Format('Warning: unknown medium[',A20,'] in ecal_set_cuts') c-- c-- ENDIF c-- Return End c----------------------------------------------------------------------- c----------------------------------------------------------------------- c-- c-- Subroutine ecal_get_strip( section, cut, istrip, xcenter, ycenter, length ) c-- in in in out out out Implicit NONE c-- Real section Integer cut ! 0=no plane 1=normal plane 2=cut plane Integer istrip ! strip index Real xcenter ! output Real ycenter ! output Real length ! output c-- Integer nstrips Real rdel ! shift in radius (?) Real rth Real ddn, ddup Real megatile, p c-- Real xleft, yleft, xright, yright Real dxy, xx, yy Real sqrt2, sqrt3 c-- c-- SMD data copied from data structures above c-- Real base, apex Data base, apex / 1.0, 0.7/ !cm c-- Real Rbot, Rtop Data Rbot, Rtop / 77.41, 213.922 / c-- Real EtaMin, EtaMax Data EtaMin, EtaMax / 1.086, 2.000 / c-- Real tan_theta_min, tan_theta_max c-- Real tanf, eta tanf(eta) = tan(2*atan(exp(-eta))) c-- tan_theta_min = tanf( EtaMax ) tan_theta_max = tanf( EtaMin ) c-- IF (cut = 1) THEN rdel = 3.938 nstrips = 288 ELSE rdel = -.475 nstrips = 285 ENDIF c-- xcenter=0. ycenter=0. length=0. c-- IF ( cut = 0 ) THEN RETURN ENDIF c-- sqrt2 = sqrt(2.0) sqrt3 = sqrt(3.0) c-- rth = .53*rdel ! .53 --- tentatavily jcw-- wtf? ddn = sqrt(3.0)*1.713 + rdel ddup = .5*1.846 + 1.713 megatile = base + .01 c-- p = .5*(istrip-1)*megatile + 41.3655 IF (p <= (.5*rbot*sqrt3 + rth)) THEN dxy = 1.9375*sqrt2 xleft = .5*sqrt2*p*(sqrt3 + 1.) - dxy yleft = .5*sqrt2*p*(sqrt3 - 1.) - dxy yright = .5*sqrt2*(sqrt( rbot*rbot - p*p) - p) xright = sqrt2*p + yright ELSEIF ((.5*rbot*sqrt3 + rth) < p <= (.5*rtop + 1.5)) THEN dxy = 1.9375*sqrt2 xleft = .5*sqrt2*p*(sqrt3 + 1.) - dxy yleft = .5*sqrt2*p*(sqrt3 - 1.) - dxy dxy = rdel*sqrt2/sqrt3 yright = .5*sqrt2*p*(1.- 1./sqrt3) xright = sqrt2*p - yright - dxy yright = -yright - dxy ELSEIF (p > (.5*rtop +1.5)) THEN yleft = (sqrt(rtop*rtop - p*p) - p)/sqrt2 xleft = sqrt2*p + yleft dxy = rdel*sqrt2/sqrt3 yright = .5*sqrt2*p*(1.- 1./sqrt3) xright = sqrt2*p - yright - dxy yright = -yright - dxy dxy = 0. c-- IF ((.5*sqrt3*160.- ddn) < p <= (.5*sqrt3*160.+ ddup) ) THEN xcenter = .5*(sqrt3*160.+1.846) ycenter = xcenter - .5*sqrt3*1.713 IF (p > ycenter) THEN dxy = .5*sqrt2*(2/sqrt3*rdel + .5*sqrt3*1.846 +_ sqrt(1.713*1.713 - (p-xcenter)*(p-xcenter))) ELSE dxy = sqrt2/sqrt3*(p - .5*sqrt3* 160. + ddn) ENDIF ELSEIF ((.5*sqrt3*195.- ddn) < p <= (.5*sqrt3*195. + ddup) ) THEN xcenter = .5*(sqrt3*195.+1.846) ycenter = xcenter - .5*sqrt3*1.713 IF (p > ycenter) THEN dxy = .5*sqrt2*(2/sqrt3*rdel + .5*sqrt3*1.846 +_ sqrt(1.713*1.713 - (p-xcenter)*(p-xcenter))) ELSE dxy = sqrt2/sqrt3*(p - .5*sqrt3*195. + ddn) ENDIF ENDIF xright = xright + dxy yright = yright + dxy ENDIF dxy = section*tan_theta_max - rtop xcenter = .5*(xright+xleft) + dxy ycenter = .5*(yright+yleft) xx = .5*sqrt2*(xleft+yleft) yy = .5*sqrt2*(xright+yright) length = xx-yy c-- c-- Return c-- End! Subroutine smd_strip c-- * ---------------------------------------------------------------------------- * ECAL nice views: dcut ecvo x 1 10 -5 .5 .1 * draw emdi 105 0 160 2 13 .2 .1 * draw emdi 120 180 150 1 14 .12 .12 * --------------------------------------------------------------------------- c-- examples of HITS * HITS EHMS Birk:0:(0,10) * xx:16:SH(-250,250) yy:16:(-250,250) zz:16:(-350,350), * px:16:(-100,100) py:16:(-100,100) pz:16:(-100,100), * Slen:16:(0,1.e4) Tof:16:(0,1.e-6) Step:16:(0,100), * none:16: Eloss:0:(0,10) *
2009.10.12 Jason EEMC geometry: effects of adding layers
Effect of added layers in Jason geometry file (ecalgeo.g23)
Monte-Carlo setup:
- One photon per event
- EEMC only geometry with LOW_EM option
- Throw particles flat in eta (1.08, 2.0), phi (0, 2pi), and pt (6-10 GeV)
- Using A2Emaker to get reconstructed Tower/SMD energy
(no EEMC SlowSimulator in chain) - Vertex z=0
- ~50K/per particle type
- Non-zero energy: 3 sigma above pedestal
Cuts for shower shapes:
Single particle kinematic cuts: pt=7-8GeV, eta=1.2-1.4
All shapes are normalized to 1 at peak (central strip)
Added layer definition from Jason file:
- EXPS is the plastic spacer in the shower maximum section
- EBLS is the layer of material on the back of the SMD planes
- EFLS is the layer of material on the front of the SMD planes
Some comments:
- Figs. 1-2 show that I can reproduce
sampling fraction and shower shapes
which I see with geometry file from CVS
if I disable all three added layers in Jason geometry file
(this assumes/shows that G10 layer have tiny effect).
This a good starting point, since it indicate that
all other (cosmetic) code modifications
are most probably done correctly and has no
effect on simulated detector response. - Fig. 3 shows effect of each added layer
(plastic spacers and layers in front/back of SMD)
on the sampling fraction and 2x1/3x3 energy profile:- Each layer contributes more or less equally to the sampling fraction.
- Energy profile (E2x1 / E3x3) does not affected by the added layers
- Fig. 4 shows effect of each added layer on the shower shapes:
- Back SMD layer does not contribute much (as expected).
- Front and spacers introduce equal amount of "shape narrowing".
- Figs. 5-6 show pre-shower sorted shower shapes
and comparison with eta-meson shapes.
No layers and G10 removed
Figure 1: Sampling fraction vs. thrown energy
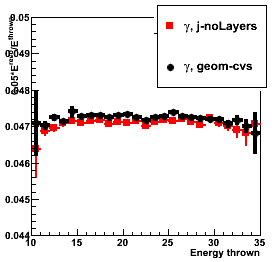
Figure 2: Shower shapes
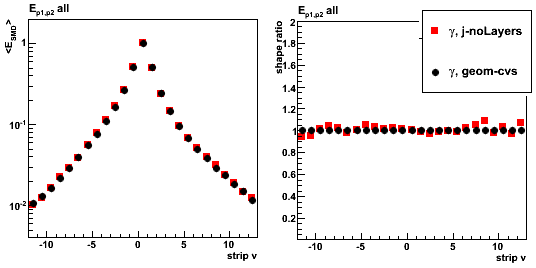
Adding new laters (spacer, front, back)
Figure 3: Sampling fraction vs. thrown energy (left), 2x1/3x3 energy ratio (right)
See legend for details
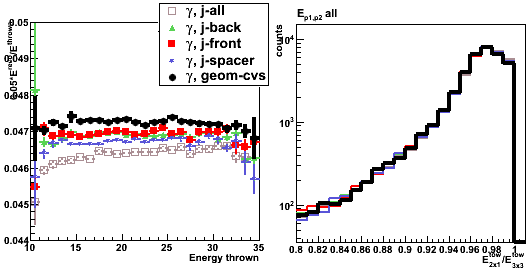
Figure 4: Shower shapes. See legend for details
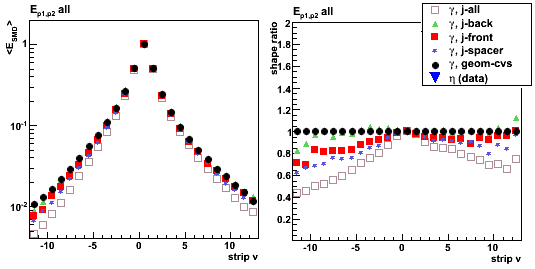
Shower shapes sorted by pre-shower energy
Pre-shower bins:
- Ep1 = 0, Ep2 = 0 (no energy in both EEMC pre-shower layers)
- Ep1 = 0, Ep2 > 0
- 0 < Ep1 < 4 MeV
- 4 < Ep1 < 10 MeV
- Ep1 > 10 MeV
- All pre-shower bins combined
Ep1/Ep2 is the energy deposited in the 1st/2nd EEMC pre-shower layer.
For a single particle MC it is a sum over
all pre-shower tiles in the EEMC with energy of 3 sigma above pedestal.
For eta-meson from pp2006 data the sum is over 3x3 tower patch
Figure 5: Shower shapes (left) and their ratio (right)
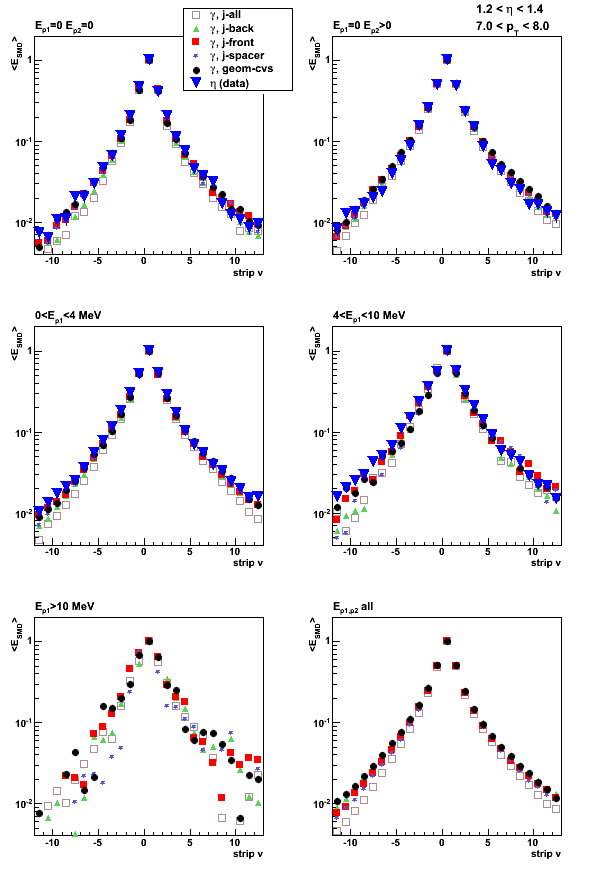
Figure 6: Shower shape ratios
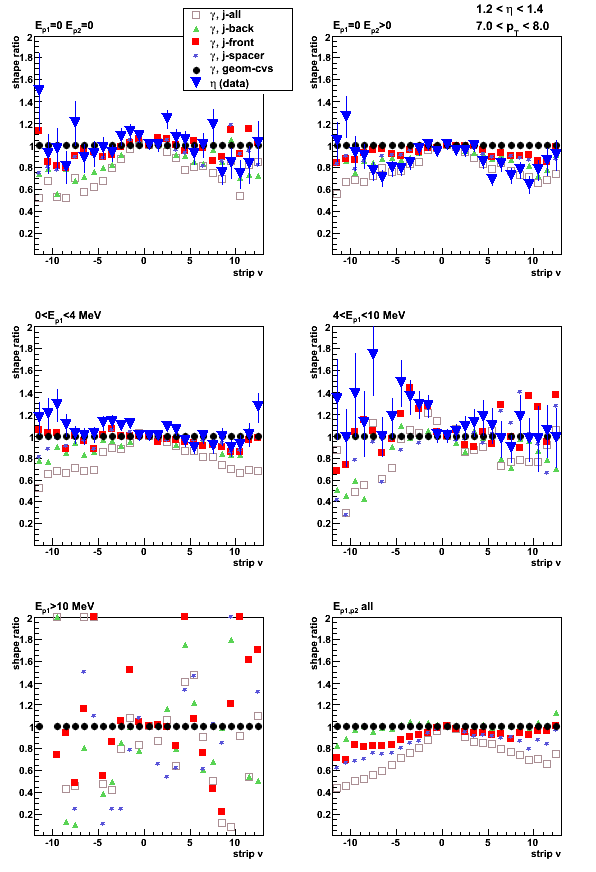
2009.10.13 Jason EEMC geometry: position correlations
Effect of added layers in Jason geometry file (ecalgeo.g23)
Monte-Carlo setup:
- One photon per event
- EEMC only geometry with LOW_EM option
- Throw particles flat in eta (1.08, 2.0), phi (0, 2pi), and pt (6-10 GeV)
- Using A2Emaker to get reconstructed Tower/SMD energy
(no EEMC SlowSimulator in chain) - Vertex z=0
- ~50K/per particle type
- Non-zero energy: 3 sigma above pedestal
Added layer definition from Jason file:
- EXPS is the plastic spacer in the shower maximum section
- EBLS is the layer of material on the back (routing layers) of the SMD planes
- EFLS is the layer of material on the front (G10, etc) of the SMD planes
Geometry configurations and notations (shown in the center of the plot):
- j-noLayers: Jason geometry: no EXPS, EBLS, EFLS
- j-back: Jason geometry, EBLS only
- j-front: Jason geometry, EFLS only
- j-spacer: Jason geometry, EXPS only
- j-all: Jason geometry, all new layers included
- geom-cvs geometry file from CVS after cAir bug fixed
cross section of 1st SMD plane labeled with "SUV" ordering
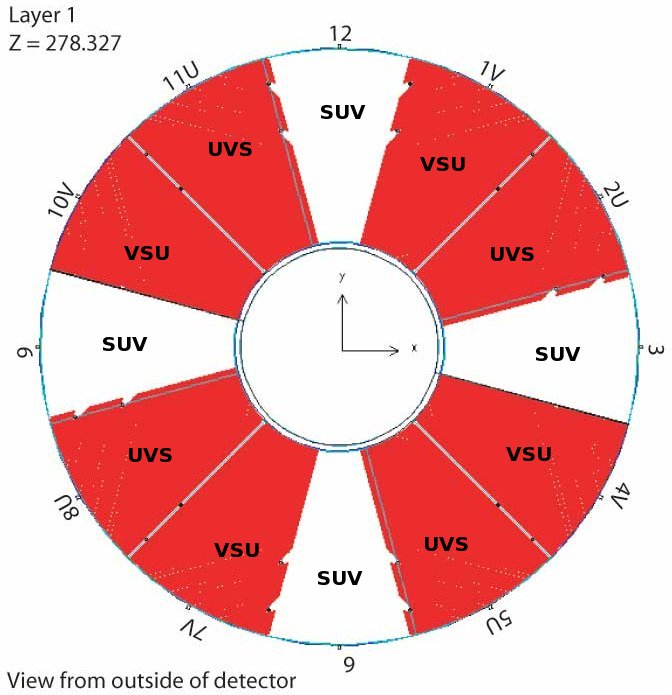
Note: u-v ordering scheme can be found here (Fig. 9-11)
Figure 1: Average number of SMD u-strip fired vs. thrown photon's (x,y)

Figure 2:Average number of SMD v-strip fired vs. thrown photon's (x,y)

Figure 3:Average SMD u-energy vs. thrown photon's (x,y)
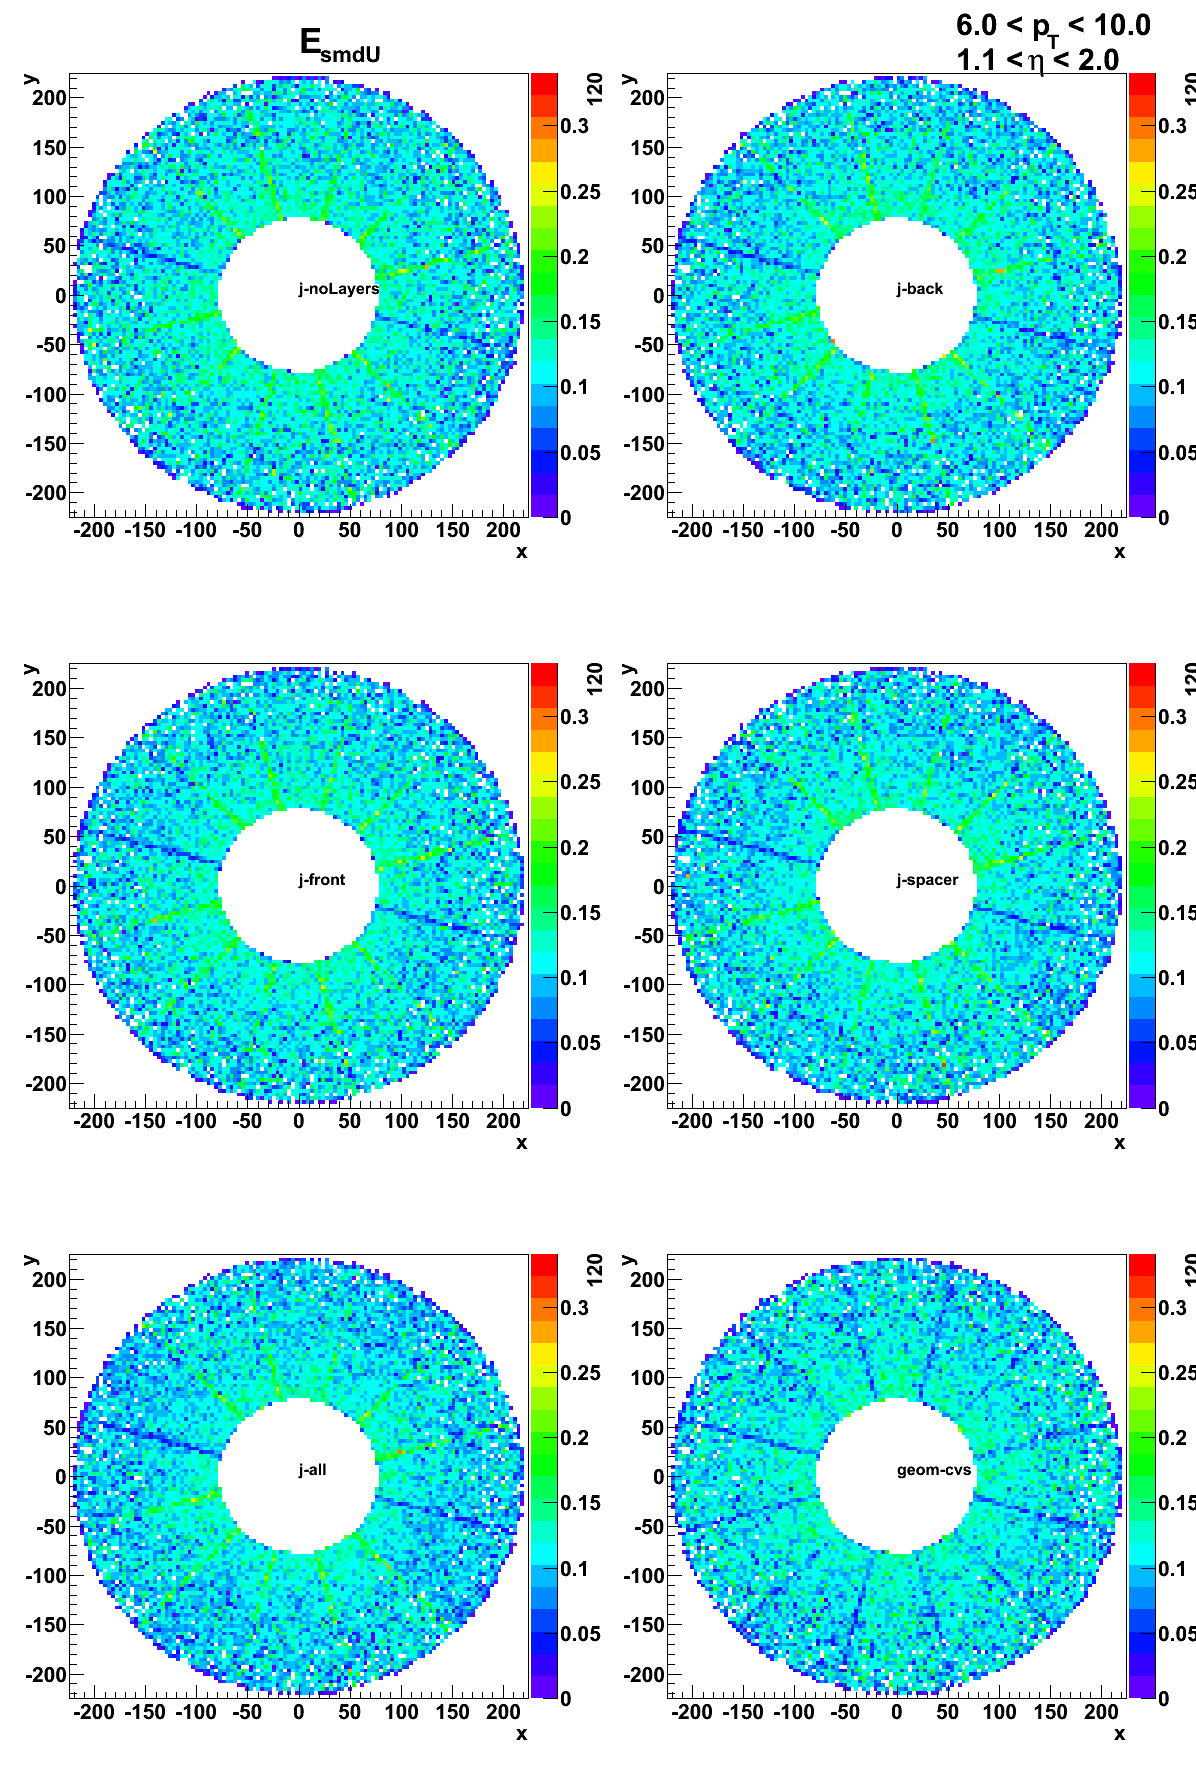
Figure 4:Average SMD v-energy vs. thrown photon's (x,y)
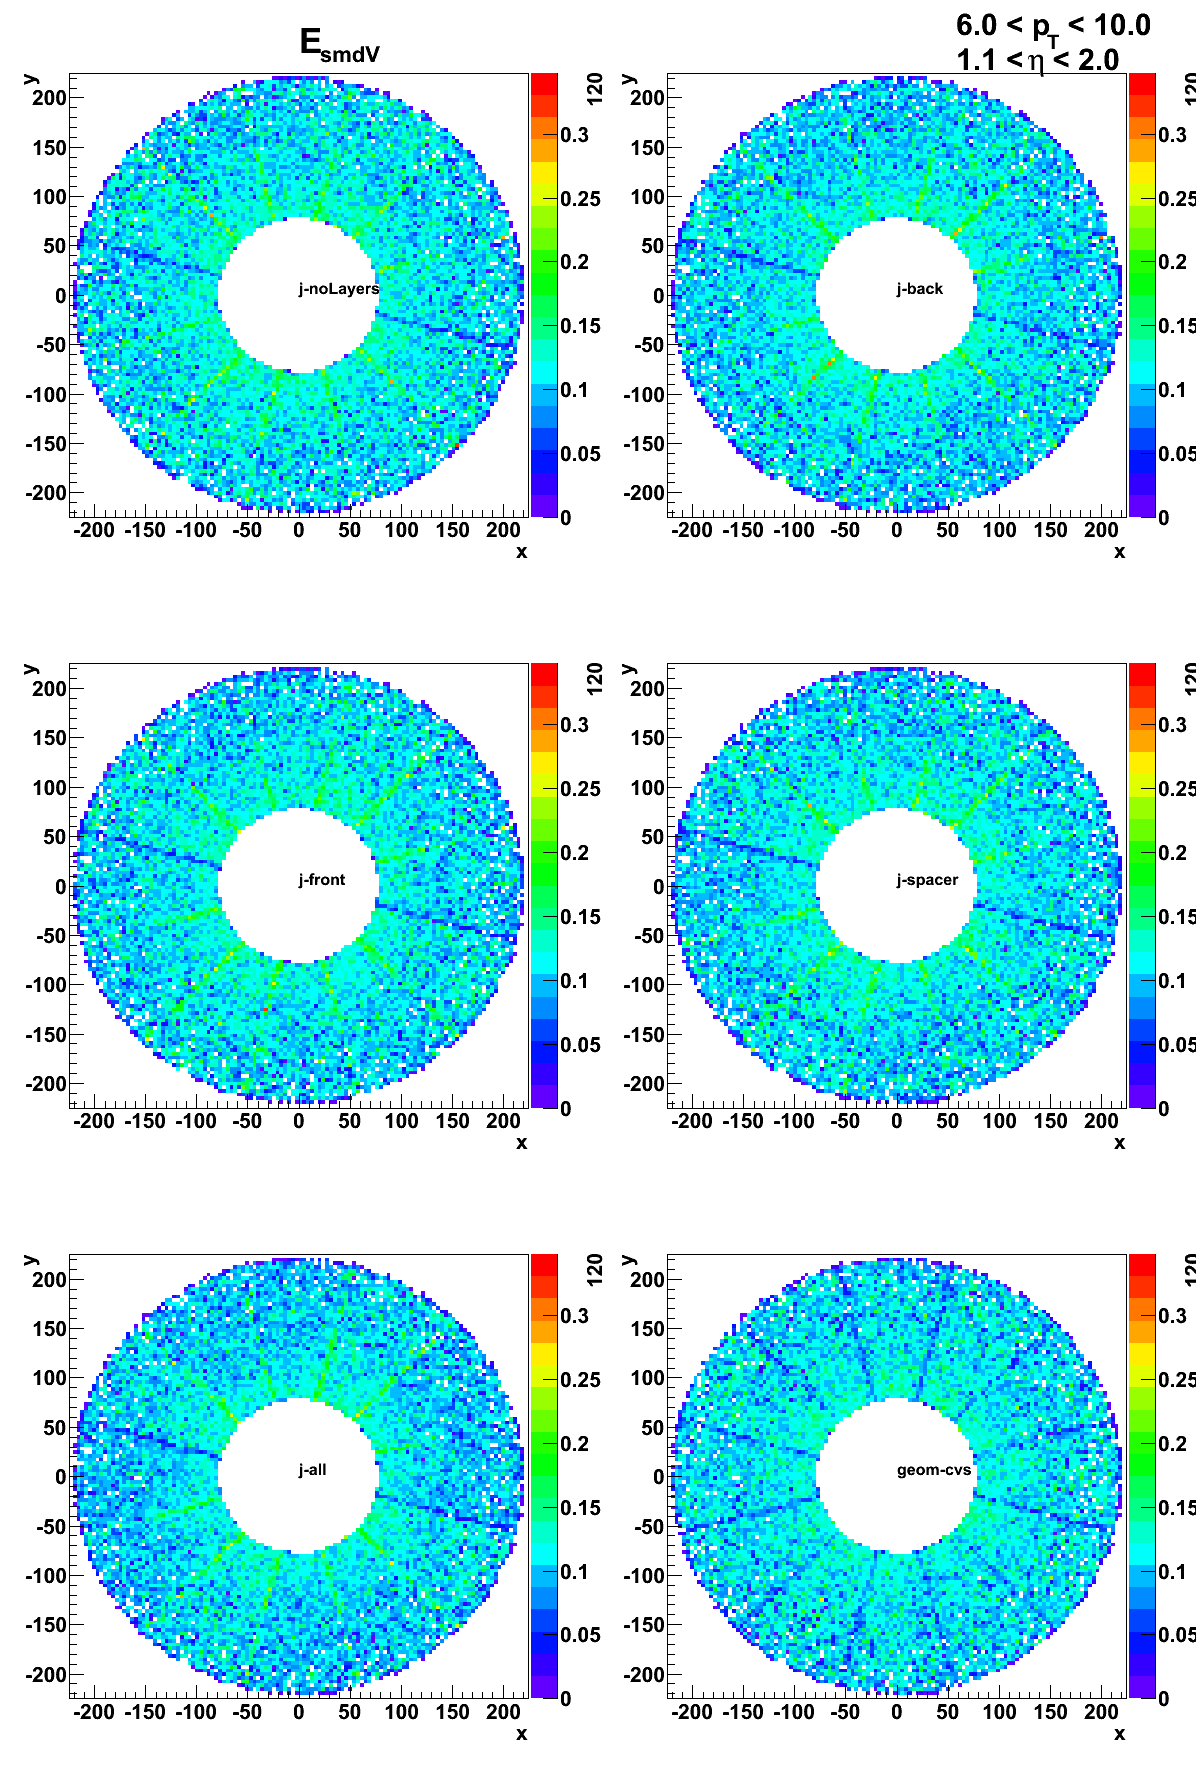
2009.10.16 Jason geometry file: Full STAR simulations
Monte-Carlo setup:
- One photon per event
- EEMC only and Full STAR geometry configurations with LOW_EM option
(using Victor's geometry fix) - Throw particles flat in eta (1.08, 2.0), phi (0, 2pi), and pt (6-10 GeV)
- Using A2Emaker to get reconstructed Tower/SMD energy
(no EEMC SlowSimulator in chain) - Vertex z=0
- ~50K/per particle type
- Non-zero energy: 3 sigma above pedestal
Geometry configurations and notations (shown in the center of the plot):
- eemc-cvs: EEMC only with geometry file from CVS (cAir-fixed)
- full-cvs: Full STAR with geometry file from CVS (cAir-fixed)
- eemc-j: EEMC only with Jason geometry file
- full-j: Full STAR with Jason geometry file
Figure 1: Sampling fraction
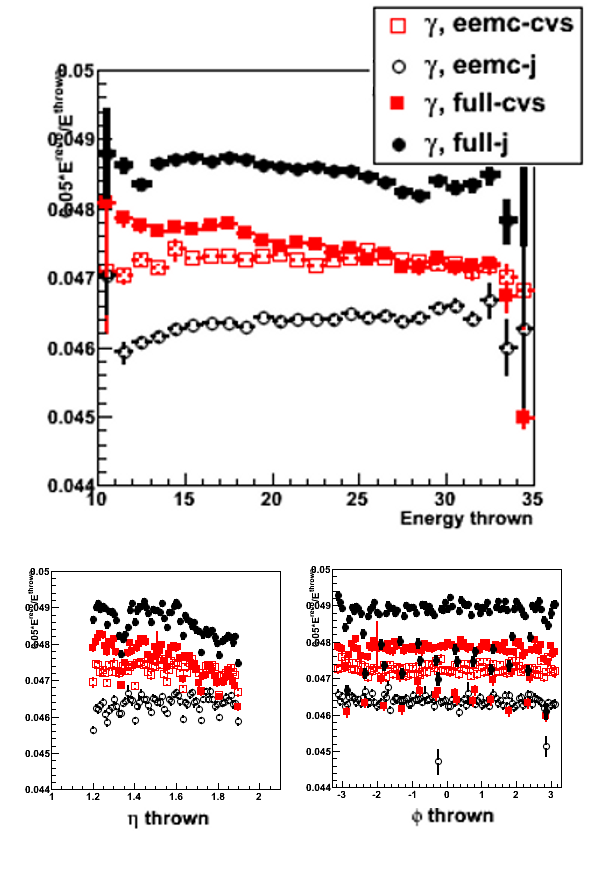
Figure 2: Total energy distribution
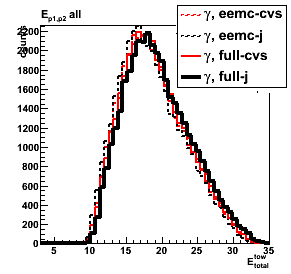
Figure 3: Shower shapes (left) and shape ratios (right) for 0 < pre-shower1 < 4MeV
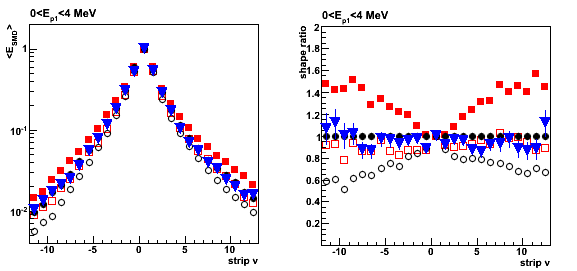
Pre-shower sorted shapes (for completeness)
Figure 4: Shower shapes (all pre-shower bins)
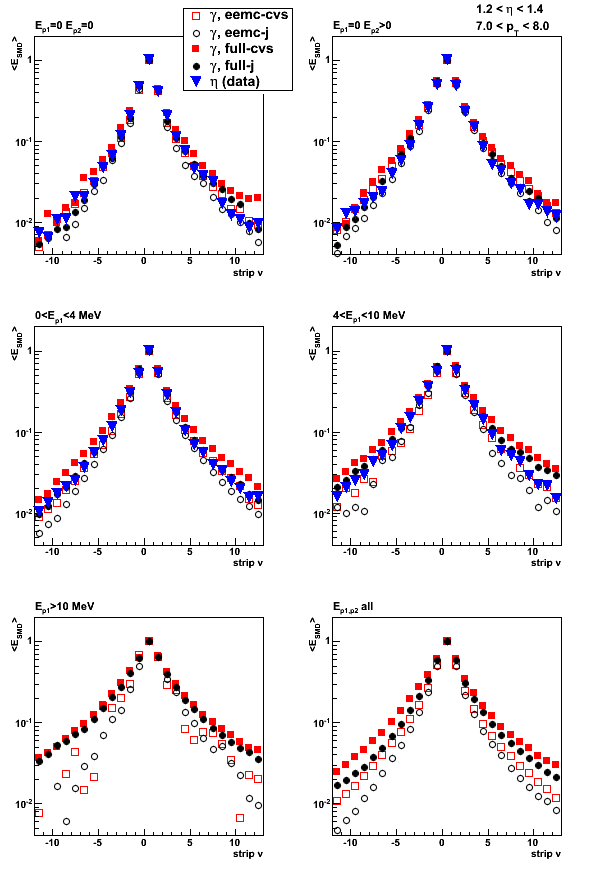
Figure 5: Shower shapes ratio (all pre-shower bins)
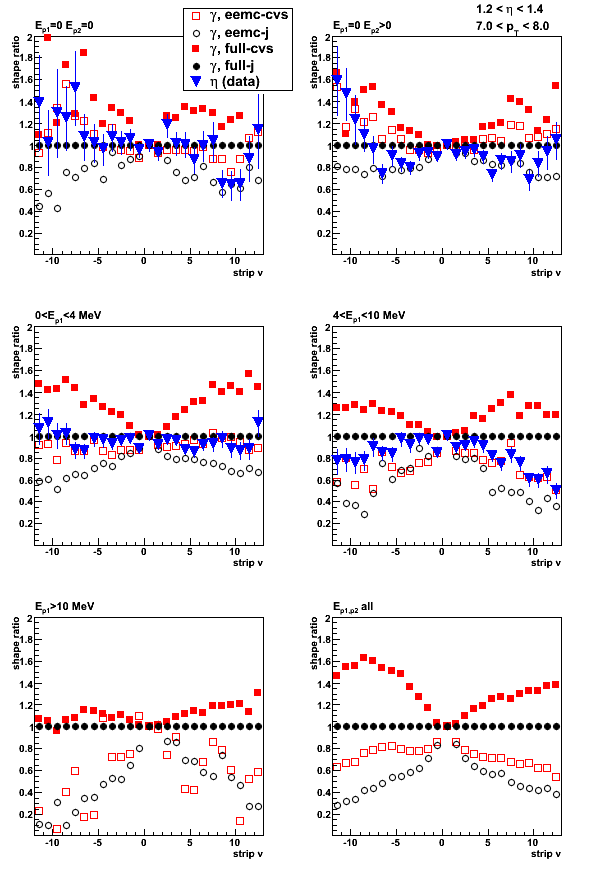
2009.10.20 Sampling fraction problem: full STAr vs. EEMC stand alone geometry
For the previous study click here
Monte-Carlo setup:
- One photon per event
- EEMC only and Full STAR geometry configurations with LOW_EM option
(using Victor's geometry fix) - Throw particles flat in eta (1.08, 2.0), phi (0, 2pi), and pt (6-10 GeV)
- Using A2Emaker to get reconstructed Tower/SMD energy
(no EEMC SlowSimulator in chain) - Vertex z=0
- ~50K/per particle type
- Non-zero energy: 3 sigma above pedestal
Geometry configurations and notations (shown in the center of the plot):
- eemc-cvs: EEMC only with geometry file from CVS (cAir-fixed)
- full-cvs: Full STAR with geometry file from CVS (cAir-fixed)
- eemc-j: EEMC only with Jason geometry file
- full-j: Full STAR with Jason geometry file
Figure 1: Average energy in SMD-u plane vs. position of the thrown photon

SMD v (left) and u (right) sampling fraction (E_smd/E_thrown) vs. E_thrown
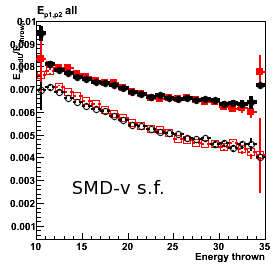
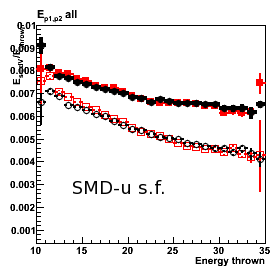
Figure 2: Sampling fraction (E_tower^total/E_thrown) vs. position of the thrown photon
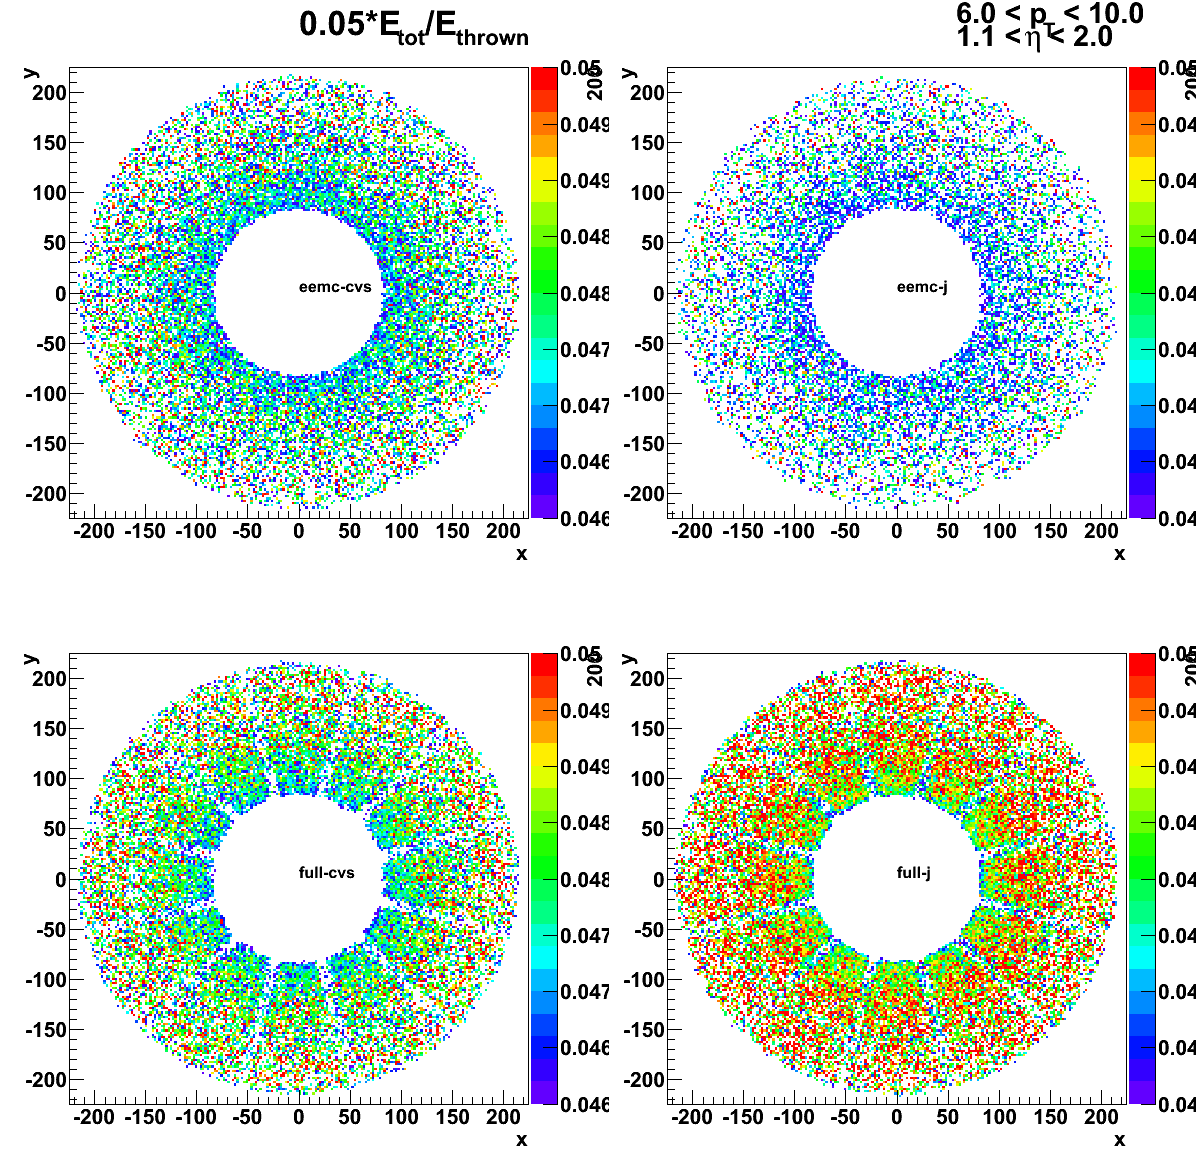
Sampling fraction (E_tower^total/E_thrown) vs. E_thrown
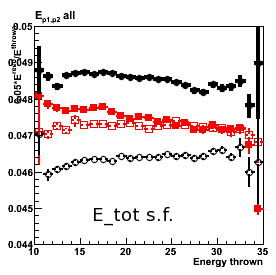
Figure 3: Number of towers above threshold vs. position of the thrown photon
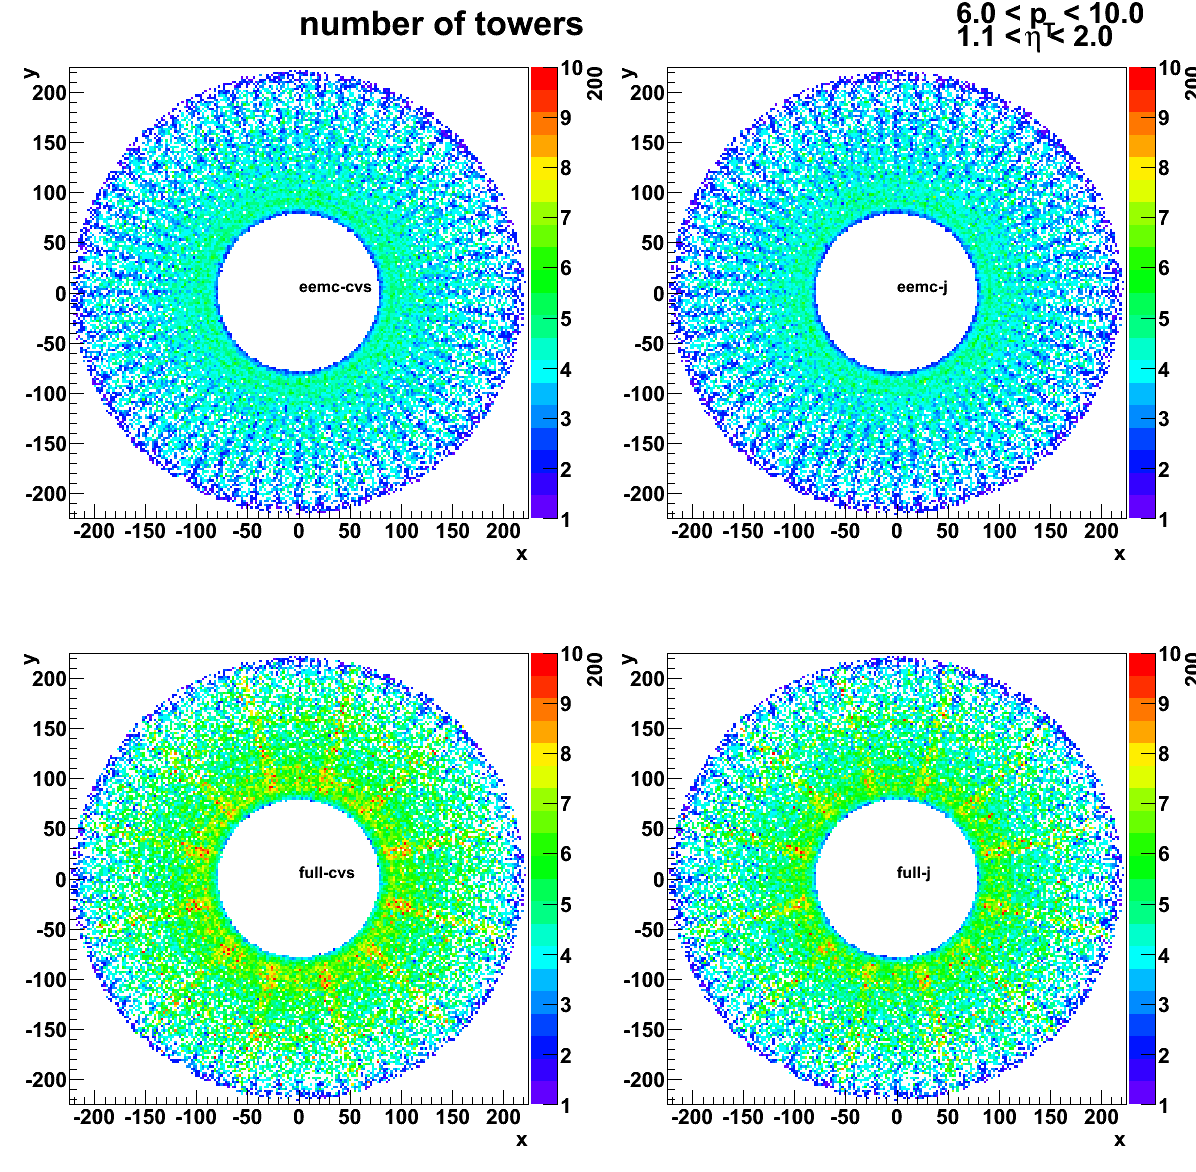
Number of towers above threshold vs. E_thrown
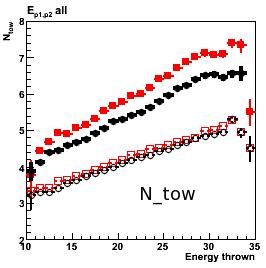
Other EEMC layers: pre-shower, postshower
Figure 4: (left) Pre-shower1 and (right) Pre-shower2 sampling fraction vs. E_thrown
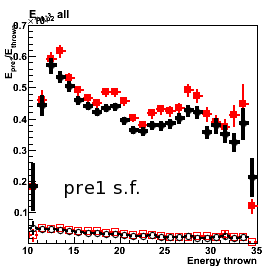
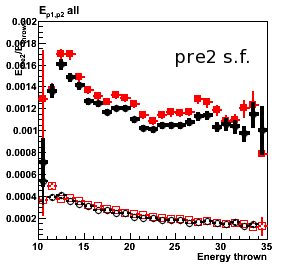
Figure 5: (left) High tower sampling fraction and (right) residual energy, [E_tot-E_3x3]/E_thrown, vs. E_thrown
![]()
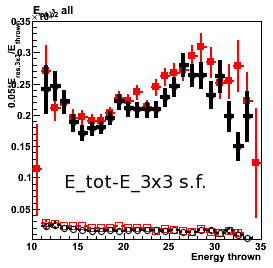
2009.10.26 Jason vs. CVS EEMC: removed SMD layers
Monte-Carlo setup:
- One photon per event
- Disabled new SMD layers (EXPS EBLS EFLS) in Jason geometry
- EEMC only and Full STAR geometry configurations with LOW_EM option
Note: LOW_EM option seems not to work for EEMC only configuration (double checking)
(using Victor's geometry fix) - Throw particles flat in eta (1.08, 2.0), phi (0, 2pi), and pt (6-10 GeV)
- Using A2Emaker to get reconstructed Tower/SMD energy
(no EEMC SlowSimulator in chain) - Vertex z=0
- ~50K/per particle type
- Non-zero energy: 3 sigma above pedestal
Geometry configurations and notations (shown in the center of the plot):
- eemc-cvs: EEMC only with geometry file from CVS (cAir-fixed)
- full-cvs: Full STAR with geometry file from CVS (cAir-fixed)
- eemc-j-noL: EEMC only with Jason geometry file (disabled 3-new SMD layers)
- full-j-noL: Full STAR with Jason geometry file (disabled 3-new SMD layers)
Figure 1: number of post-shower tiles
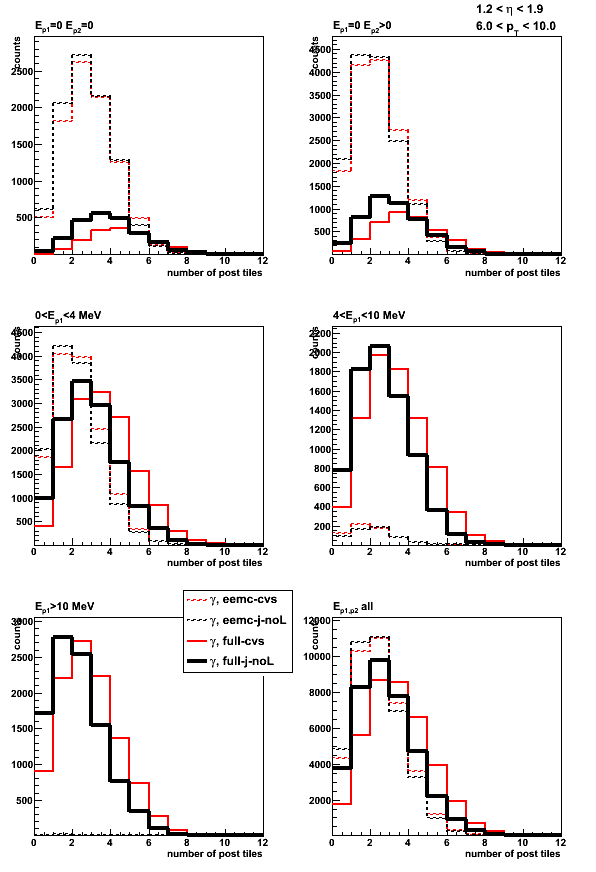
Figure 2: number of pre-1-shower tiles
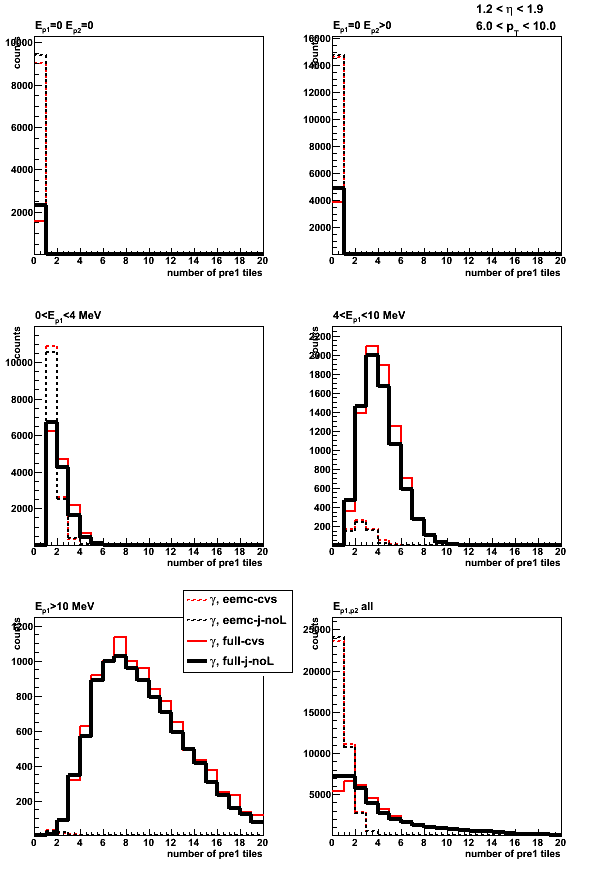
Figure 3: number of pre-2-shower tiles
Figure 4: number of towers
2D
Figure 5: Average pre-shower1 energy
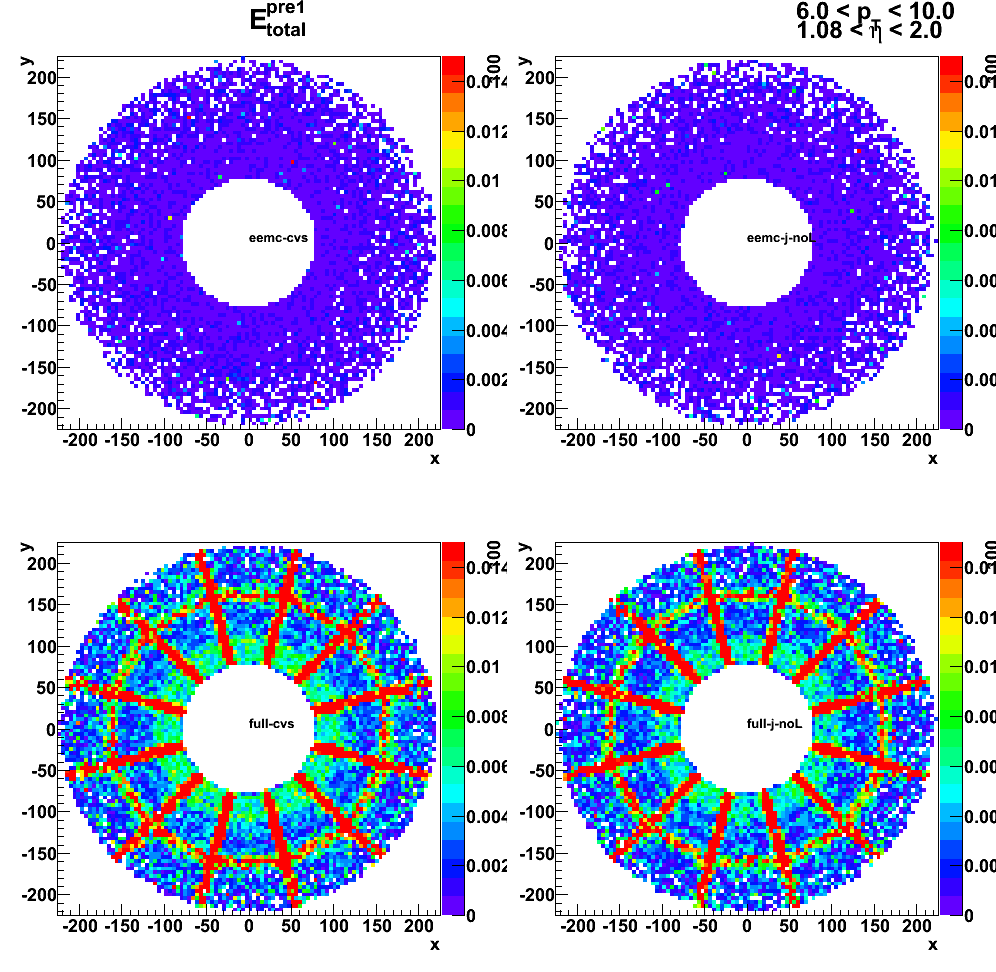
Figure 6: Average pre-shower2 energy
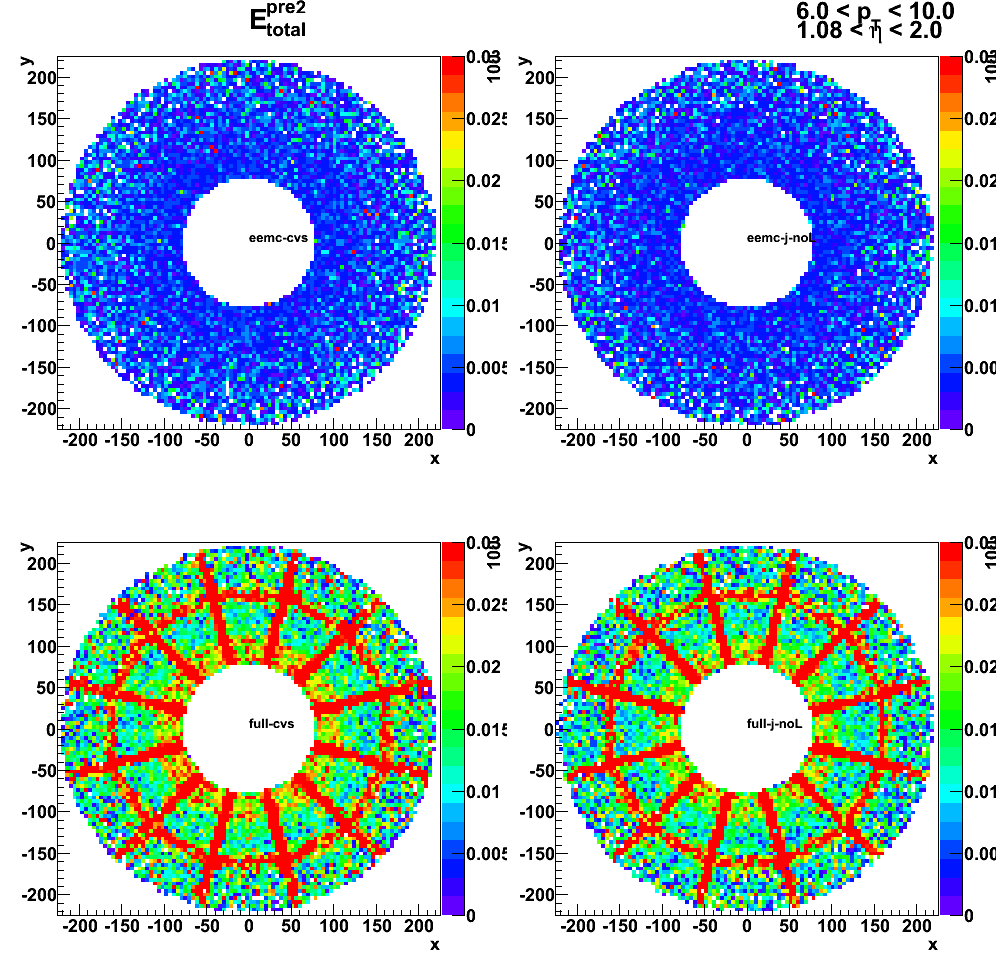
Figure 7: Average number of SMD-u strips

Figure 8: Average number of SMD-v strips
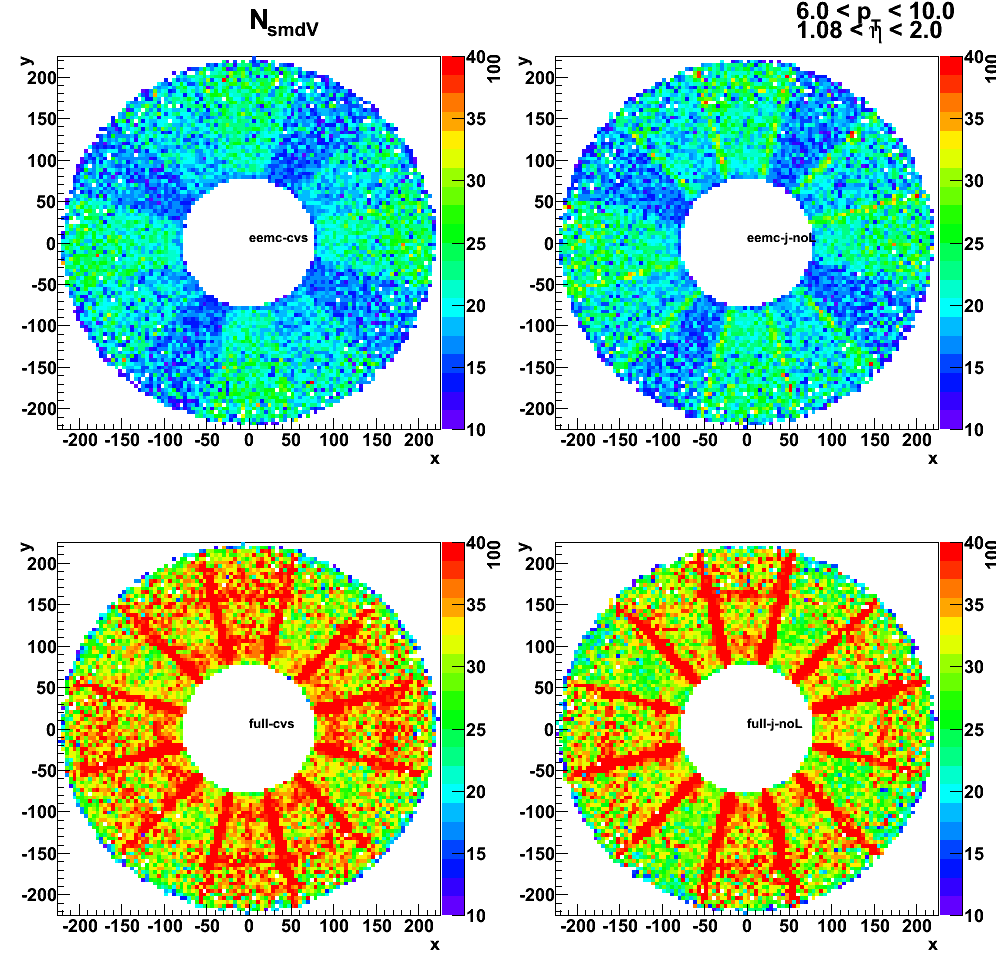
Figure 9: Average post-shower energy
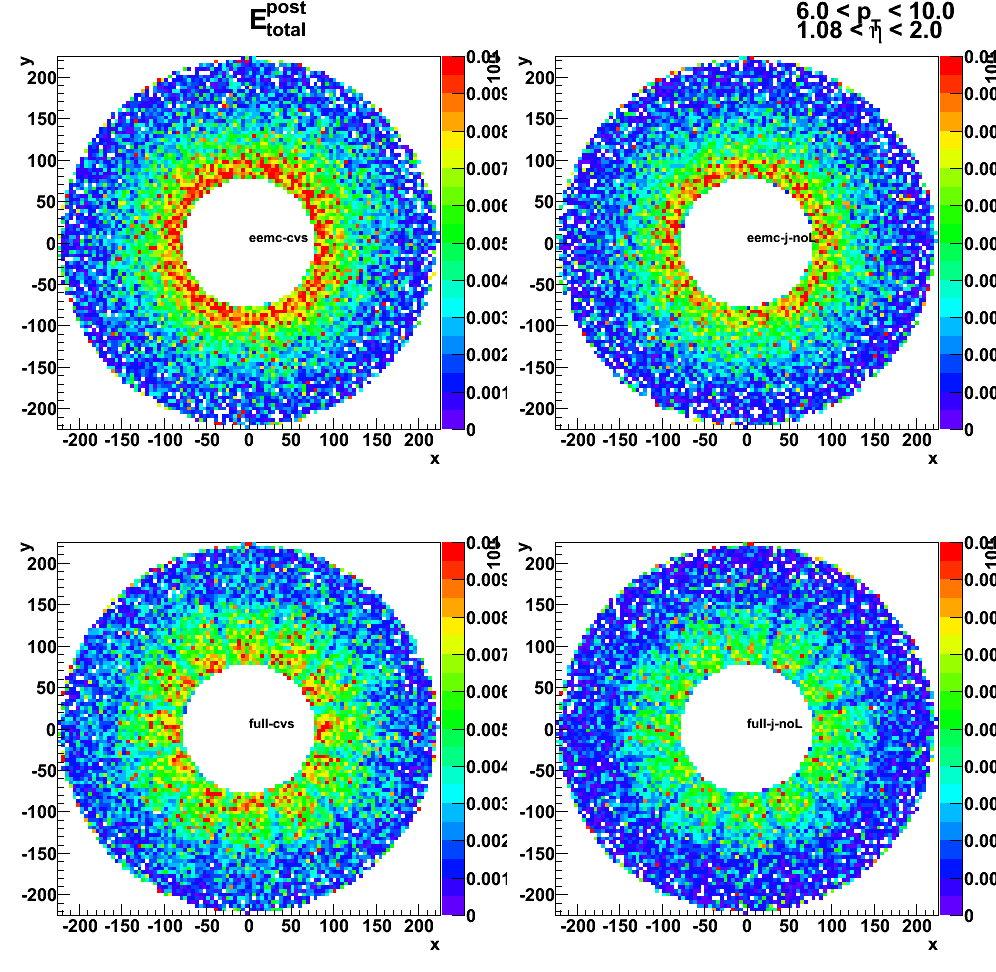
Sampling fraction
Figure 10: Sampling fraction 1x1 vs. thrown energy
![]()
Figure 11: Sampling fraction 2x1 vs. thrown energy
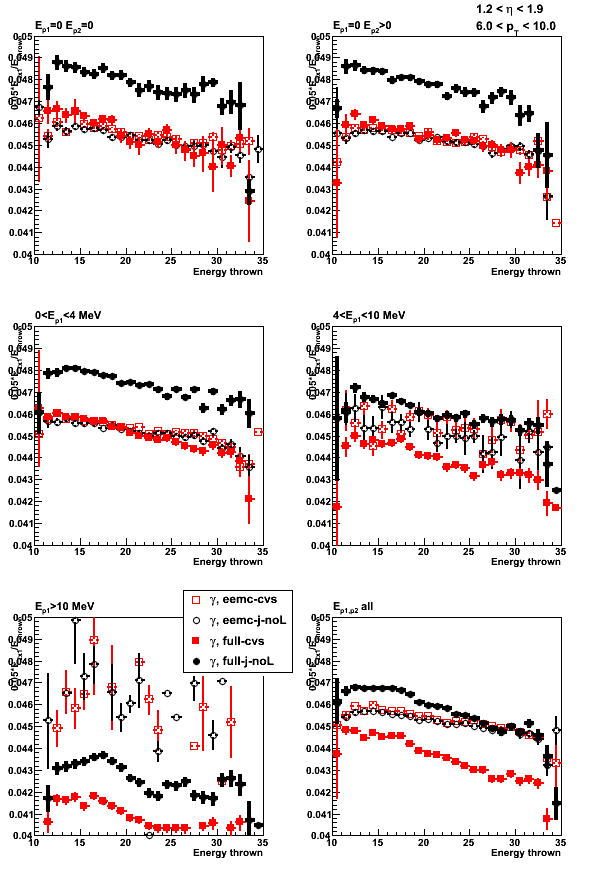
Figure 12: Sampling fraction 3x3 vs. thrown energy

Figure 13: Sampling fraction (total energy) vs. thrown energy
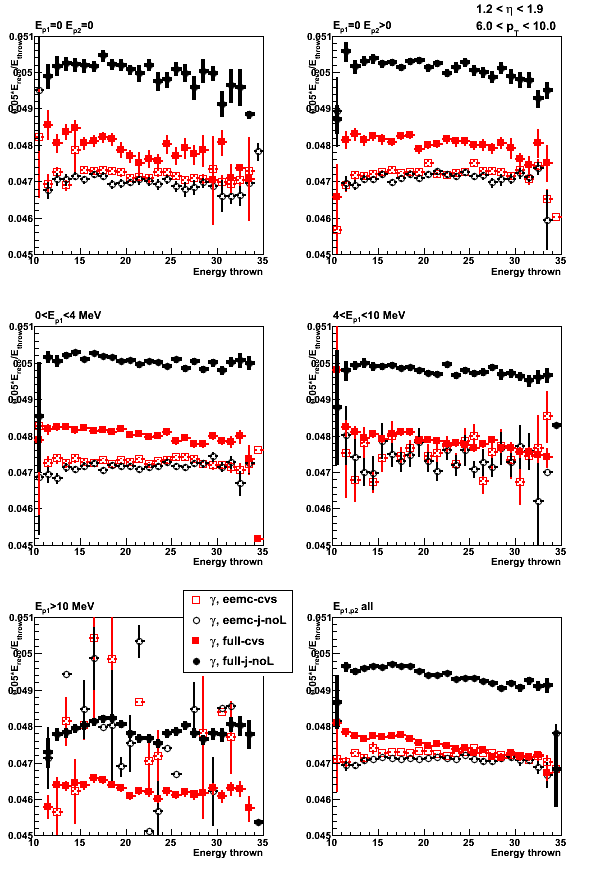
Figure 14: Sampling fraction 1x1
![]()
Figure 15: Sampling fraction 2x1
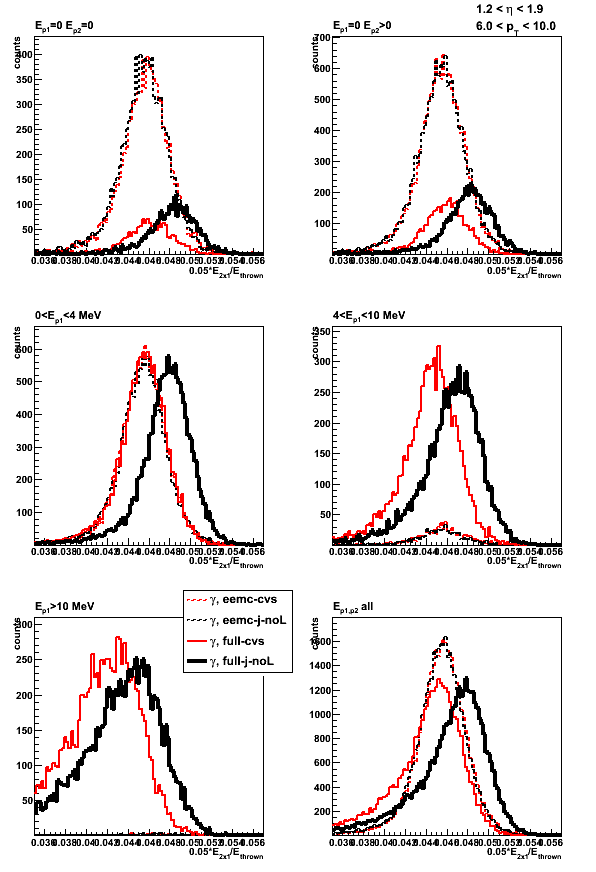
Figure 16: Sampling fraction 3x3

SMD shower shapes
Figure 17: SMD shower shape (v-plane)
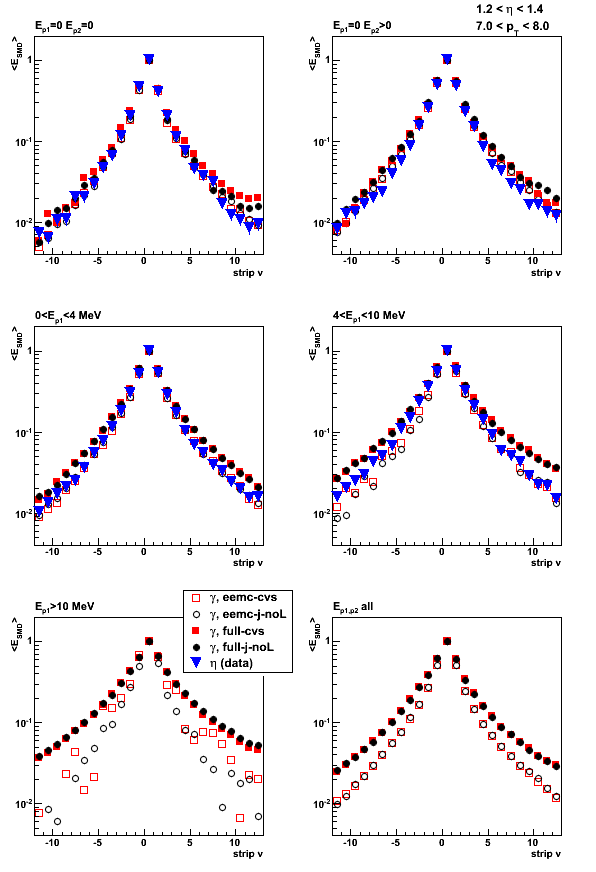
2009.10.27 Jason EEMC geometry: effect of removing new SMD layers
Monte-Carlo setup:
- One photon per event
- Disabled/Enabled new SMD layers (EXPS EBLS EFLS) in Jason geometry
- EEMC only and Full STAR geometry configurations with LOW_EM option
(using Victor's geometry fix) - Throw particles flat in eta (1.08, 2.0), phi (0, 2pi), and pt (6-10 GeV)
- Using A2Emaker to get reconstructed Tower/SMD energy
(no EEMC SlowSimulator in chain) - Vertex z=0
- ~50K/per particle type
- Non-zero energy: 3 sigma above pedestal
Geometry configurations and notations (shown in the center of the plot):
- eemc-j: EEMC only with Jason geometry file
- full-j: Full STAR with Jason geometry file
- eemc-j-noL: EEMC only with Jason geometry file (disabled 3-new SMD layers)
- full-j-noL: Full STAR with Jason geometry file (disabled 3-new SMD layers)
Effect of removing SMD layers on SMD strips
Figure 1: Average number of SMD-u strips
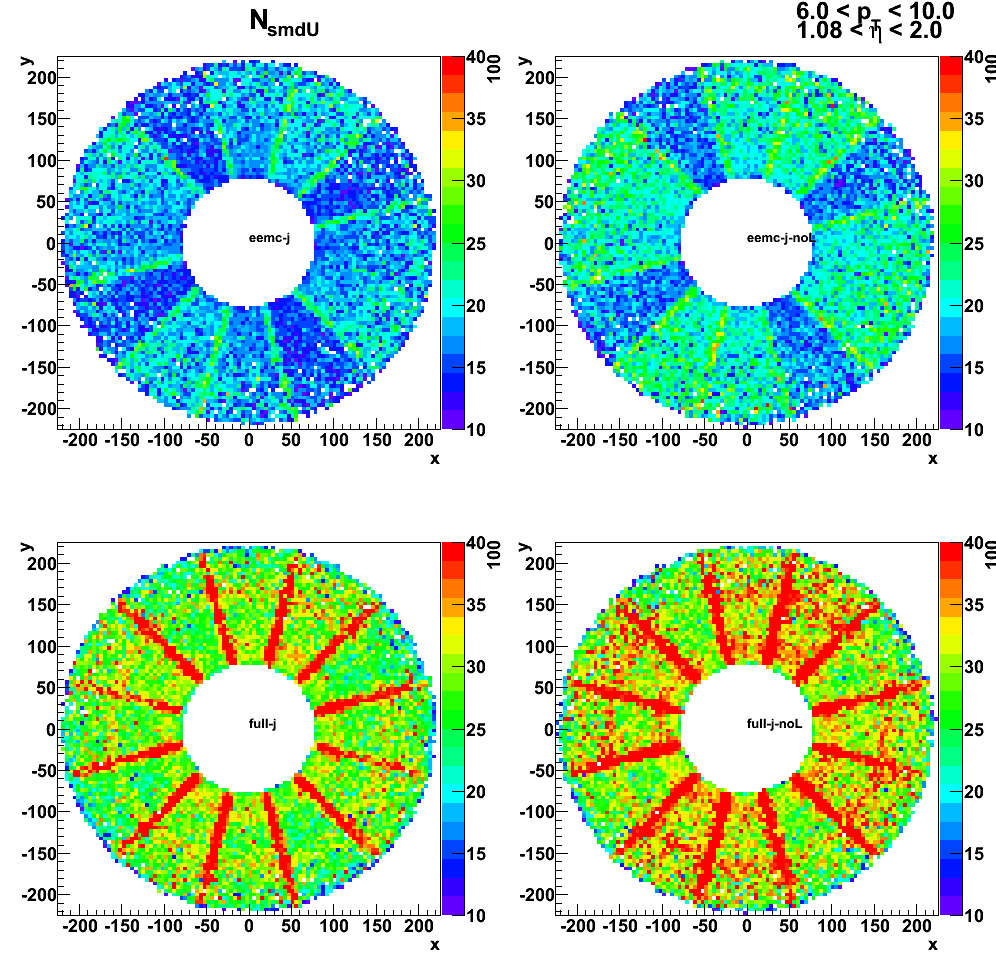
Figure 2: Average number of SMD-v strips
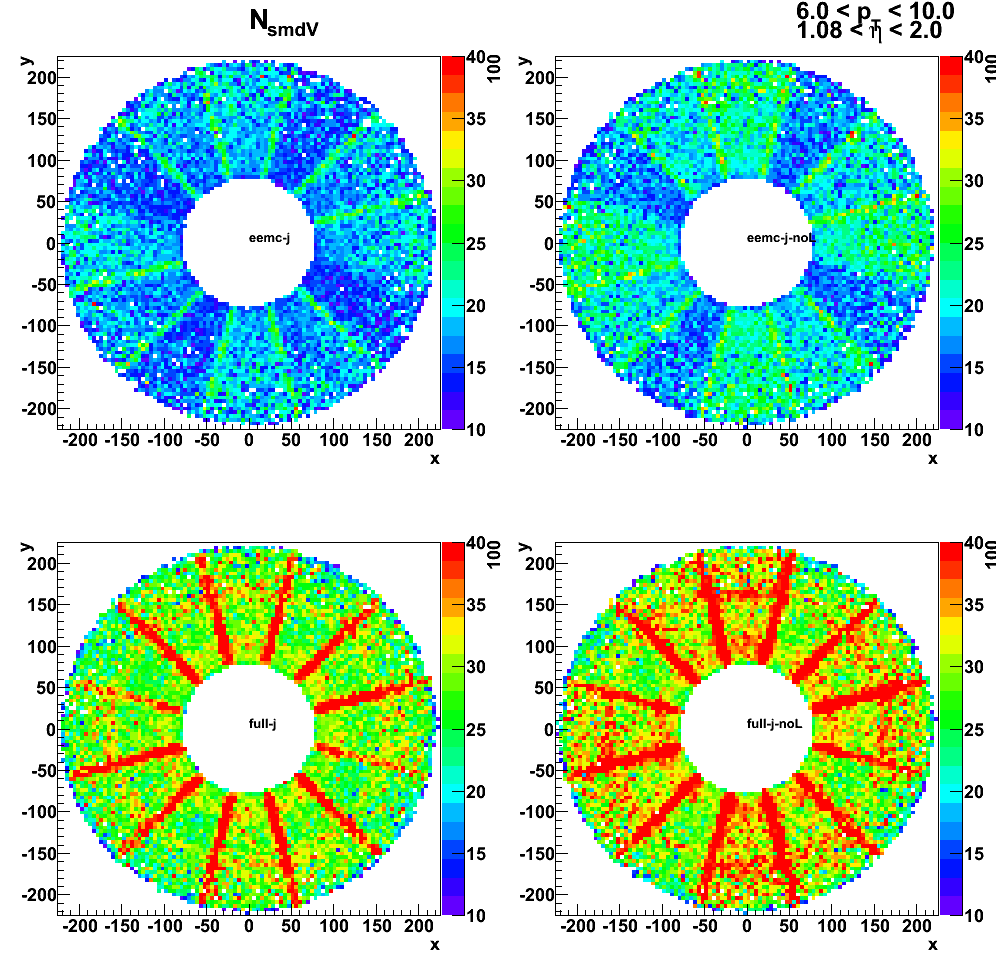
Effect of removing SMD layers on sampling fraction
Figure 3: distribution of 1x1 sampling fraction
![]()
Figure 4: distribution of 2x1 sampling fraction
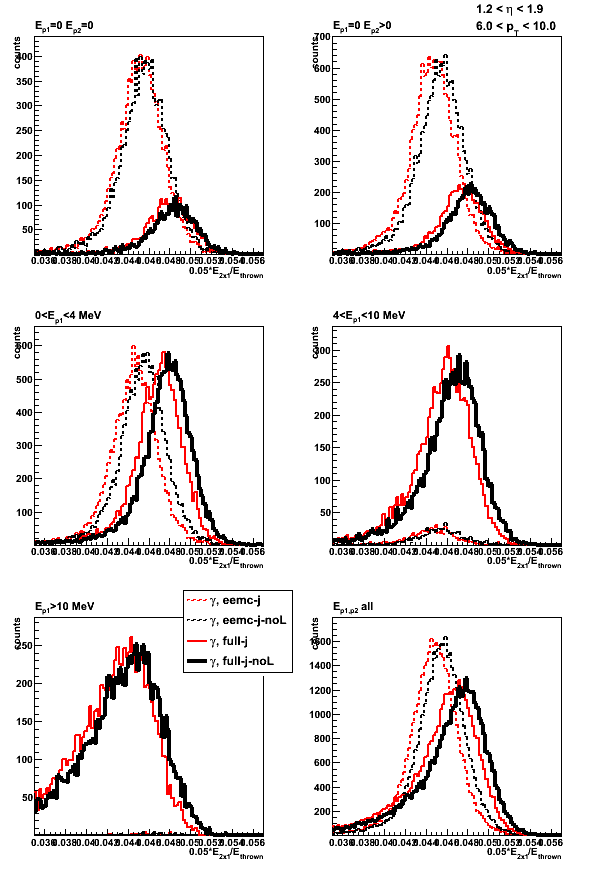
Figure 5: distribution of 3x3 sampling fraction

Figure 6: 1x1 sampling fraction vs. thrown energy
![]()
Figure 7: 2x1 sampling fraction vs. thrown energy
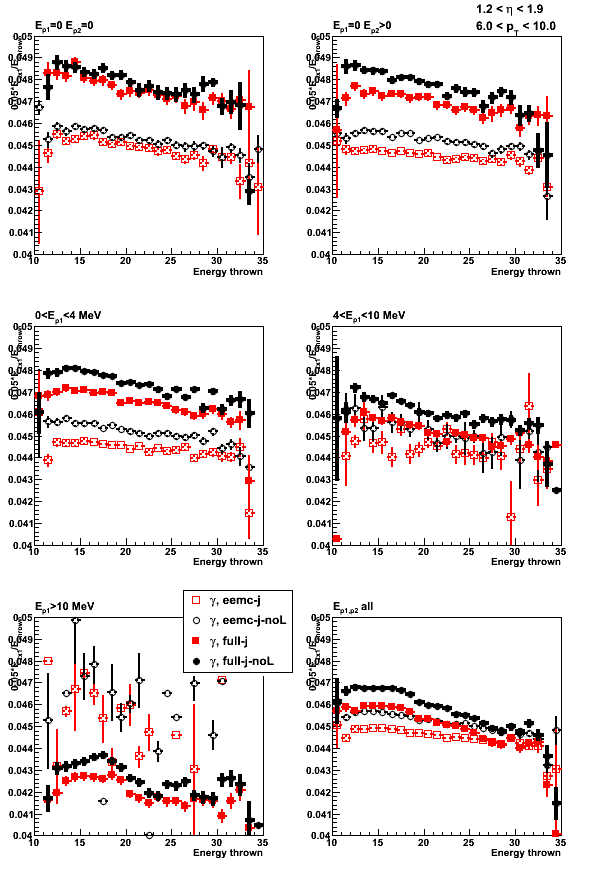
Figure 8: 3x3 sampling fraction vs. thrown energy
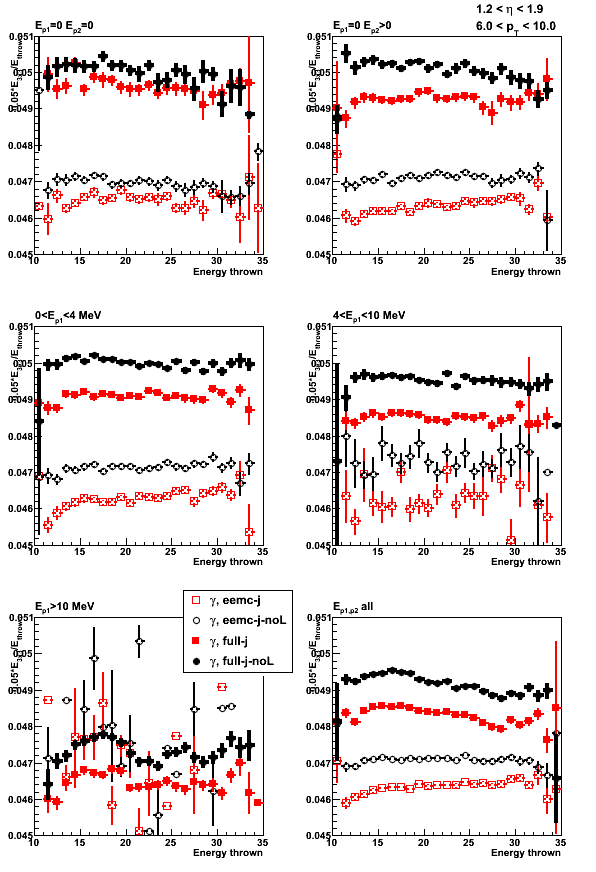
2009.10.27: Jason EEMC geometry: comparison without LOW_EM option
Monte-Carlo setup:
- One photon per event
- Disabled new SMD layers (EXPS EBLS EFLS) in Jason geometry
- EEMC only and Full STAR geometry configurations without LOW_EM option
(using Victor's geometry fix) - Throw particles flat in eta (1.08, 2.0), phi (0, 2pi), and pt (6-10 GeV)
- Using A2Emaker to get reconstructed Tower/SMD energy
(no EEMC SlowSimulator in chain) - Vertex z=0
- ~50K/per particle type
- Non-zero energy: 3 sigma above pedestal
Geometry configurations and notations (shown in the center of the plot):
- eemc-cvs: EEMC only with geometry file from CVS (cAir-fixed)
- full-cvs: Full STAR with geometry file from CVS (cAir-fixed)
- eemc-j-noL: EEMC only with Jason geometry file (disabled 3-new SMD layers)
- full-j-noL: Full STAR with Jason geometry file (disabled 3-new SMD layers)
Figure 1: Sampling fraction 1x1
![]()
Figure 2: Sampling fraction 2x1
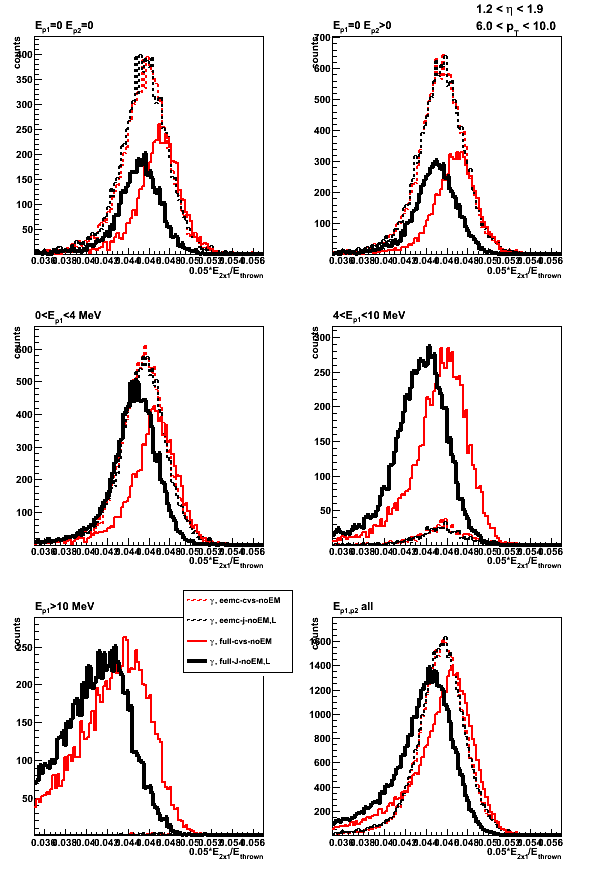
Figure 3: Sampling fraction 3x3
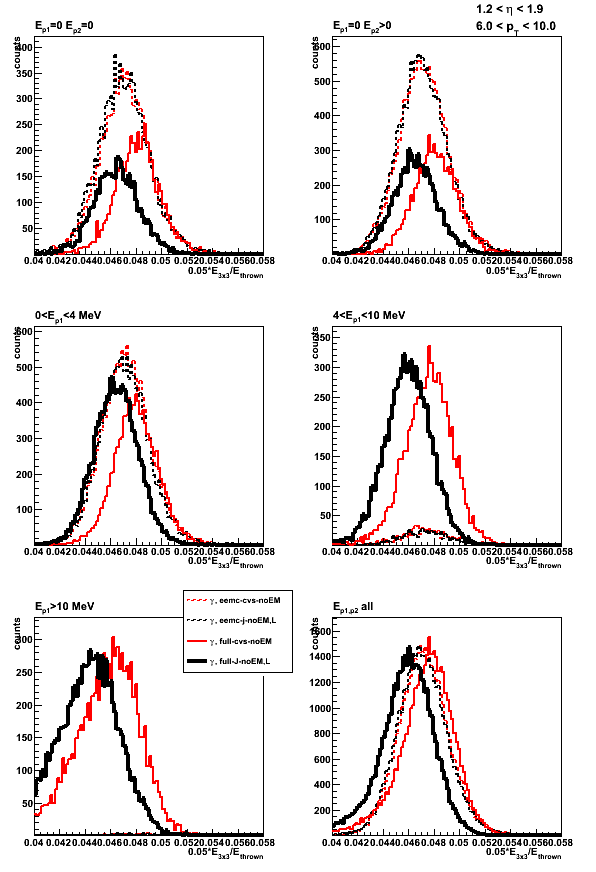
Figure 4: Sampling fraction total energy
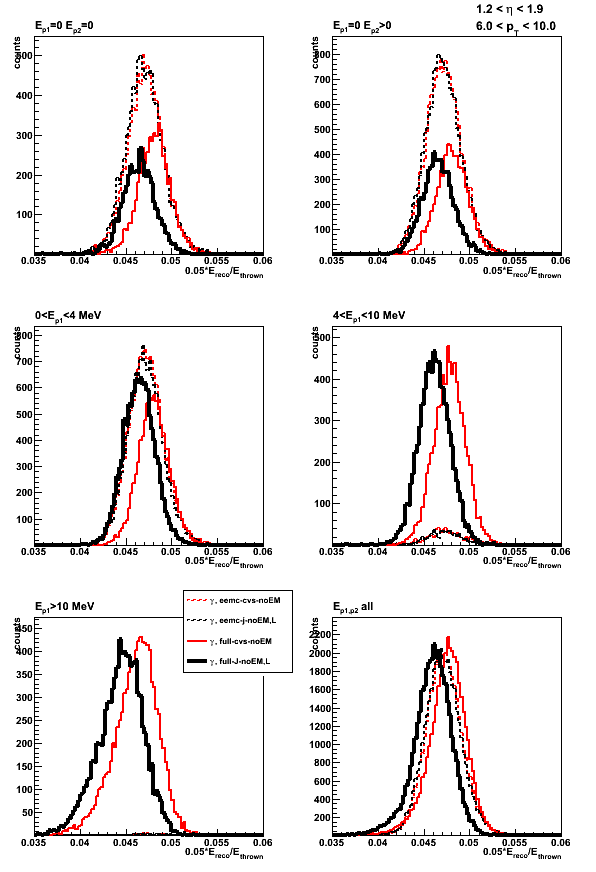
Figure 5: Sampling fraction pre1-shower
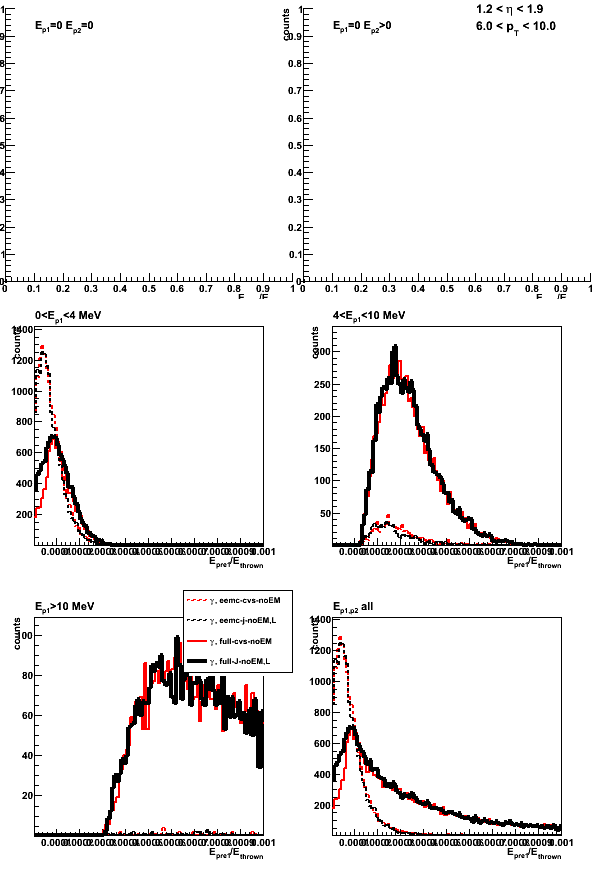
Figure 6: Sampling fraction pre2-shower

Figure 7: Sampling fraction smd-u
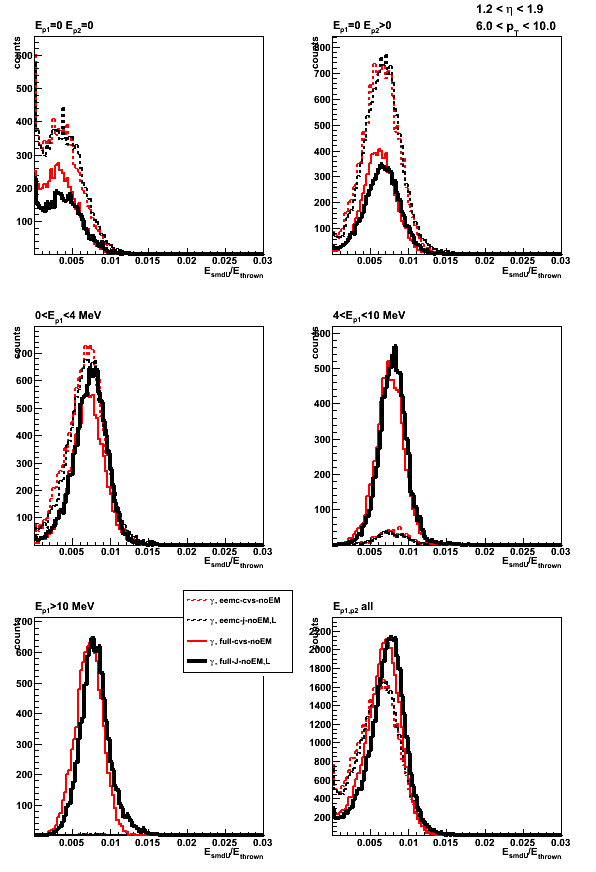
Figure 8: Sampling fraction smd-v
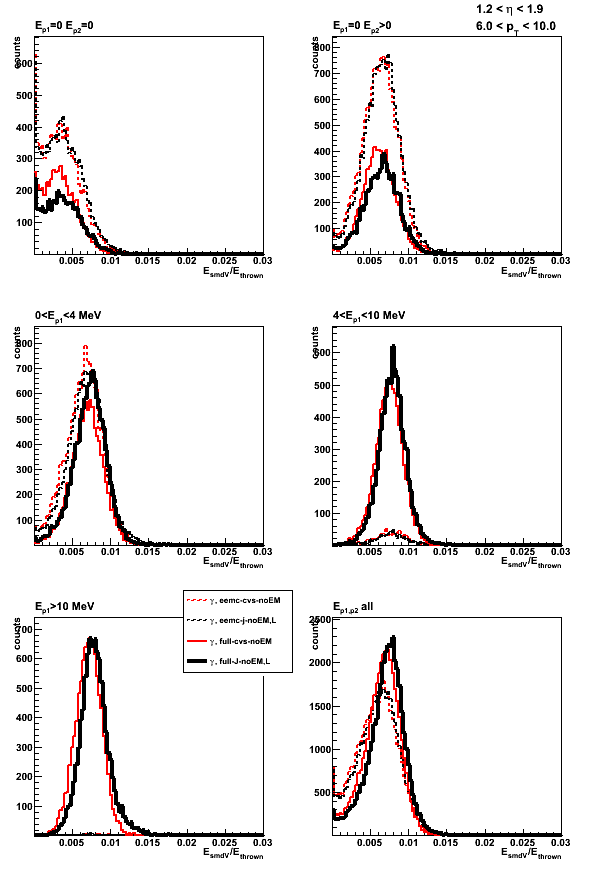
Figure 9: Sampling fraction post-shower
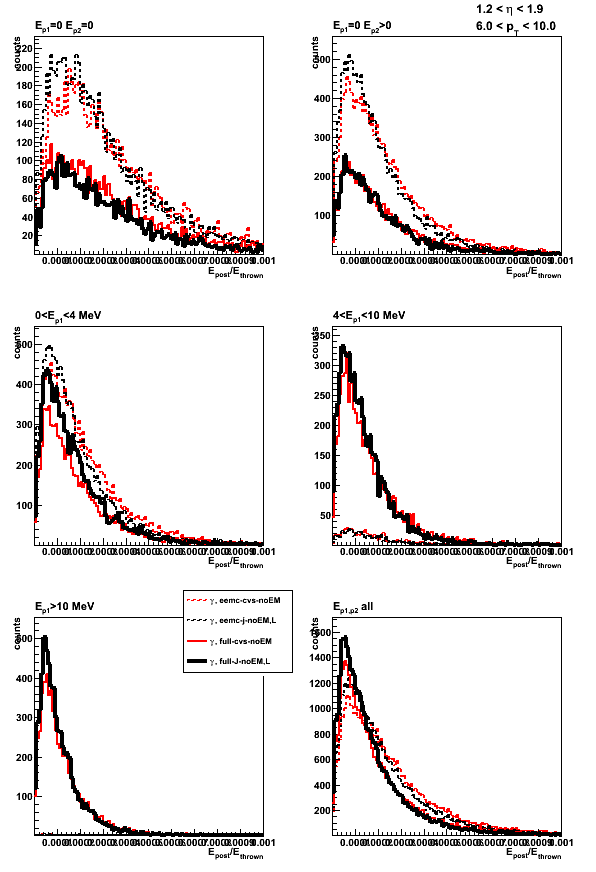
Sampling fraction vs. thrown energy
Figure 10: Sampling fraction 1x1 vs. thrown energy
![]()
Figure 11: Sampling fraction 2x1 vs. thrown energy
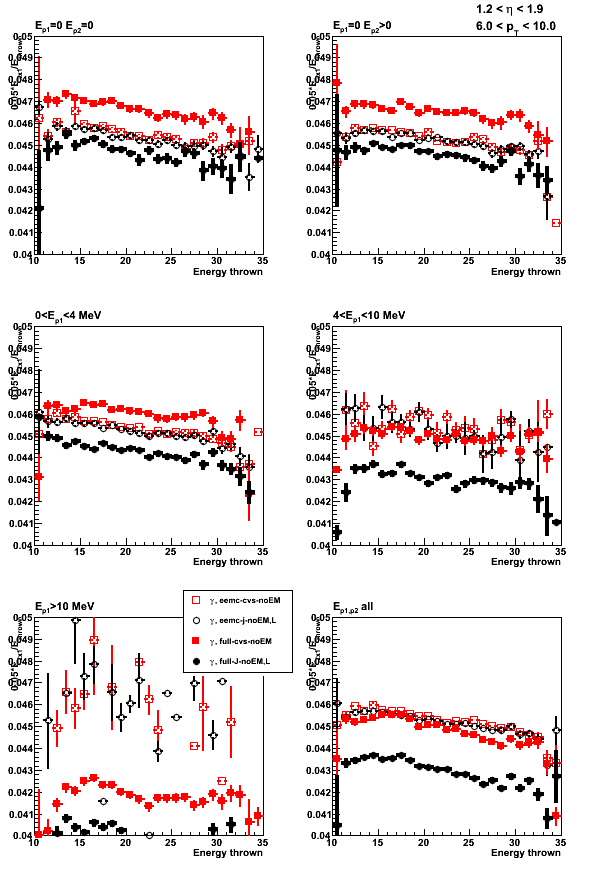
Figure 12: Sampling fraction 3x3 vs. thrown energy
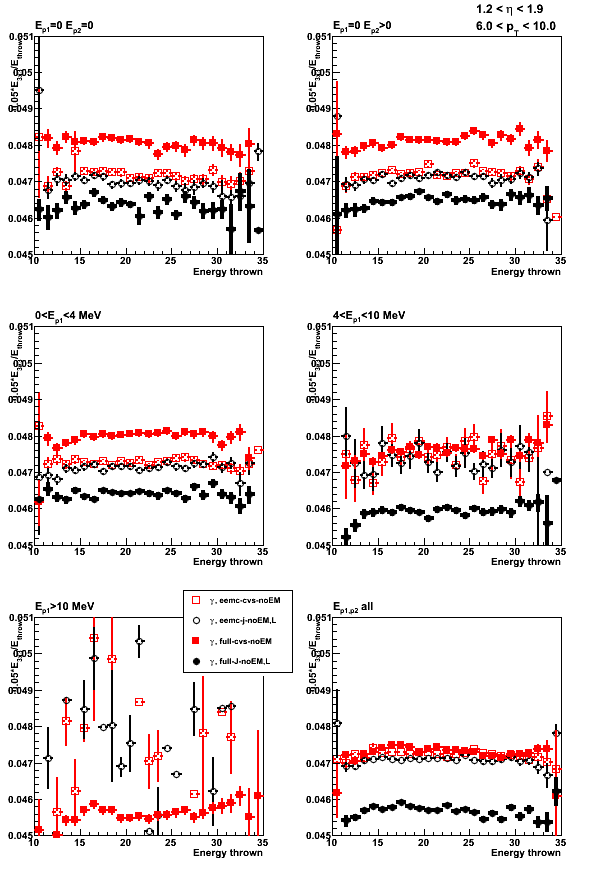
Figure 13: Sampling fraction (tatal energy) vs. thrown energy
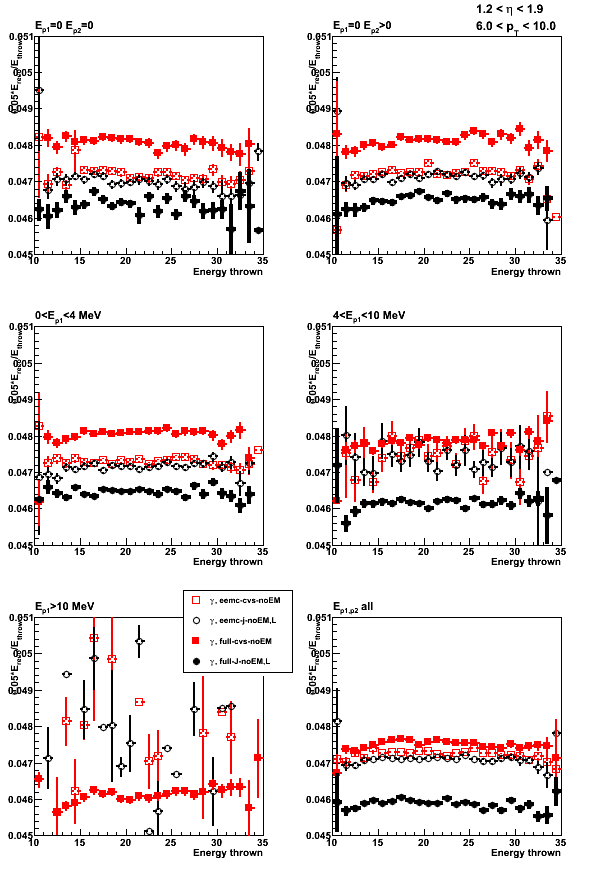
2009.10.30: Jason EEMC geometry: Jason with ELED block from CVS file
FYI: Alice blog on ELED block study
Monte-Carlo setup:
- One photon per event
- Disabled SMD layers (EXPS EBLS EFLS) in Jason geometry
- Put ELED block from CVS file into Jason geometry
geometry configurations without LOW_EM option
(using Victor's geometry fix)- Throw particles flat in eta (1.08, 2.0), phi (0, 2pi), and pt (6-10 GeV)
- Using A2Emaker to get reconstructed Tower/SMD energy
(no EEMC SlowSimulator in chain) - Vertex z=0
- ~50K/per particle type
- Non-zero energy: 3 sigma above pedestal
Geometry configurations and notations (shown in the center of the plot):
- full-cvs: Full STAR with geometry file from CVS (cAir-fixed)
- full-j: EEMC only with Jason geometry file (disabled 3-new SMD layers, ELED block replaced with that from CVS)
Figure 1: Sampling fraction 1x1 (up-left), 2x1 (up-right), 3x3 (low-left), total energy (low-right)
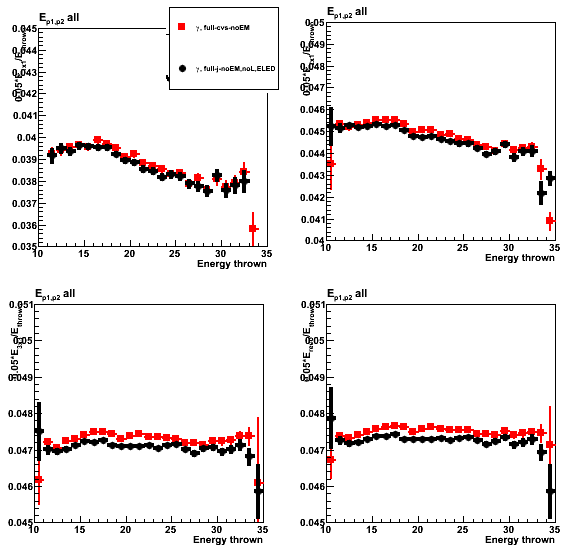
Figure 2: Sampling fraction pre1 (up-left), pre2 (up-right), SMD-u (low-left), post (low-right)

Figure 3: Shower shapes (left) and shower shape ratio (right)

11 Nov
November 2009 posts
2009.11.02 Jason EEMC geometry: results with and without LOW_EM options
Monte-Carlo setup:
- One photon per event
- Disabled SMD layers (EXPS EBLS EFLS) in Jason geometry
geometry configurations with and without LOW_EM option
(using Victor's geometry fix)- Throw particles flat in eta (1.08, 2.0), phi (0, 2pi), and pt (6-10 GeV)
- Using A2Emaker to get reconstructed Tower/SMD energy
(no EEMC SlowSimulator in chain) - Vertex z=0
- ~50K/per particle type
- Non-zero energy: 3 sigma above pedestal
Geometry configurations and notations (shown in the center of the plot):
- full-cvs-noEM (dashed): CVS geometry (cAir-fixed) without LOW_EM option
- full-cvs-EM (solid): CVS geometry (cAir-fixed) with LOW_EM option
- full-j-NoEM-noL: Jason geometry (disabled 3-new SMD layers) without LOW_EM option
- full-j-EM-noL: Jason geometry (disabled 3-new SMD layers) with LOW_EM option
Figure 1: Distribution of the sampling fraction (total energy in EEMC)
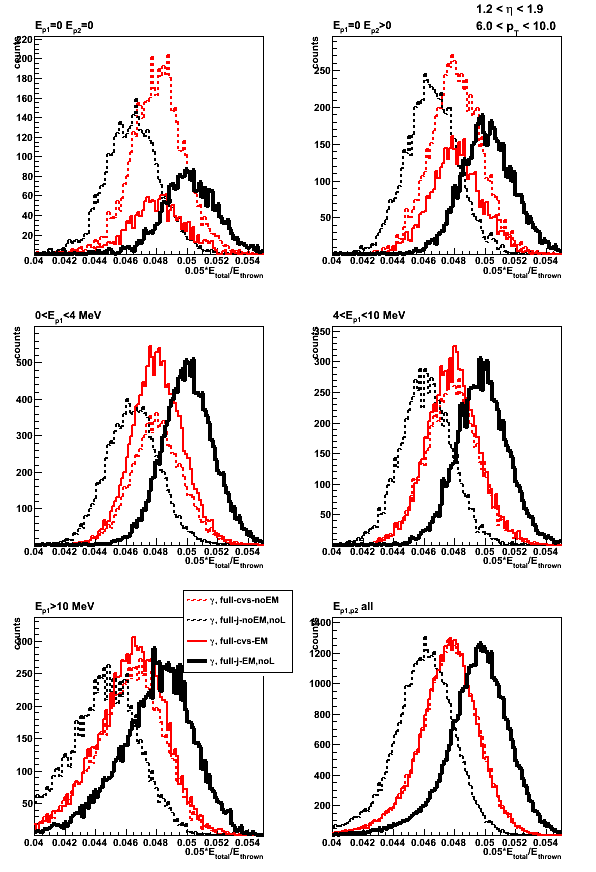
Figure 2: Sampling fraction (total energy in EEMC) vs. thrown energy

Figure 3: Sampling fraction (total energy in EEMC) vs. position of the thrown photon
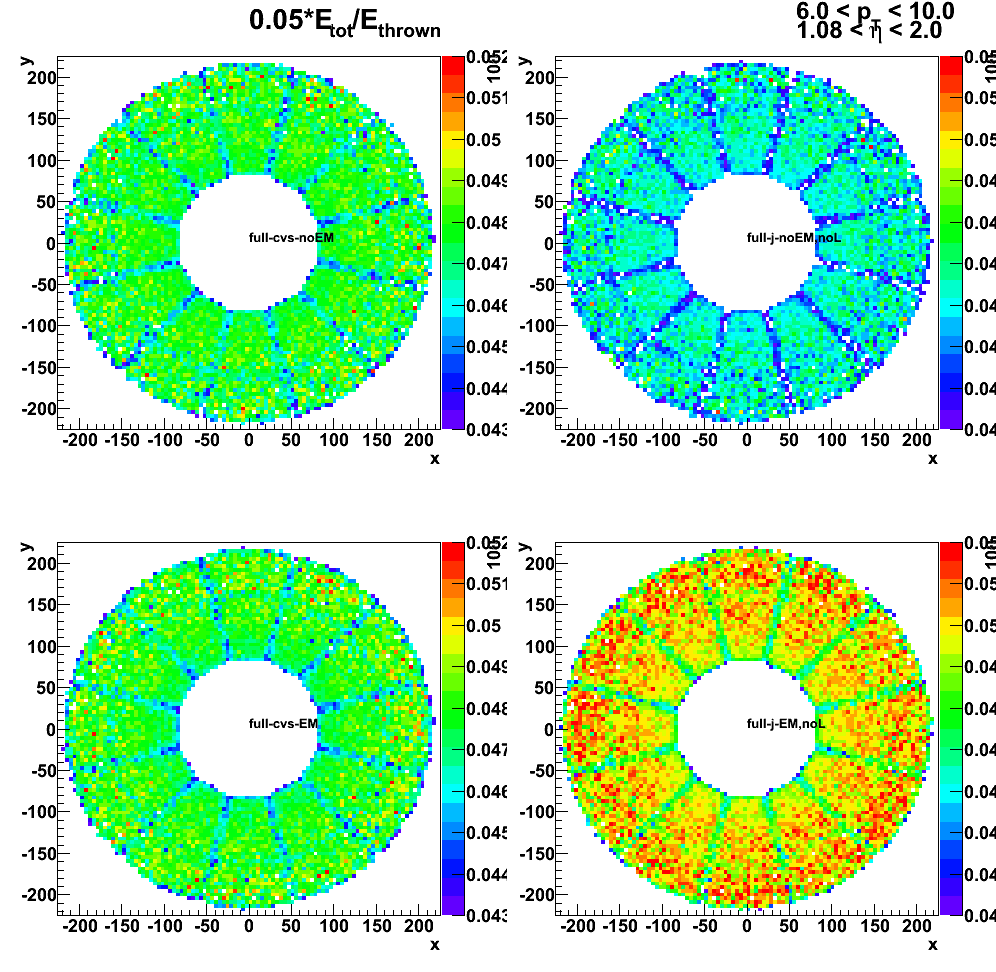
2009.11.03 BEMC sampling fraction: with and without LOW_EM option
Monte-Carlo setup:
- Throwing one photon per event
- Full STAR geometry (y2006g) configurations with and without LOW_EM option.
Note: LOW_EM cuts are listed at the bottom of this page,
and some related discussion can be found in this phana thread - Throw particles flat in eta (-1,1), phi (0, 2pi), and energy (30 +/- 0.5 GeV)
- Vertex z=0
- 50K/per particle type
Geometry configurations and notations:
- BEMC-noLOW_EM: Full STAR y2006g without LOW_EM option
- BEMC-LOW_EM: Full STAR y2006g with LOW_EM option
data base settings (same settings in bfc.C (Jan's trick) and in my MuDst reader):
dbMk->SetFlavor("sim","bemcPed");
dbMk->SetFlavor("Wbose","bemcCalib");
dbMk->SetFlavor("sim","bemcGain");
dbMk->SetFlavor("sim","bemcStatus");
dbMk->SetFlavor("sim","bprsPed");
dbMk->SetFlavor("Wbose","bprsCalib");
dbMk->SetFlavor("sim","bprsGain");
dbMk->SetFlavor("sim","bprsStatus");
dbMk->SetFlavor("sim","bsmdePed");
dbMk->SetFlavor("Wbose","bsmdeCalib");
dbMk->SetFlavor("sim","bsmdeGain");
dbMk->SetFlavor("sim","bsmdeStatus");
dbMk->SetFlavor("sim","bsmdpPed");
dbMk->SetFlavor("Wbose","bsmdpCalib");
dbMk->SetFlavor("sim","bsmdpGain");
dbMk->SetFlavor("sim","bsmdpStatus");
Note: for BEMC ideal pedSigma set to 0, so effectively
there is no effect when I apply 3-sigma threshold above pedestal.
Figure 1: E_reco/E_thrown distribution.
E_reco is the total energy in the BEMC towers from mMuDstMaker->muDst()->muEmcCollection()
E_thrown energy of the thrown photon from tne GEant record
No cut (yet) applied to exclude otliers in the average
Outliers in E_reco/E_thrown
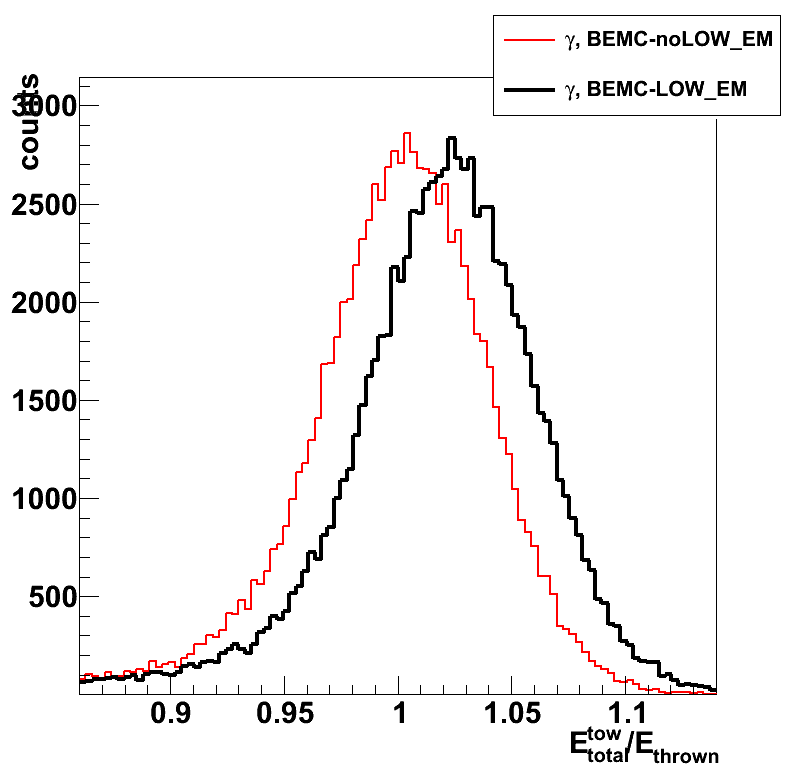
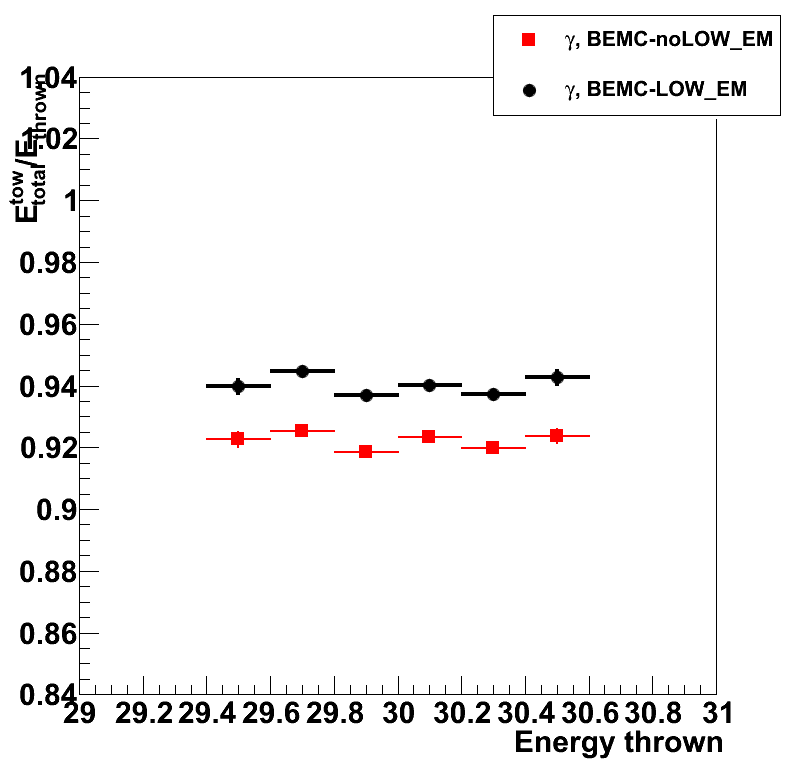
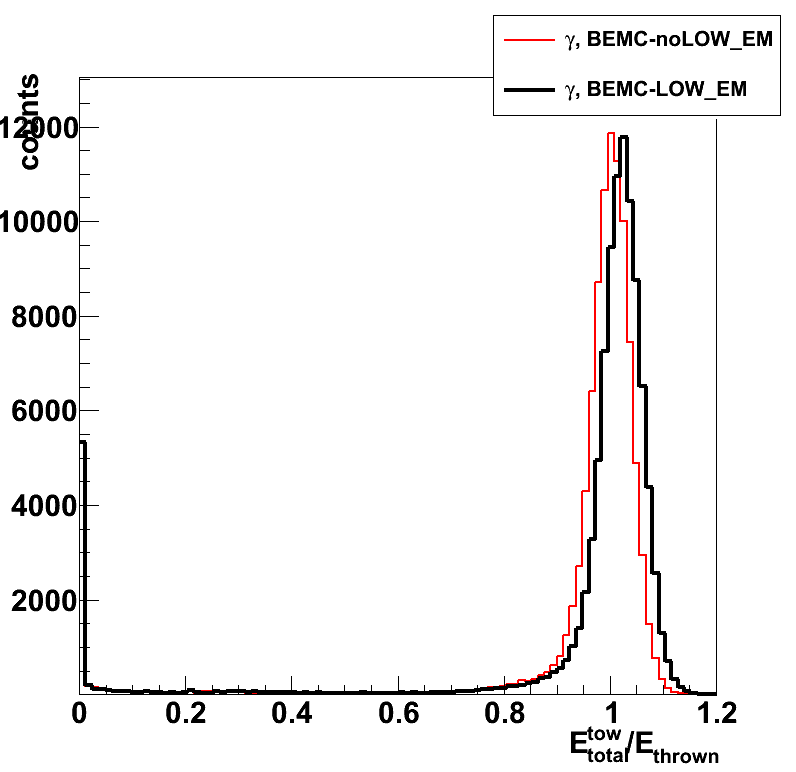
Figure 2: Average E_reco/E_thrown vs. thrown photon eta (left) and phi (right)
Average is taken over a slice in eta or phi (no gaussian fits)
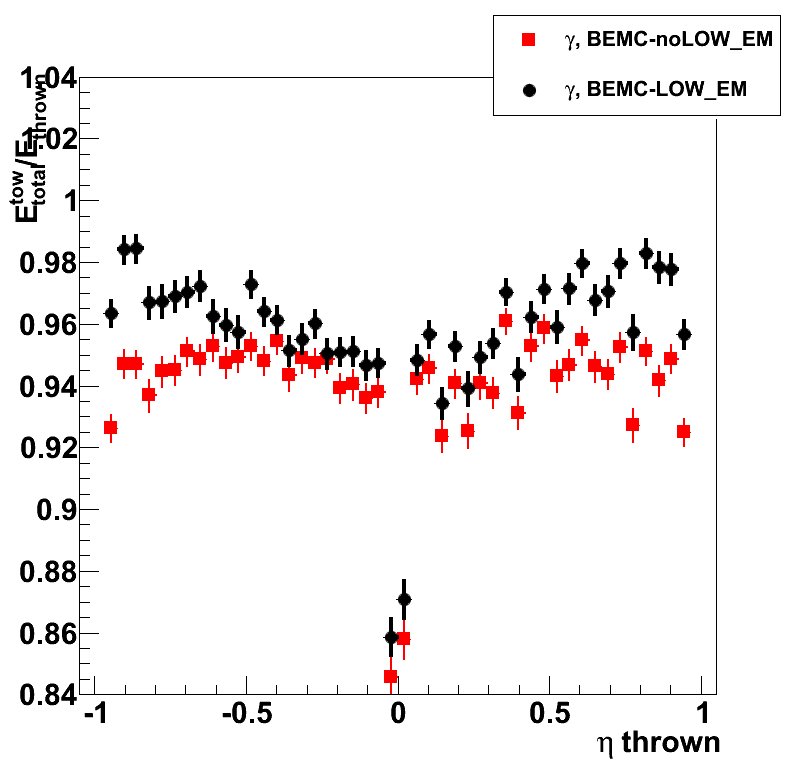
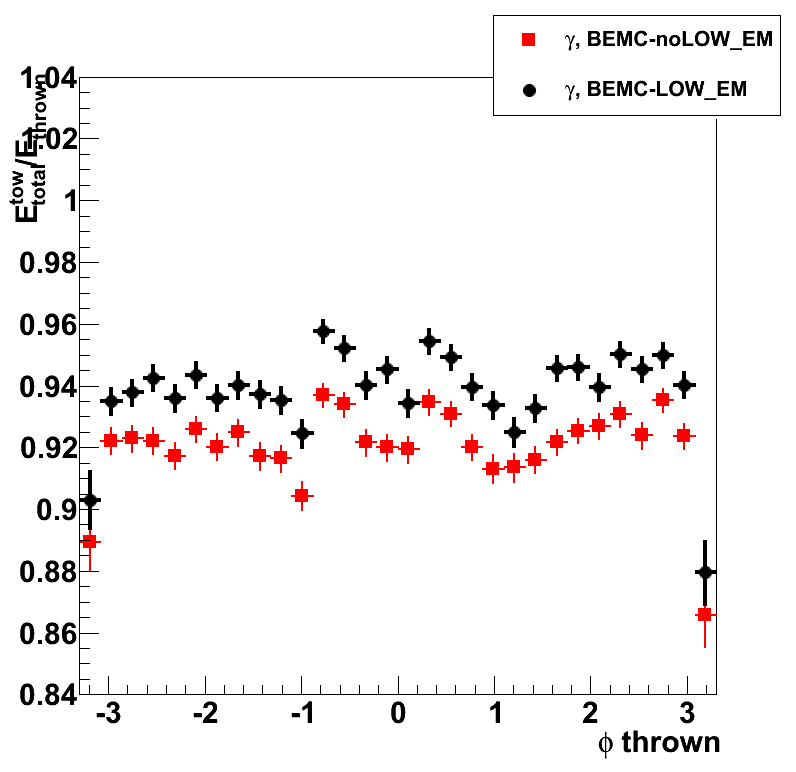
Figure 3: Average E_reco/E_thrown vs. thrown position (eta and phi)
Left: without LOW_EM option; right: with LOW_EM option
No cut applied to exclude otliers
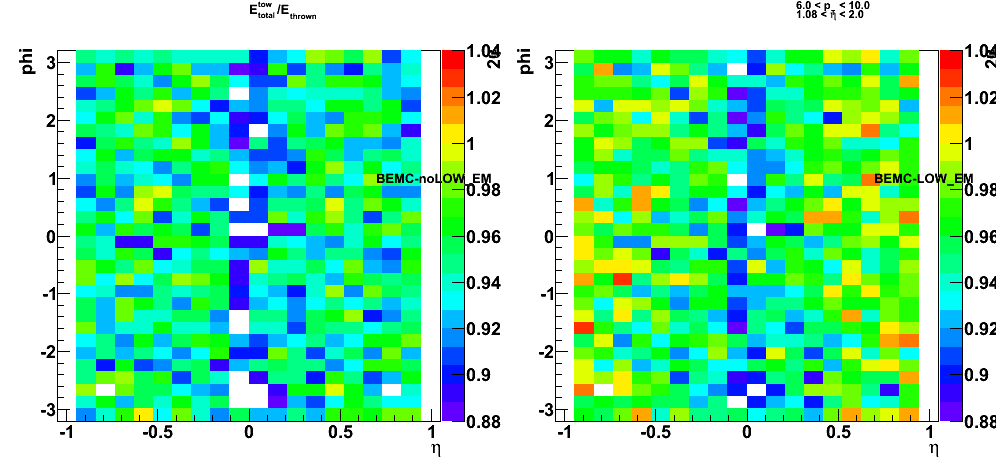
2009.11.03 Jason EEMC geometry: Effect of ELED block change
Monte-Carlo setup:
- One photon per event
- Disabled SMD layers (EXPS EBLS EFLS) in Jason geometry
- Alter the ELED block (lead absorber plate) in Jason geometry file
- Full STAR geometry configurations with and without LOW_EM option
(using Victor's geometry fix) - Throw particles flat in eta (1.08, 2.0), phi (0, 2pi), and pt (6-10 GeV)
- Using A2Emaker to get reconstructed Tower/SMD energy
(no EEMC SlowSimulator in chain) - Vertex z=0
- ~50K/per particle type
- Non-zero energy: 3 sigma above pedestal
Figure 1: Sampling fraction (total energy in EEMC)
- Solid symbols and lines present results with LOW_EM option
Note: the black are the same in left and right plots - Open/dashed symbols and lines - results without LOW_EM option
- Upper plots - distribution of the sampling fcation
- Lower plots - Sampling fcation vs. thrown photon energy
- Left plots: CVS geometry vs. Jason with removed extra SMD layers.
ELED block is the same in all 4 cases, and is taken from CVS file.
in red: CVS geometry, in black - Jason geometry - Right plots:
Jason with new ELED block (in red) vs. Jason with ELED block from CVS (in black)
Extra SMD layers are removed in all 4 cases

Figure 2: Sampling fraction (total energy in EEMC)
black: same black as in Fig. 1, upper plots
red: EEMC geometry with Material PbAlloy isvol=0
(modification suggested by Jason in this post)
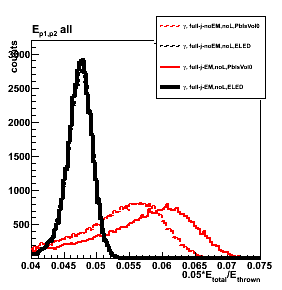
2009.11.06 new EEMC geometry: Pure lead and new SMD layers
Monte-Carlo setup:
- One photon per event
- Disabled/Enabled SMD layers (EXPS EBLS EFLS) in Jason geometry
- Alter the ELED block with pure lead
- Full STAR geometry configurations with and without LOW_EM option
(using Victor's geometry fix) - Throw particles flat in eta (1.08, 2.0), phi (0, 2pi), and pt (6-10 GeV)
- Using A2Emaker to get reconstructed Tower/SMD energy
(no EEMC SlowSimulator in chain) - Vertex z=0
- ~50K/per particle type
- Non-zero energy: 3 sigma above pedestal
Geometry configurations
- dashed/open red (j-noEM,noL,Pb):
full STAR y2006, no LOW_EM, Jason EEMC geometry without new SMD layers, pure lead in ELED block - solid red (j-EM,noL,Pb):
full STAR y2006, LOW_EM, Jason EEMC geometry without new SMD layers, pure lead in ELED block - dashed/open black (j-noEM,Pb):
full STAR y2006, no LOW_EM, Jason EEMC geometry with new SMD layers, pure lead in ELED block - solid black (j-EM,Pb):
full STAR y2006, LOW_EM, Jason EEMC geometry with new SMD layers, pure lead in ELED block
Sampling fraction of various EEMC layers (tower, SMD, pre1-,pre2-, post- shower)
Figure 1: Tower sampling fraction distribution
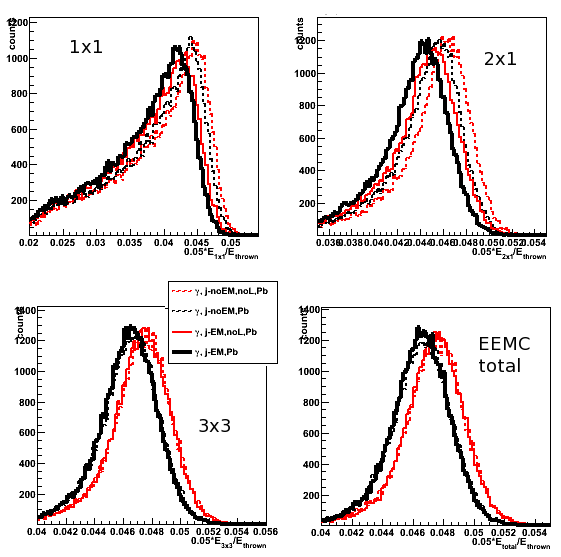
Figure 2: Tower sampling fraction vs. thrown energy
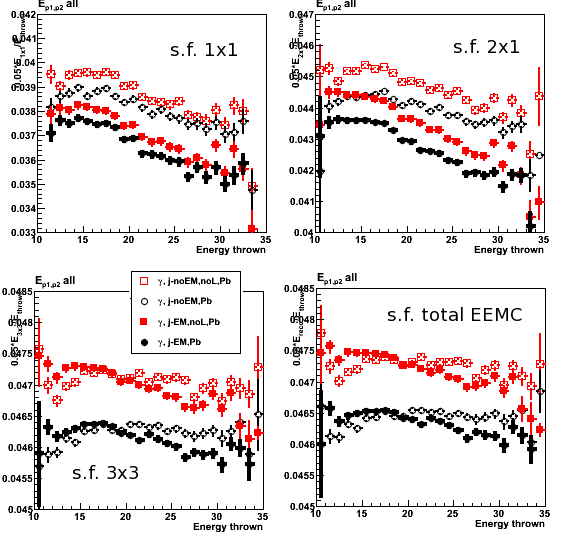
Figure 3: Tower sampling fraction vs. position of the thrown photon
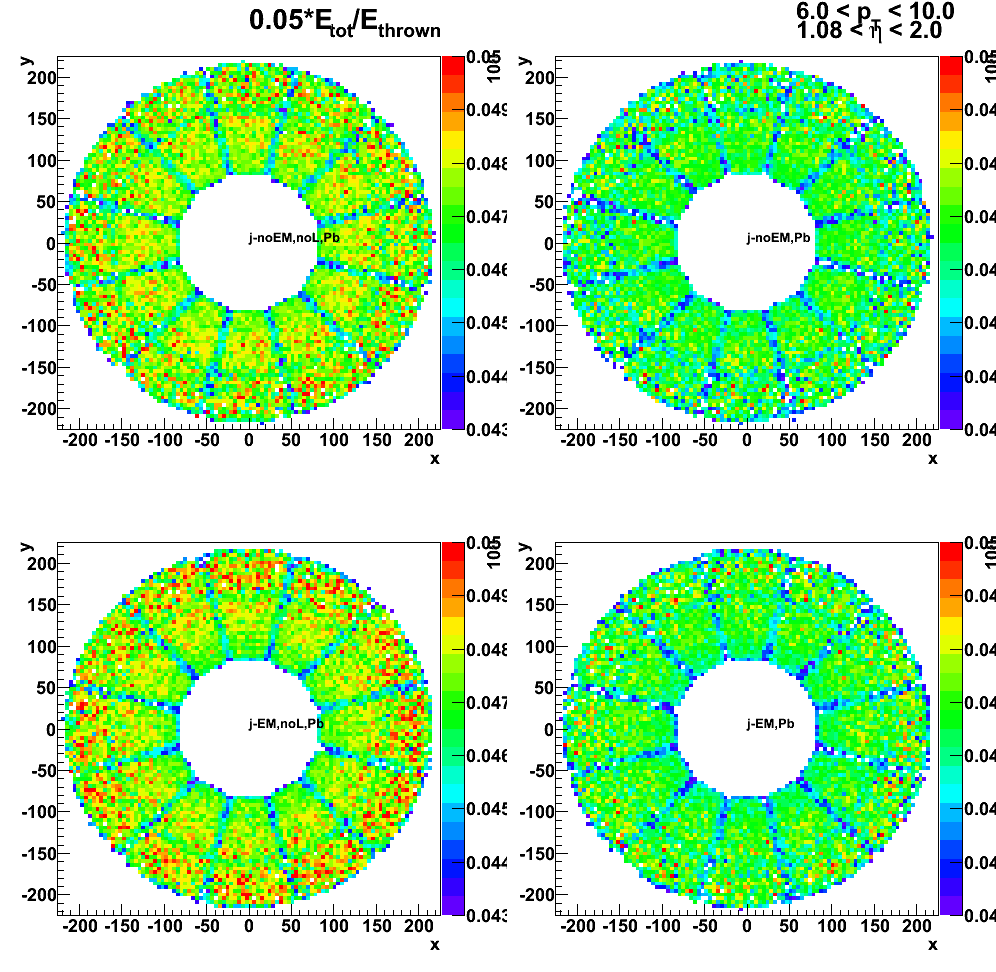
Figure 4: Pre1, pre2, post and SMD sampling fraction distribution
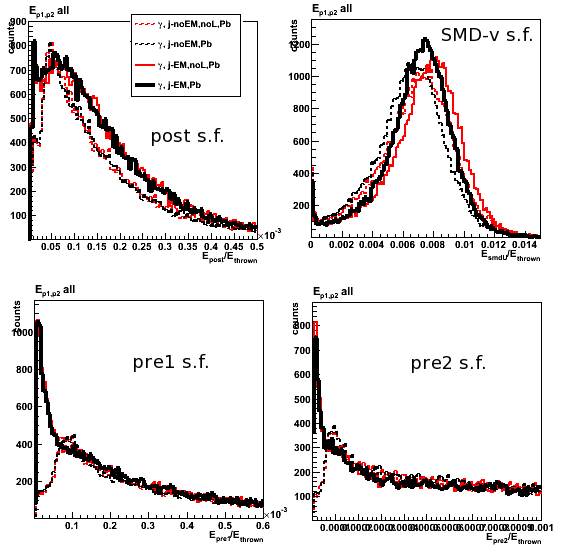
Figure 5: Pre1, pre2, post and SMD sampling fraction vs. thrown energy
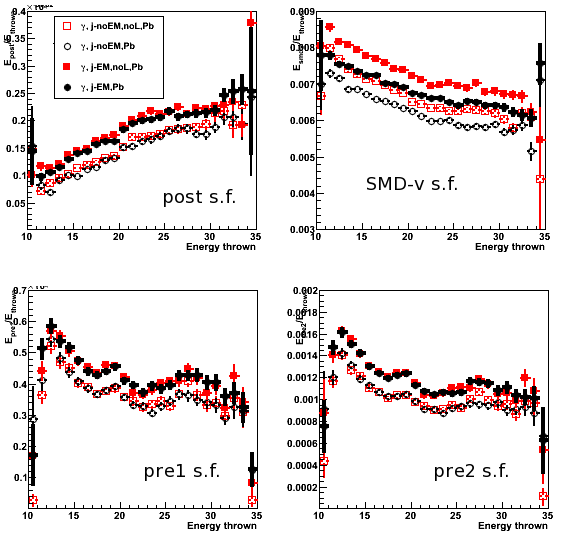
SMD shower shapes
Figure 6: SMD-v shower shapes

Figure 7: SMD-v shower shape ratios
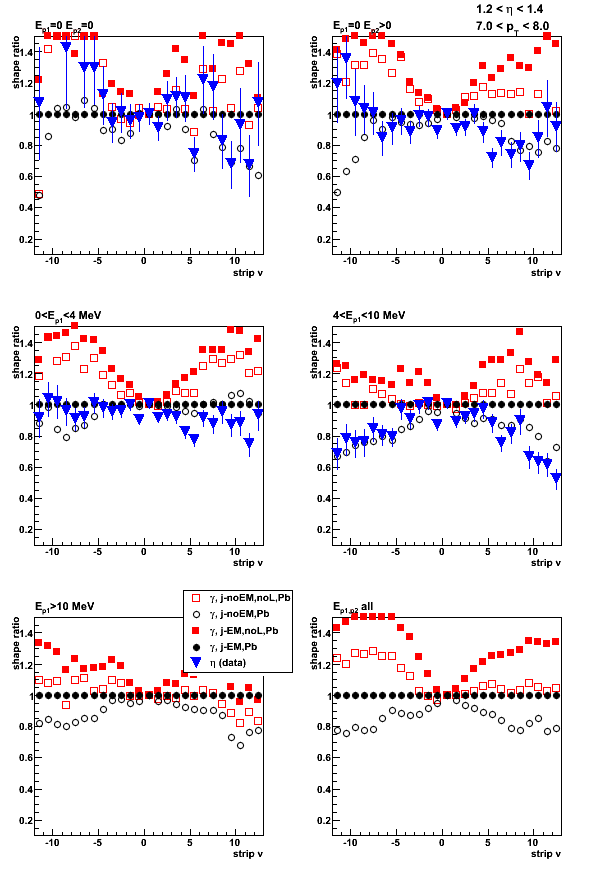
Figure 8: Number of SMD-u strips

Figure 9: Number of SMD-v strips
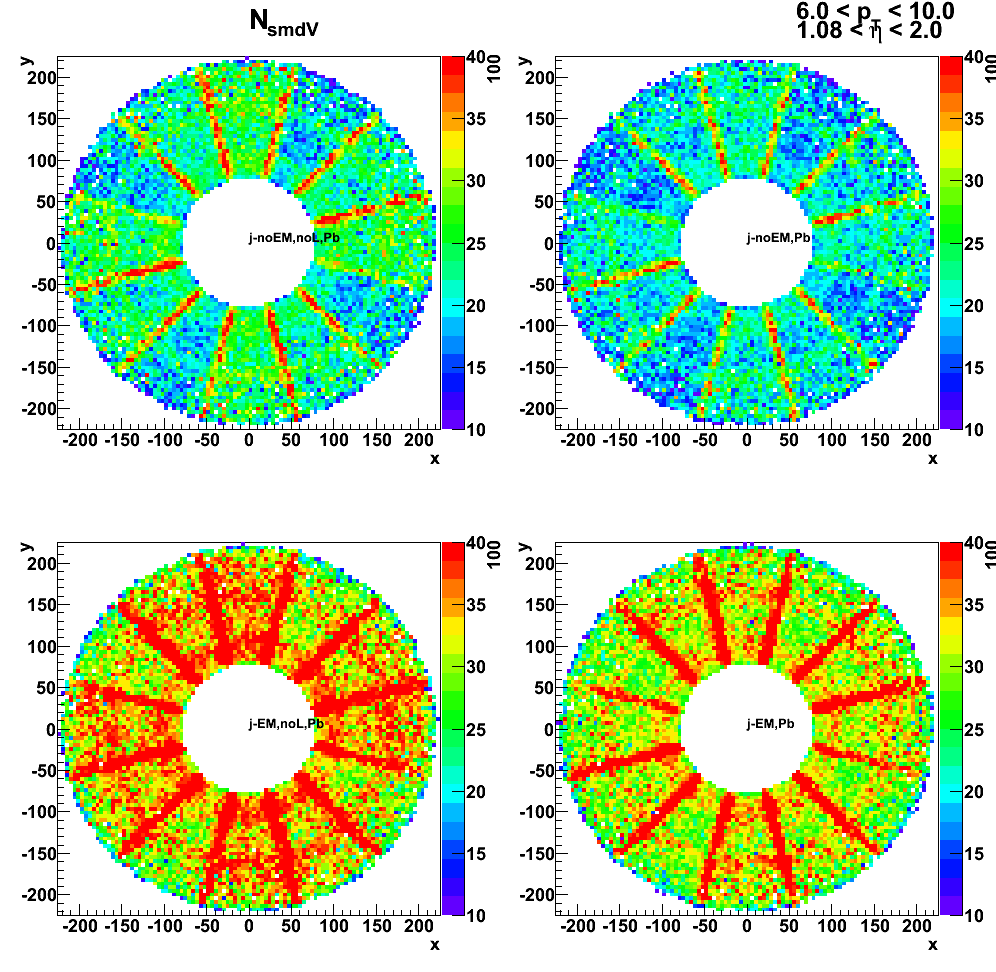
Tower energy profile
Figure 10: Energy ractio of 2x1 to 3x3 cluster vs. gamma-jet data
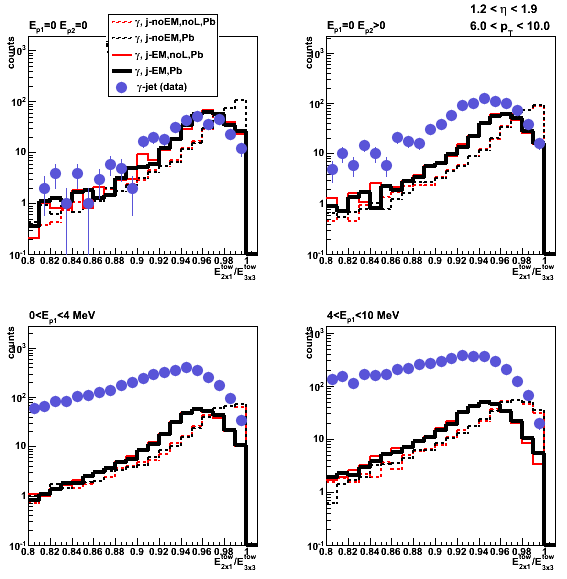
Energy deposition in various EEMC layers vs. position of the thrown photon
Figure 11: Pre-shower1 energy
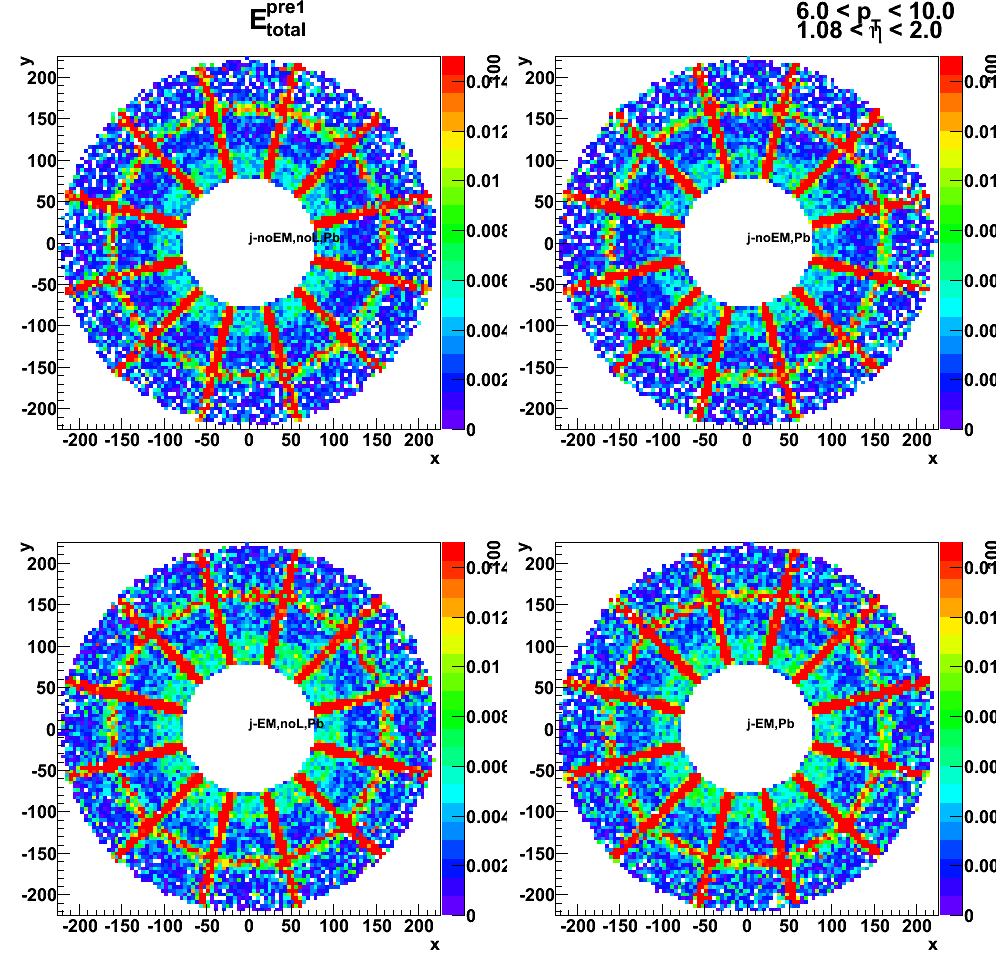
Figure 12: Pre-shower2 energy
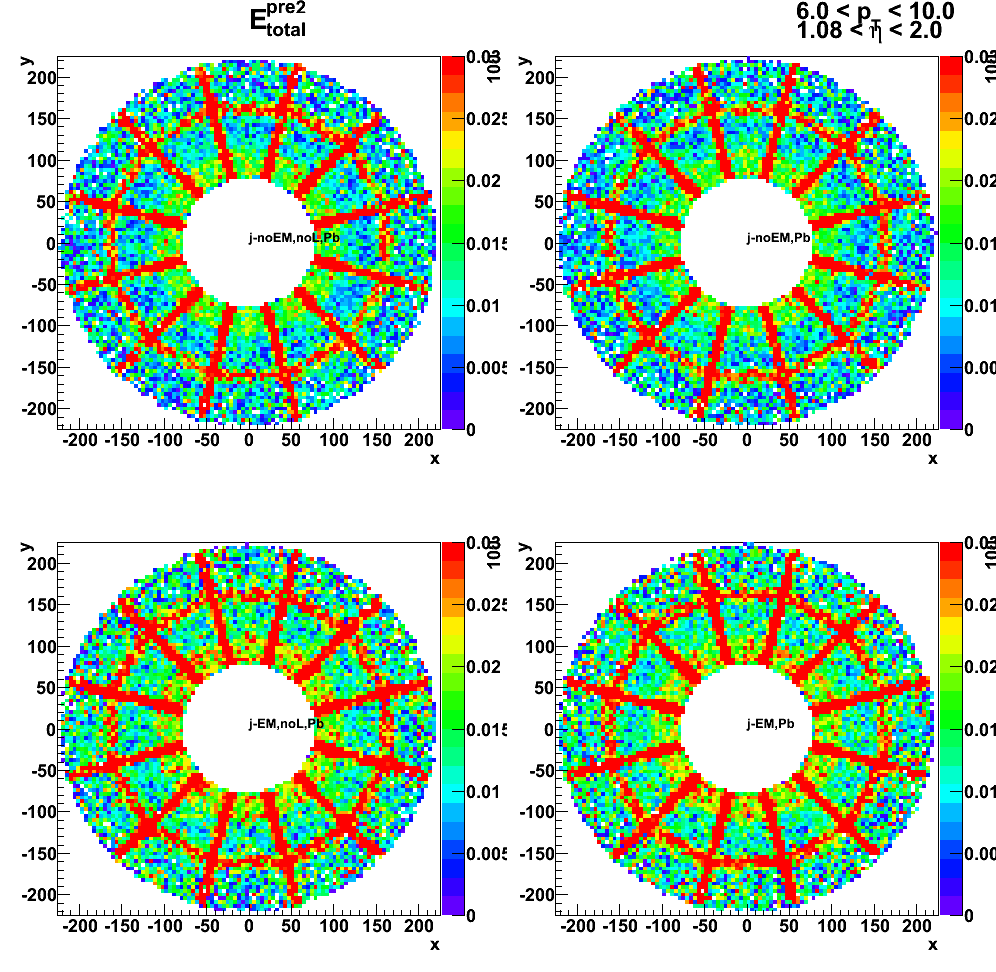
Figure 13: Post-shower energy
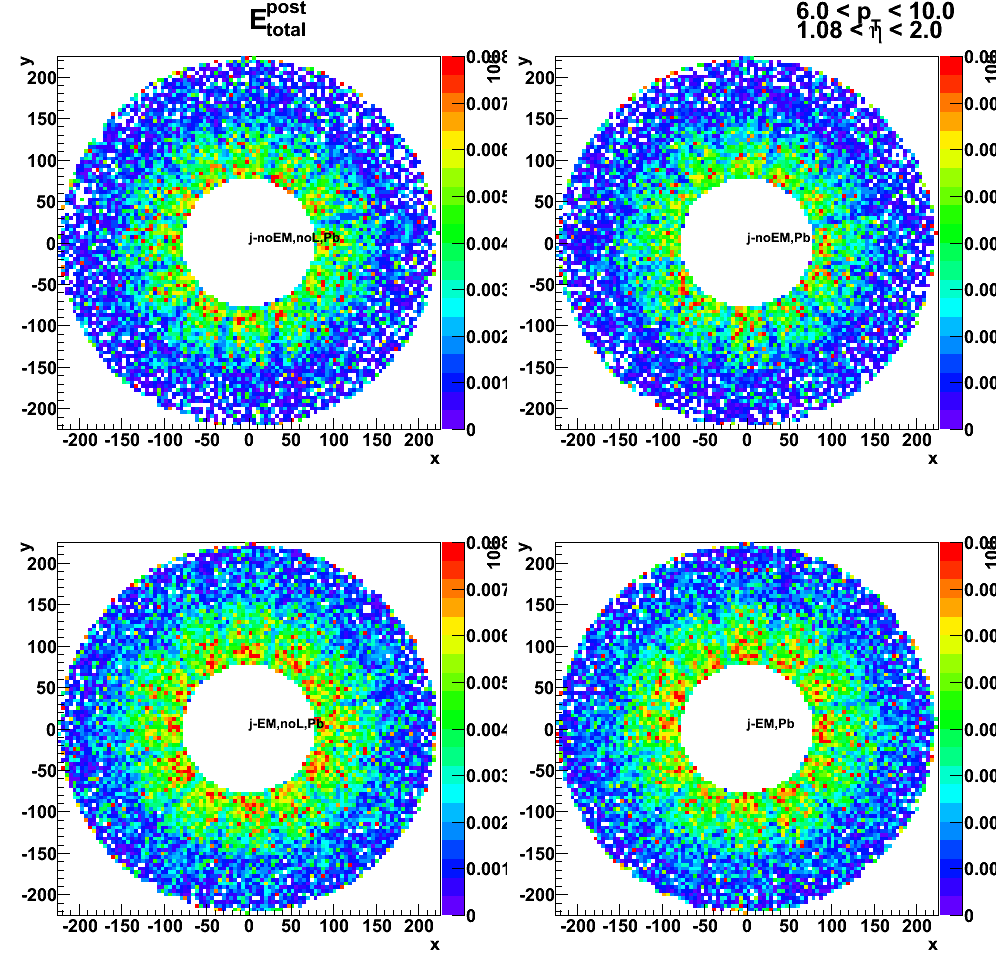
Figure 14: SMD-v energy
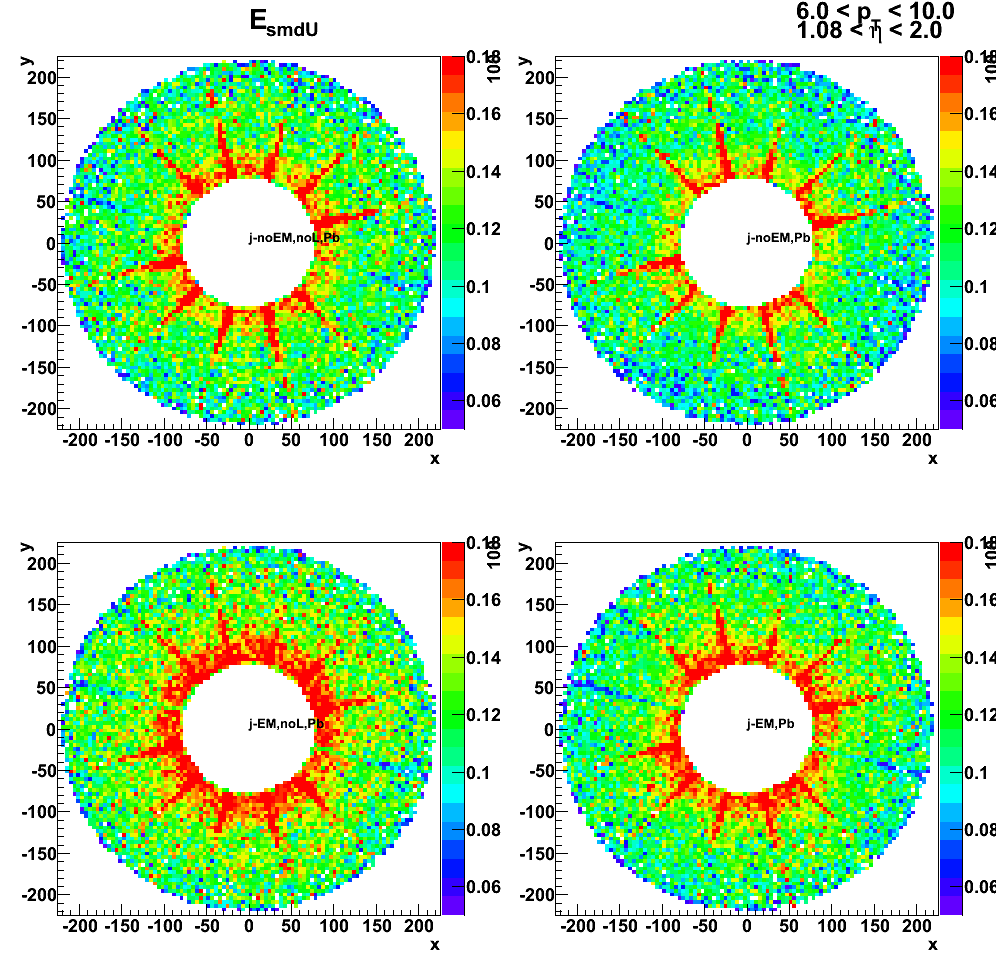
Figure 15: Number of towers
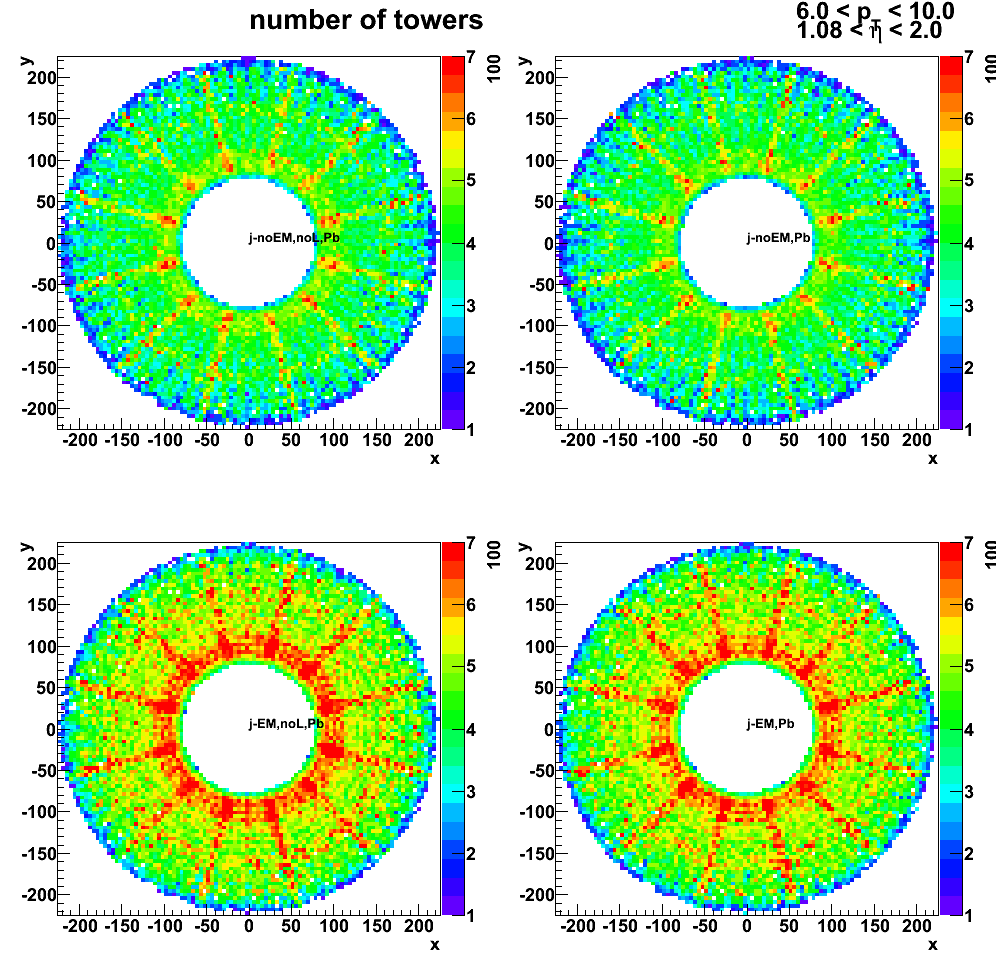
LOW_EM option and pre-shower migration
Figure 16: Tower Sampling fraction: LOW_EM option and pre-shower migration
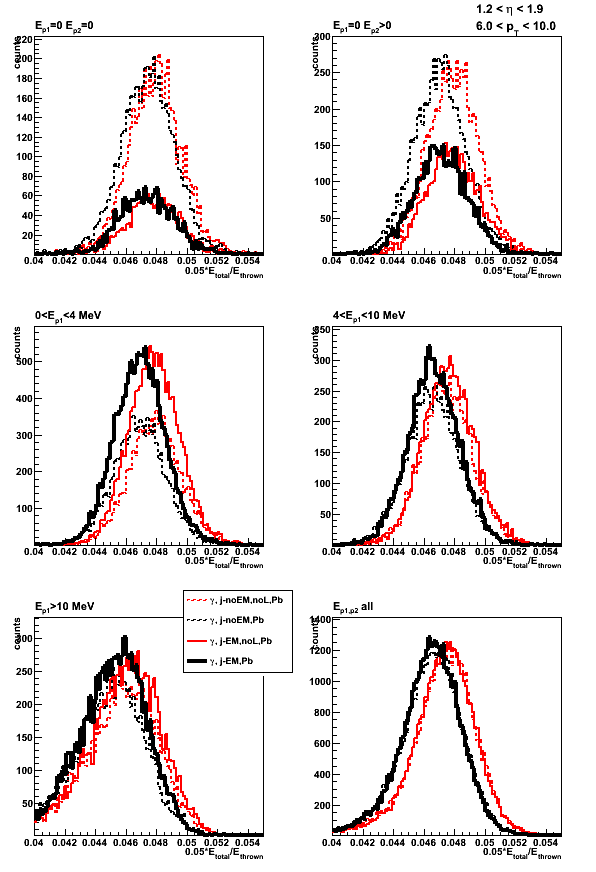
2009.11.10 BEMC sampling fraction and clustering
Monte-Carlo setup:
- Throwing one photon per event
- Full y2009 STAR geometry configurations with and without LOW_EM option.
Note: LOW_EM cuts are listed at the bottom of this page,
and some related discussion can be found in this phana thread - Throw particles flat in eta (-0.95,0.05) amd (0.05, 0.95), phi (0, 2pi), and energy (30 +/- 0.5 GeV)
- bfc.C options:
trs,fss,y2009,Idst,IAna,l0,tpcI,fcf,ftpc,Tree,logger,ITTF,Sti,MakeEvent,McEvent,
geant,evout,IdTruth,tags,bbcSim,tofsim,emcY2,EEfs,
GeantOut,big,-dstout,fzin,-MiniMcMk,beamLine,clearmem,eemcDB,VFPPVnoCTB - Use fixed (7%) sampling fraction in StEmcSimpleSimulator.cxx
mSF[0] = 1/0.07;
mSF[1] = 0.;
mSF[2] = 0.; - Vertex z=0
- 50K/per particle type
Geometry configurations and notations:
- BEMC-noLOW_EM: Full STAR y2009 without LOW_EM option
- BEMC-LOW_EM: Full STAR y2009 with LOW_EM option
data base settings (same settings in bfc.C (Jan's trick) and in my MuDst reader):
dbMk->SetFlavor("sim","bemcPed");
dbMk->SetFlavor("Wbose","bemcCalib");
dbMk->SetFlavor("sim","bemcGain");
dbMk->SetFlavor("sim","bemcStatus");
Note: for BEMC ideal pedSigma set to 0, so effectively
there is no effect when I apply 3-sigma threshold above pedestal.
Figure 1: Sampling fraction (0.07*E_reco/E_thrown) distribution: average vs. gaussian fit
E_reco is the total energy in the BEMC towers from mMuDstMaker->muDst()->muEmcCollection()
E_thrown energy of the thrown photon from tne GEant record
The difference between fit and using average values is < 0.7%
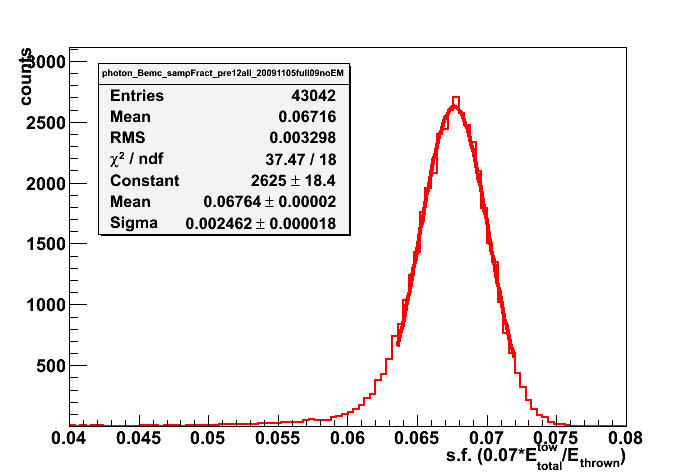
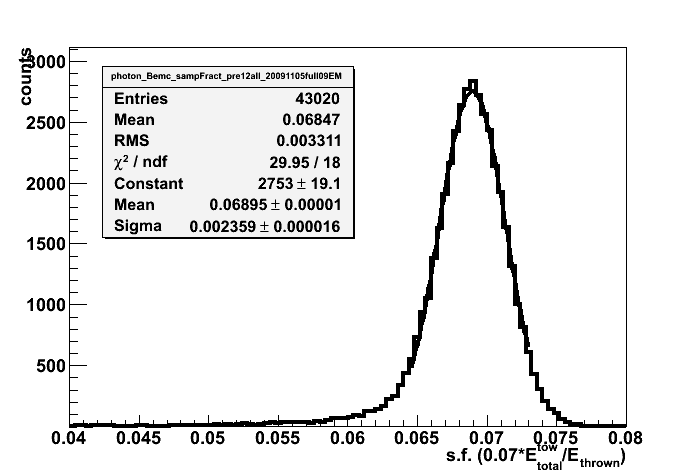
Figure 2: Otliers vs. eta and phi: (left) no energy reconstrycted, (right) s.f. < 55%
Most outlier are at eta = 0, -1, +1

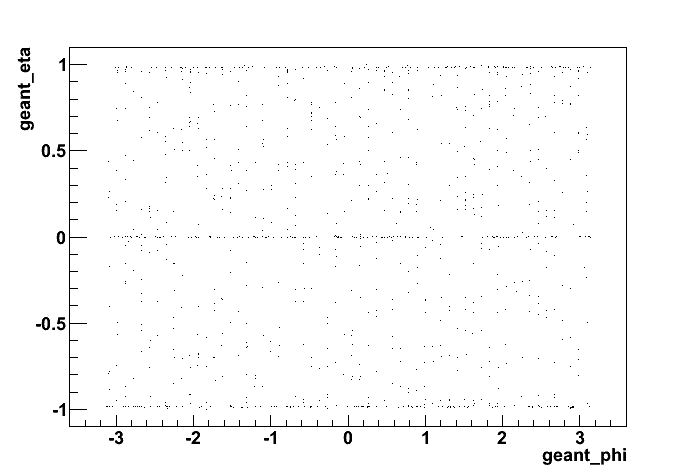
Figure 3: Sampling fraction (0.07*E_reco/E_thrown) distribution
Effect of LOW_EM cuts
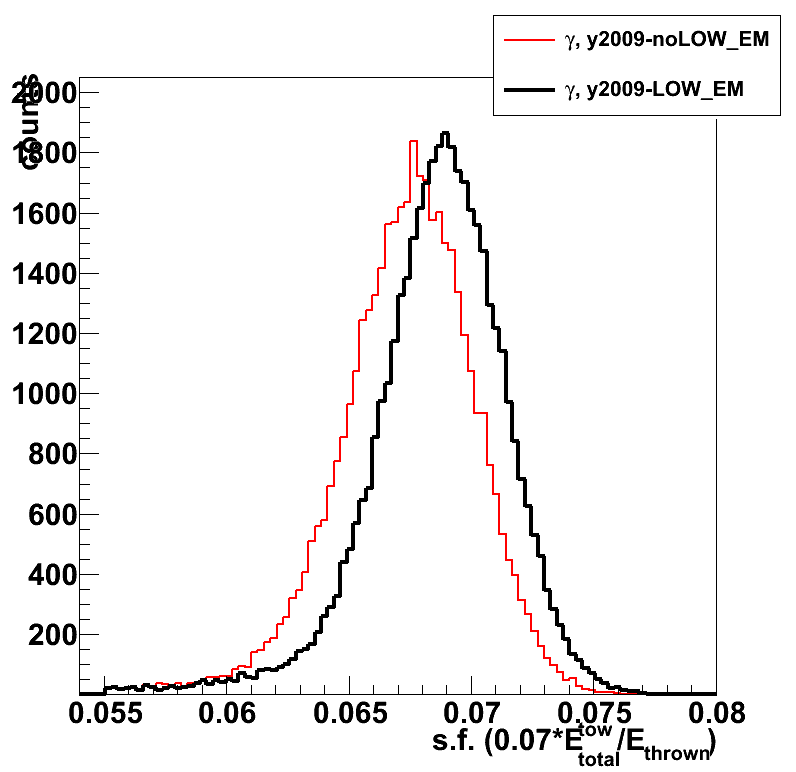

Figure 4: Sampling fraction vs. thrown photon eta (left) and phi (right)
Average is taken over a slice in eta or phi with cut on outliers (events with s.f. < 5.5% rejected)
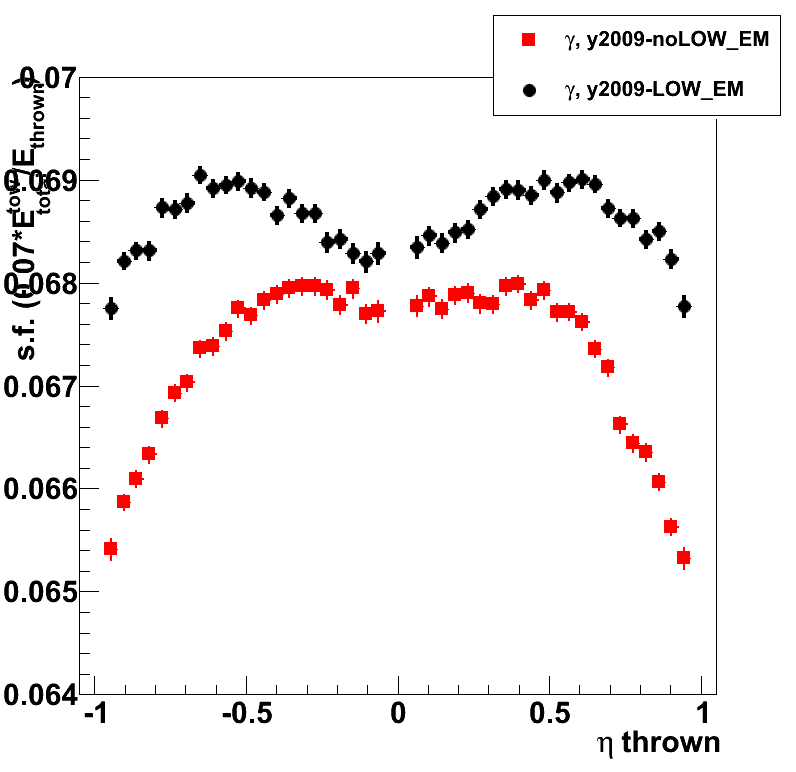

Figure 5: Sampling fraction vs. thrown position (eta and phi)
Average is taken over a slice in eta or phi with cut on outliers (events with s.f. < 5.5% rejected)
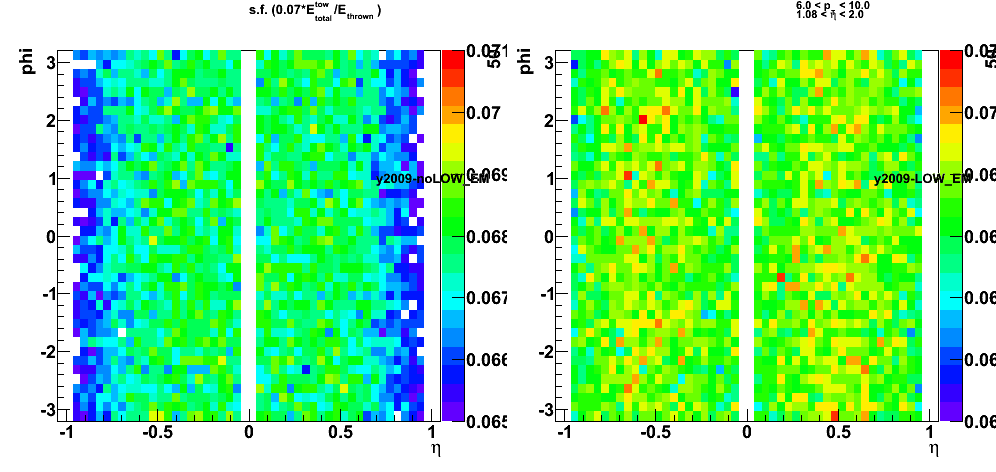
Figure 6: (left) Single tower sampling fraction
and (right) energy ratio of 1x1 cluster to the total BEMC energy
Not much of the effect from LOW_EM cuts on the 1x1 clustering. Need to look at other (2x1, 2x2 clusters)
![]()
![]()
2009.11.11 Tests of EEMC geometry, version 6.1
Monte-Carlo setup:
- Throwing one photon per event
- Compare EEMC geometry v6.0 (pure lead) vs. v6.1
- Full STAR geometry configurations with and without LOW_EM option
- Throw particles flat in eta (1.08, 2.0), phi (0, 2pi), and pt (6-10 GeV)
- Using A2Emaker to get reconstructed Tower/SMD energy (no EEMC SlowSimulator in chain)
- Vertex z=0
- ~50K/per particle type
- Non-zero energy: 3 sigma above pedestal
Geometry configurations
- dashed/open red: full STAR y2006, no LOW_EM, EEMC geometry v6.1
- solid red: full STAR y2006, with LOW_EM, EEMC geometry v6.1
- dashed/open black: full STAR y2006, full STAR y2006, no LOW_EM, EEMC geometry v6.0
- solid black: full STAR y2006, full STAR y2006, with LOW_EM, EEMC geometry v6.0
Sampling fraction of various EEMC layers (tower, SMD, pre1-,pre2-, post- shower)
Figure 1: Sampling fraction of various EEMC layers vs. thrown photon energy:
(a) tower s.f.; (b) tower s.f. distribution; (c) pre-shower1; (d) pre-shower2; (e) SMD, (f) post-shower

Figure 2: (left) Shower shapes and (right) shower shape ratios
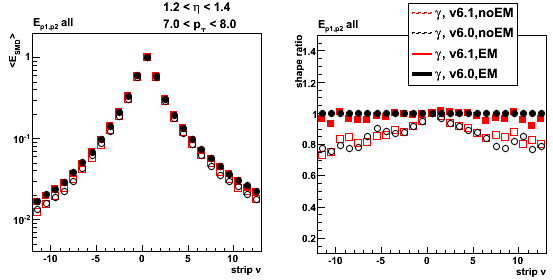
2009.11.16 Tests of EEMC geometry, version 6.1: lead vs. mixture
Monte-Carlo setup:
- Throwing one photon per event
- Compare EEMC geometry v6.1 with pure lead vs. mixture
- Full STAR geometry configurations with and without LOW_EM option
- Throw particles flat in eta (1.08, 2.0), phi (0, 2pi), and pt (6-10 GeV)
- Using A2Emaker to get reconstructed Tower/SMD energy (no EEMC SlowSimulator in chain)
- Vertex z=0
- ~50K/per particle type
- Non-zero energy: 3 sigma above pedestal
Geometry configurations
- dashed/open red: full STAR y2006, no LOW_EM, EEMC geometry v6.1 with pure lead
- solid red: full STAR y2006, with LOW_EM, EEMC geometry v6.1 with pure lead
- dashed/open black: full STAR y2006, full STAR y2006, no LOW_EM, EEMC geometry v6.1 with lead-ally mixture
- solid black: full STAR y2006, full STAR y2006, with LOW_EM, EEMC geometry v6.1 with lead-ally mixture
Figure 1: EEMC sampling fraction vs. thrown photon energy:
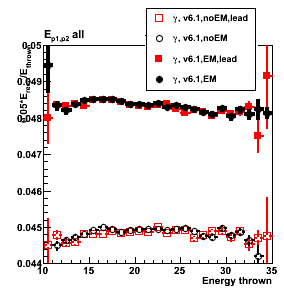
2009.11.17 BEMC sampling fraction: energy dependence
Monte-Carlo setup:
- Throwing one photon per event
- Full y2009 STAR geometry configurations with LOW_EM option
- Throw particles flat in eta (-1,1), phi (0, 2pi),
with energy steps: 10, 20, 30, 40, and 50 GeV with flat (+/-0.5 GeV) spread - bfc.C options:
trs,fss,y2009,Idst,IAna,l0,tpcI,fcf,ftpc,Tree,logger,ITTF,Sti,MakeEvent,McEvent,
geant,evout,IdTruth,tags,bbcSim,tofsim,emcY2,EEfs,
GeantOut,big,-dstout,fzin,-MiniMcMk,beamLine,clearmem,eemcDB,VFPPVnoCTB - Use fixed (7%) sampling fraction in StEmcSimpleSimulator.cxx
mSF[0] = 1/0.07;
mSF[1] = 0.;
mSF[2] = 0.; - Vertex z=0
- 50K/per particle type
data base settings (same settings in bfc.C (Jan's trick) and in my MuDst reader):
dbMk->SetFlavor("sim","bemcPed");
dbMk->SetFlavor("Wbose","bemcCalib");
dbMk->SetFlavor("sim","bemcGain");
dbMk->SetFlavor("sim","bemcStatus");
Note: for BEMC ideal pedSigma set to 0, so effectively
there is no effect when I apply 3-sigma threshold above pedestal.
Figure 1: Rapidity cuts study (no eta cuts, no cuts on otliers in this figure)
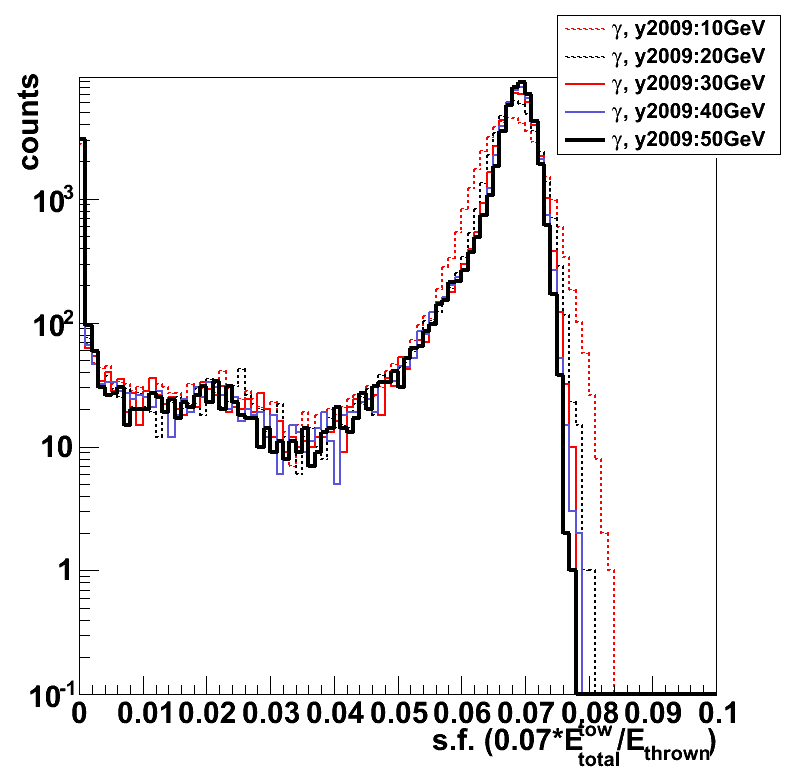
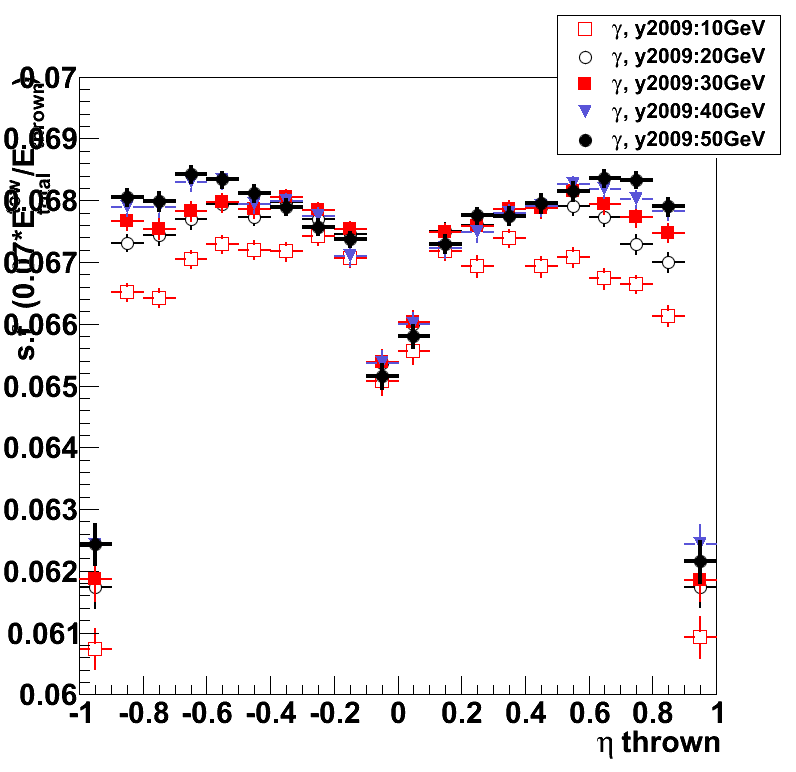


Figure 2: Sampling fraction (0.07*E_reco/E_thrown) distribution
E_reco is the total energy in the BEMC towers from mMuDstMaker->muDst()->muEmcCollection()
E_thrown energy of the thrown photon from tne Geant record
Cuts: |eta| < 0.97 && |eta|>0.01 && s.f. > 0.055
s.f. distribution on the log scale
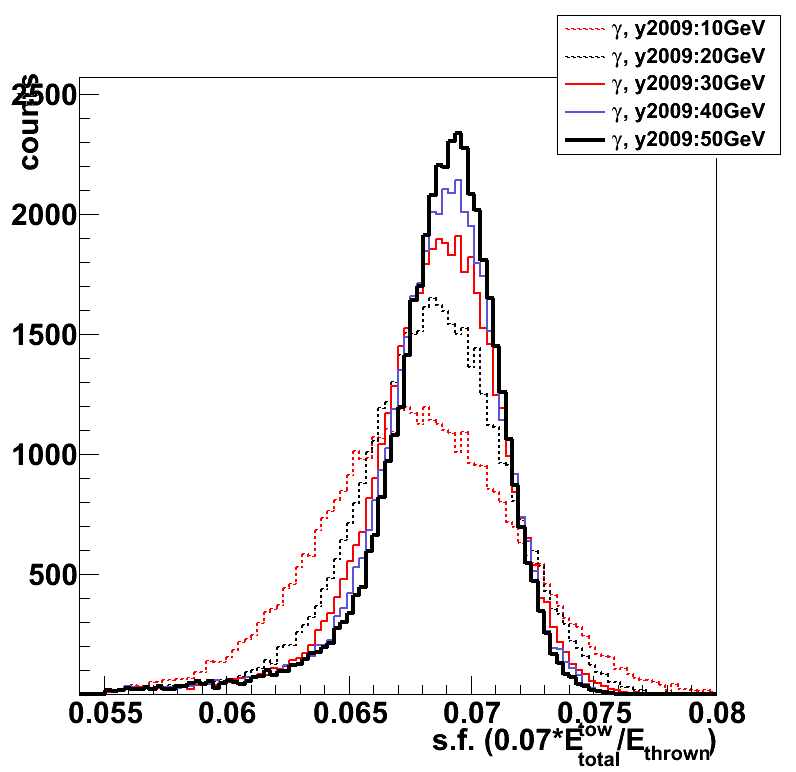

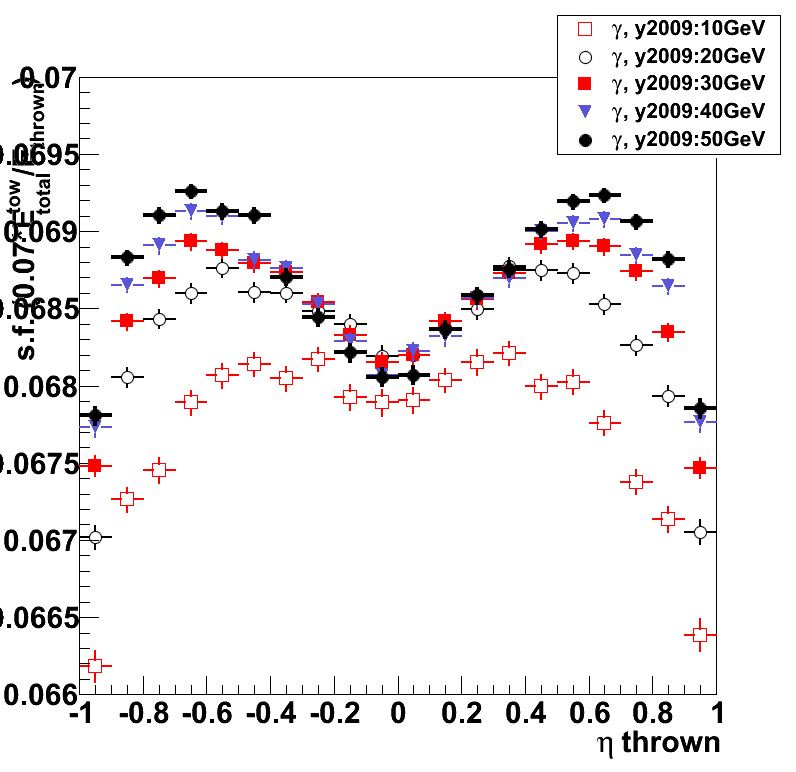
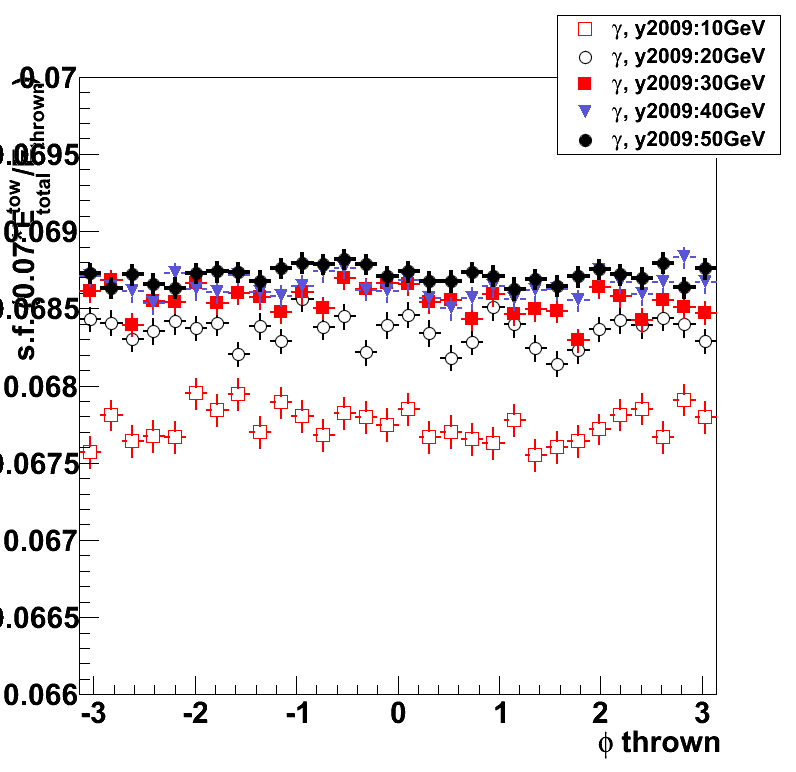
2009.11.19 LOW_EM and EEMC time/event in starsim
Monte-Carlo setup:
- Throwing one photon/electron per event
- y2009 geometry tag (EEMC geometry v6.1)
- Full STAR geometry configurations with and without LOW_EM option
- Throwing particles flat in eta (1.08, 2.0), phi (0, 2pi), and energy (5-35 GeV)
- ~50K/per particle type, 250 events per job, 200 jobs
Geometry configurations
- red: without LOW_EM option
- black: with LOW_EM option
- circles - electrons, squares - photons
Figure 1: (left) time/event distribution, (right) average time for the particle type
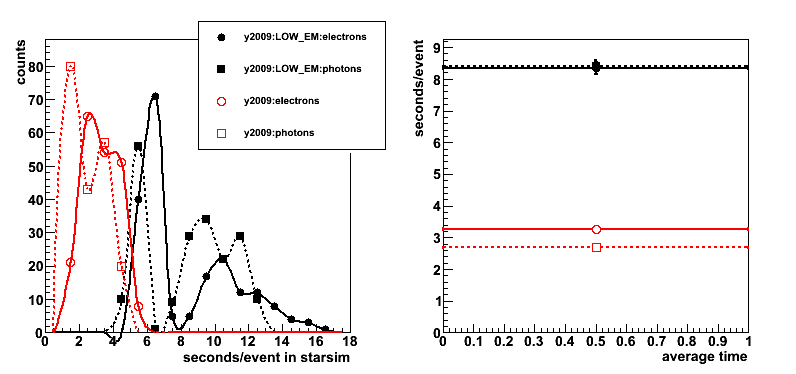
Conclusion: for single particle Monte-Carlo required time in starsim
with LOW_EM option is ~ 2.6 times higher.
2009.11.23 New EEMC geometry (CVS v6.1): y2006 vs. y2009 STAR configurations
Monte-Carlo setup:
- Throwing one photon per event
- Compare new EEMC geometry in CVS for y2006 and 2009 configurations
- Full STAR geometry configurations with and without LOW_EM option
- Throw particles flat in eta (1.08, 2.0), phi (0, 2pi), and energy (5-35 GeV)
- Using A2Emaker to get reconstructed Tower/SMD energy (no EEMC SlowSimulator in chain)
- Vertex z=0
- ~50K/per particle type
- Non-zero energy: 3 sigma above pedestal
Geometry configurations
- red: full STAR y2009, with/without LOW_EM, EEMC geometry
- black: full STAR y2006, with/without LOW_EM, EEMC geometry v6.1
Figure 1: EEMC sampling fraction (left) distribution (right) vs. thrown photon energy (1.2 < eta < 1.9; no pt cuts)
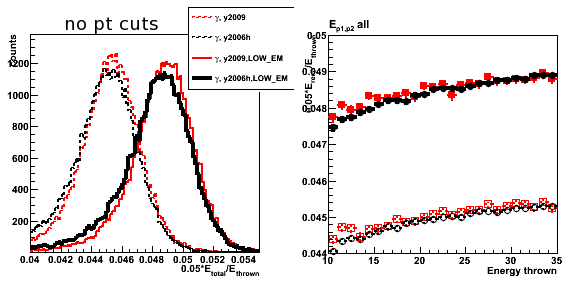
Figure 2: EEMC sampling fraction (left) distribution (right) vs. thrown photon energy (1.2 < eta < 1.9; pt > 7GeV cut)
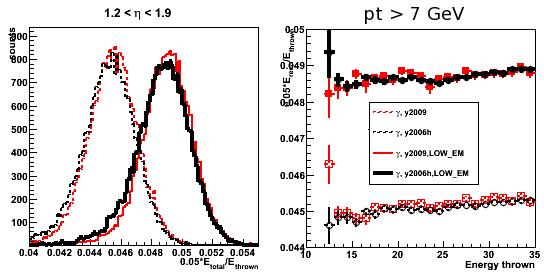
Figure 3: 2x1/3x3 clustering
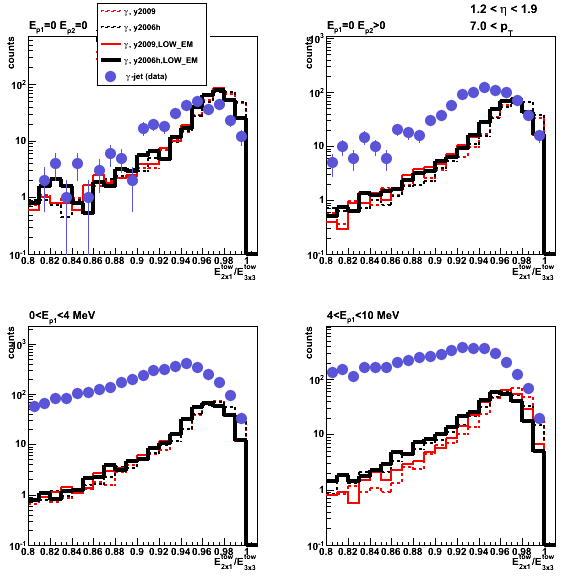
Figure 4: Shower shapes
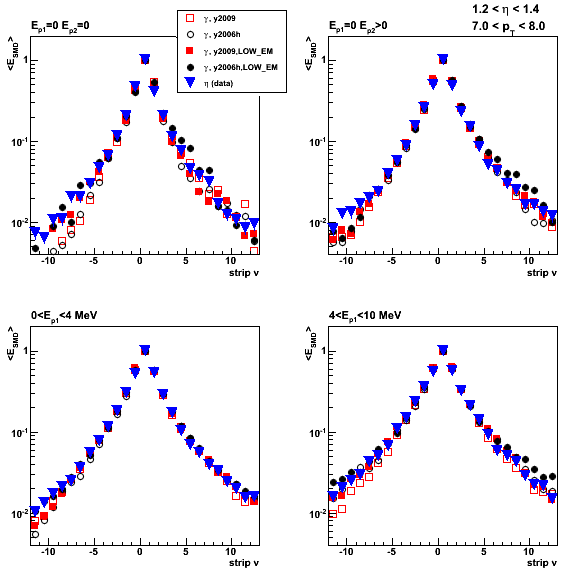
Figure 5: Shower shape ratios (v plane)
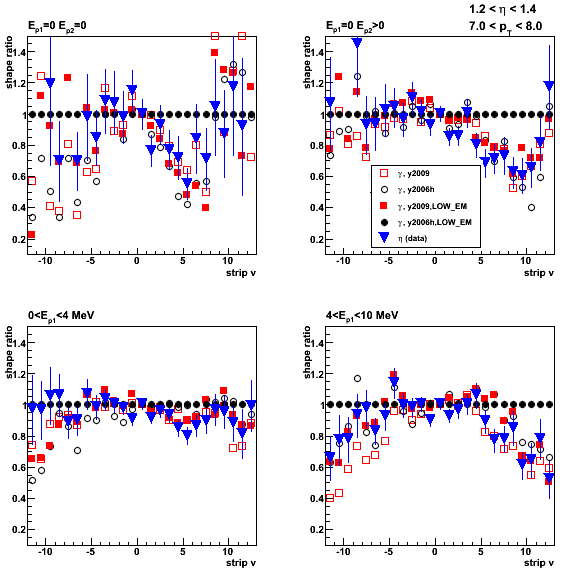
Figure 6: Shower shape ratios (u plane)

Figure 7: Pre-shower migration (1.2 < eta < 1.9; no pt cuts)

12 Dec
December 2009 posts
2009.12.01 BEMC 1x1, 2x1, 2x2, 3x3 clustering
Monte-Carlo setup:
- Throwing one photon per event
- Full y2009 STAR geometry configurations with/without LOW_EM option
- Throw particles flat in eta (-1,1), phi (0, 2pi),
with energy: 30GeV with flat (+/-0.5 GeV) spread - bfc.C options:
trs,fss,y2009a,Idst,IAna,l0,tpcI,fcf,ftpc,Tree,logger,ITTF,Sti,MakeEvent,McEvent,
geant,evout,IdTruth,tags,bbcSim,tofsim,emcY2,EEfs,
GeantOut,big,-dstout,fzin,-MiniMcMk,beamLine,clearmem,eemcDB,VFPPVnoCTB - Use fixed (7%) sampling fraction in StEmcSimpleSimulator.cxx
mSF[0] = 1/0.07;
mSF[1] = 0.;
mSF[2] = 0.; - Vertex z=0
- 50K/per particle type
data base settings (same settings in bfc.C (Jan's trick) and in my MuDst reader):
dbMk->SetFlavor("sim","bemcPed");
dbMk->SetFlavor("Wbose","bemcCalib");
dbMk->SetFlavor("sim","bemcGain");
dbMk->SetFlavor("sim","bemcStatus");
Note: for BEMC ideal pedSigma set to 0, so effectively
there is no effect when I apply 3-sigma threshold above pedestal.
Figure 1: Energy sampling of various cluster in the Barrel EMC
E_reco is the total energy in the BEMC towers from mMuDstMaker->muDst()->muEmcCollection()
eta_thrown - rapidity of the thrown photon from the Geant record
Cuts: |eta| < 0.97 && |eta|>0.01 && total energy s.f. > 0.055
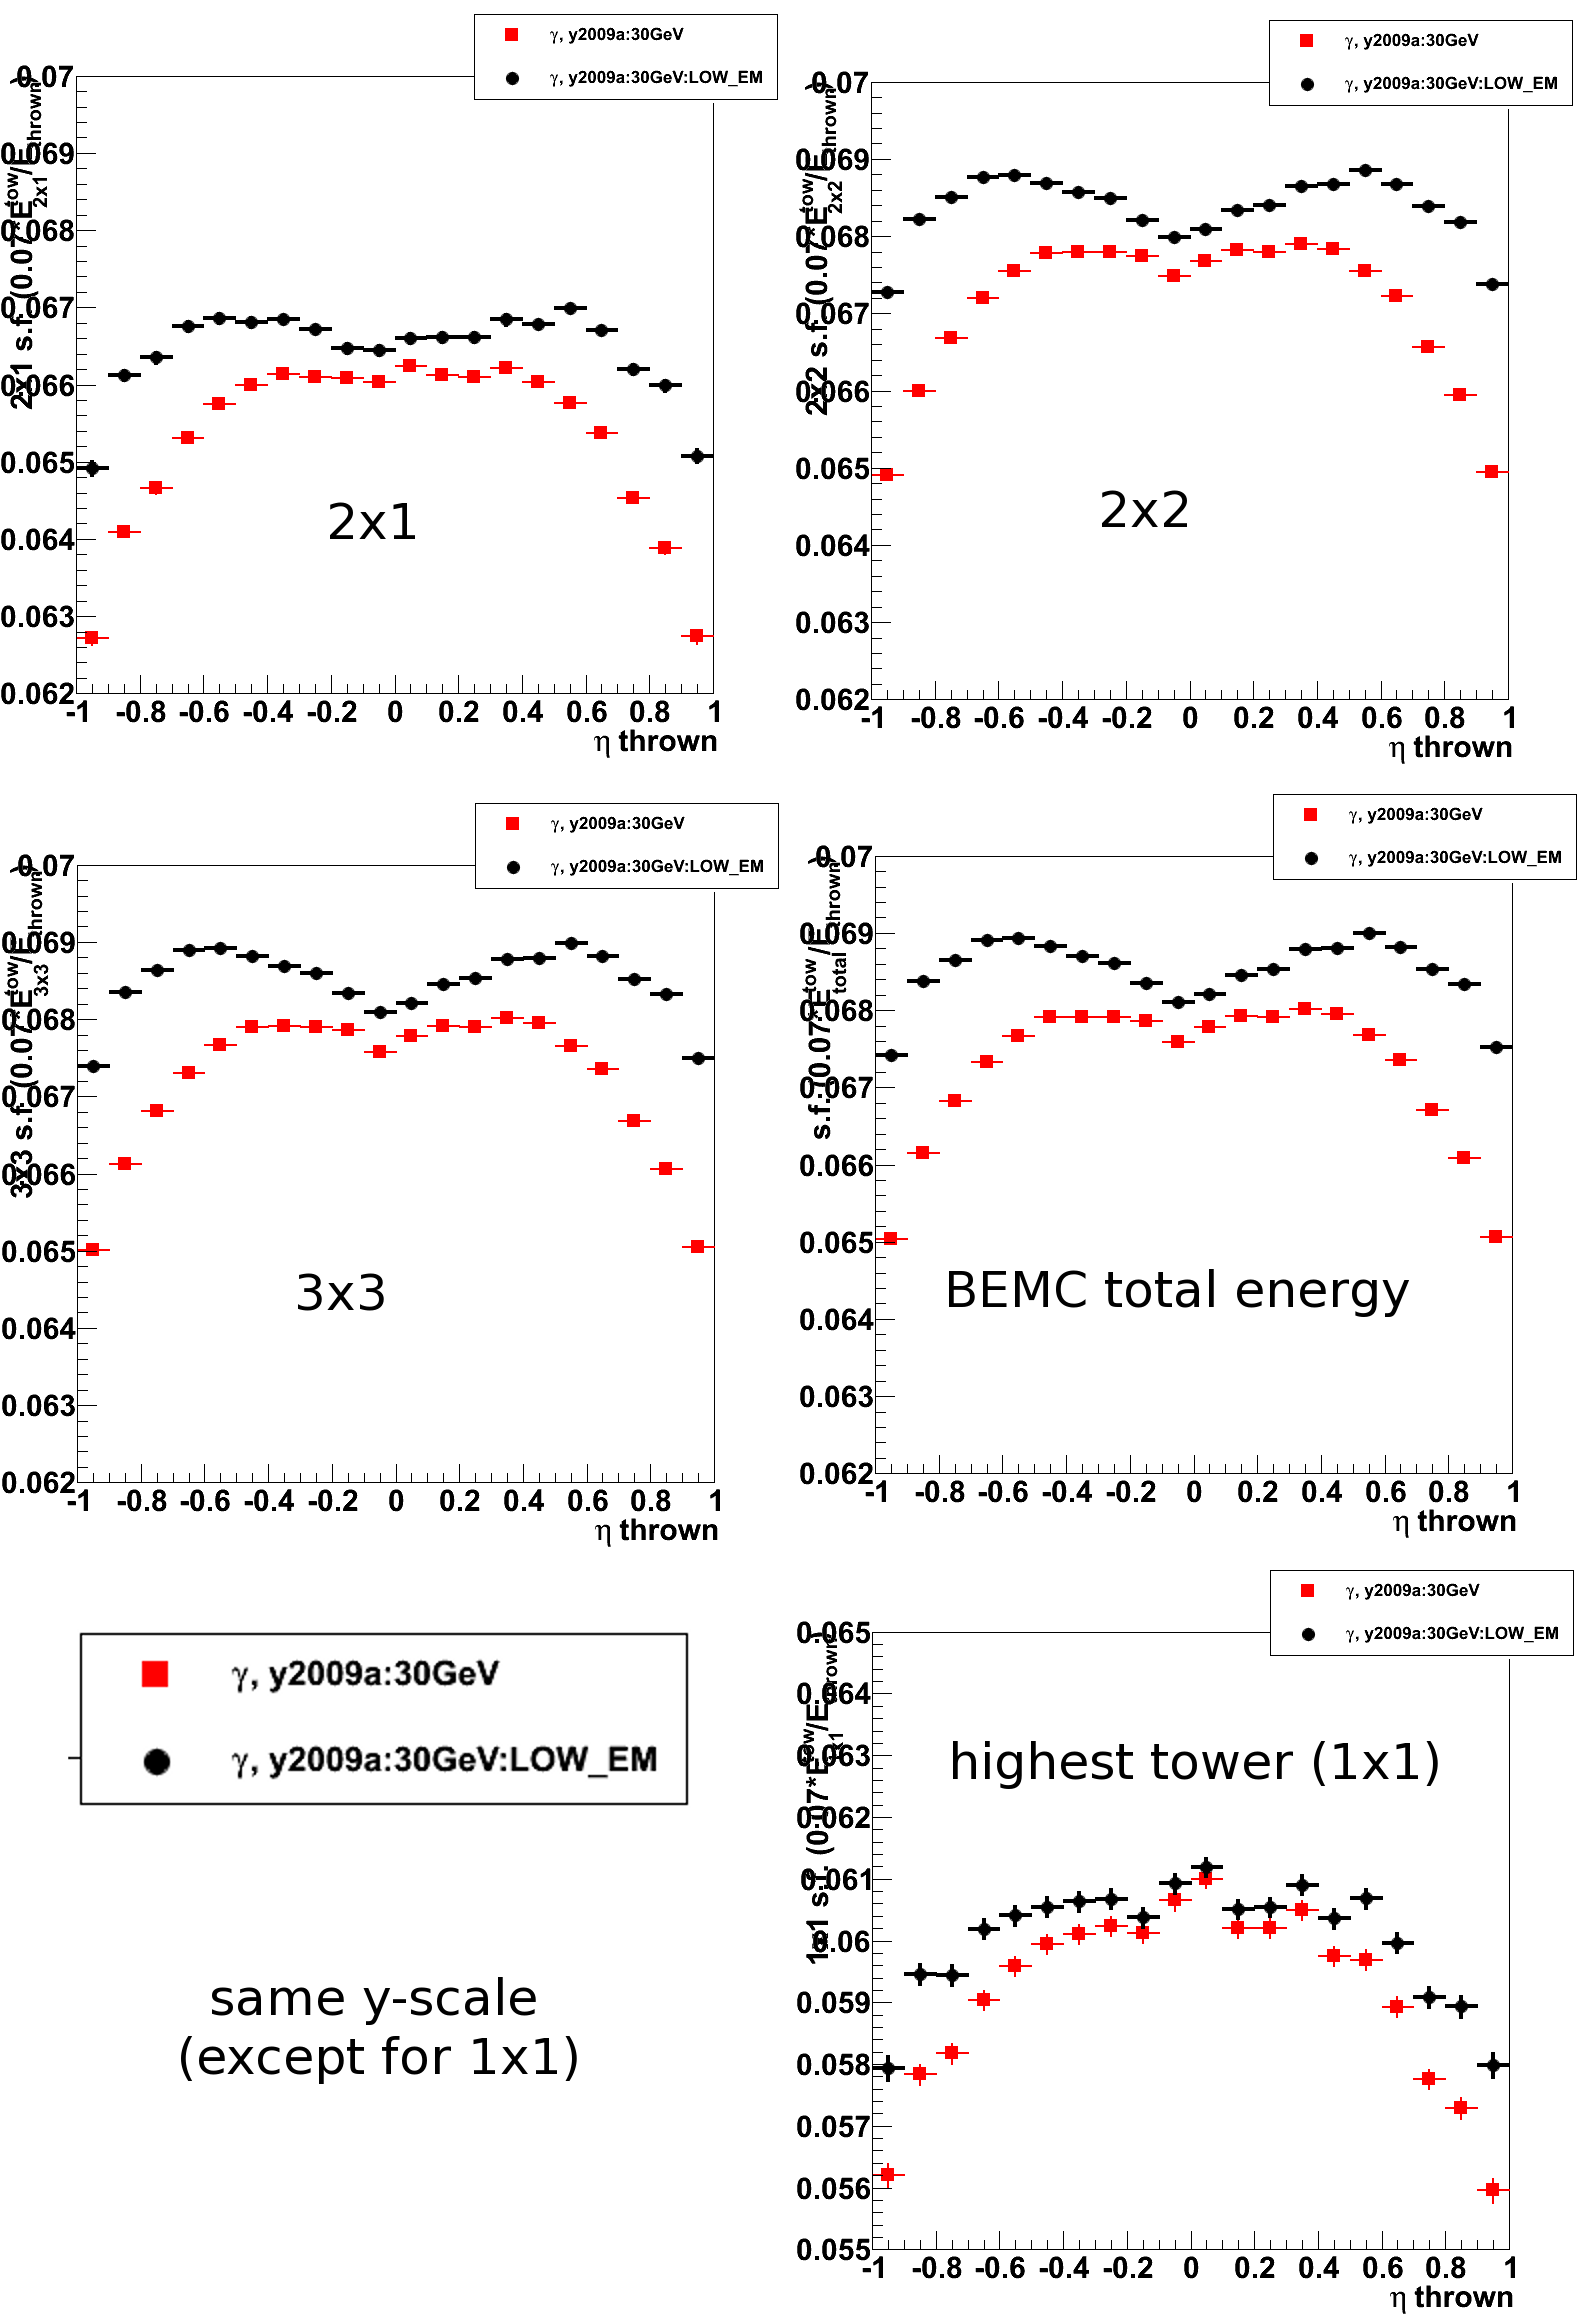
Figure 2: Various cluster energy ratios
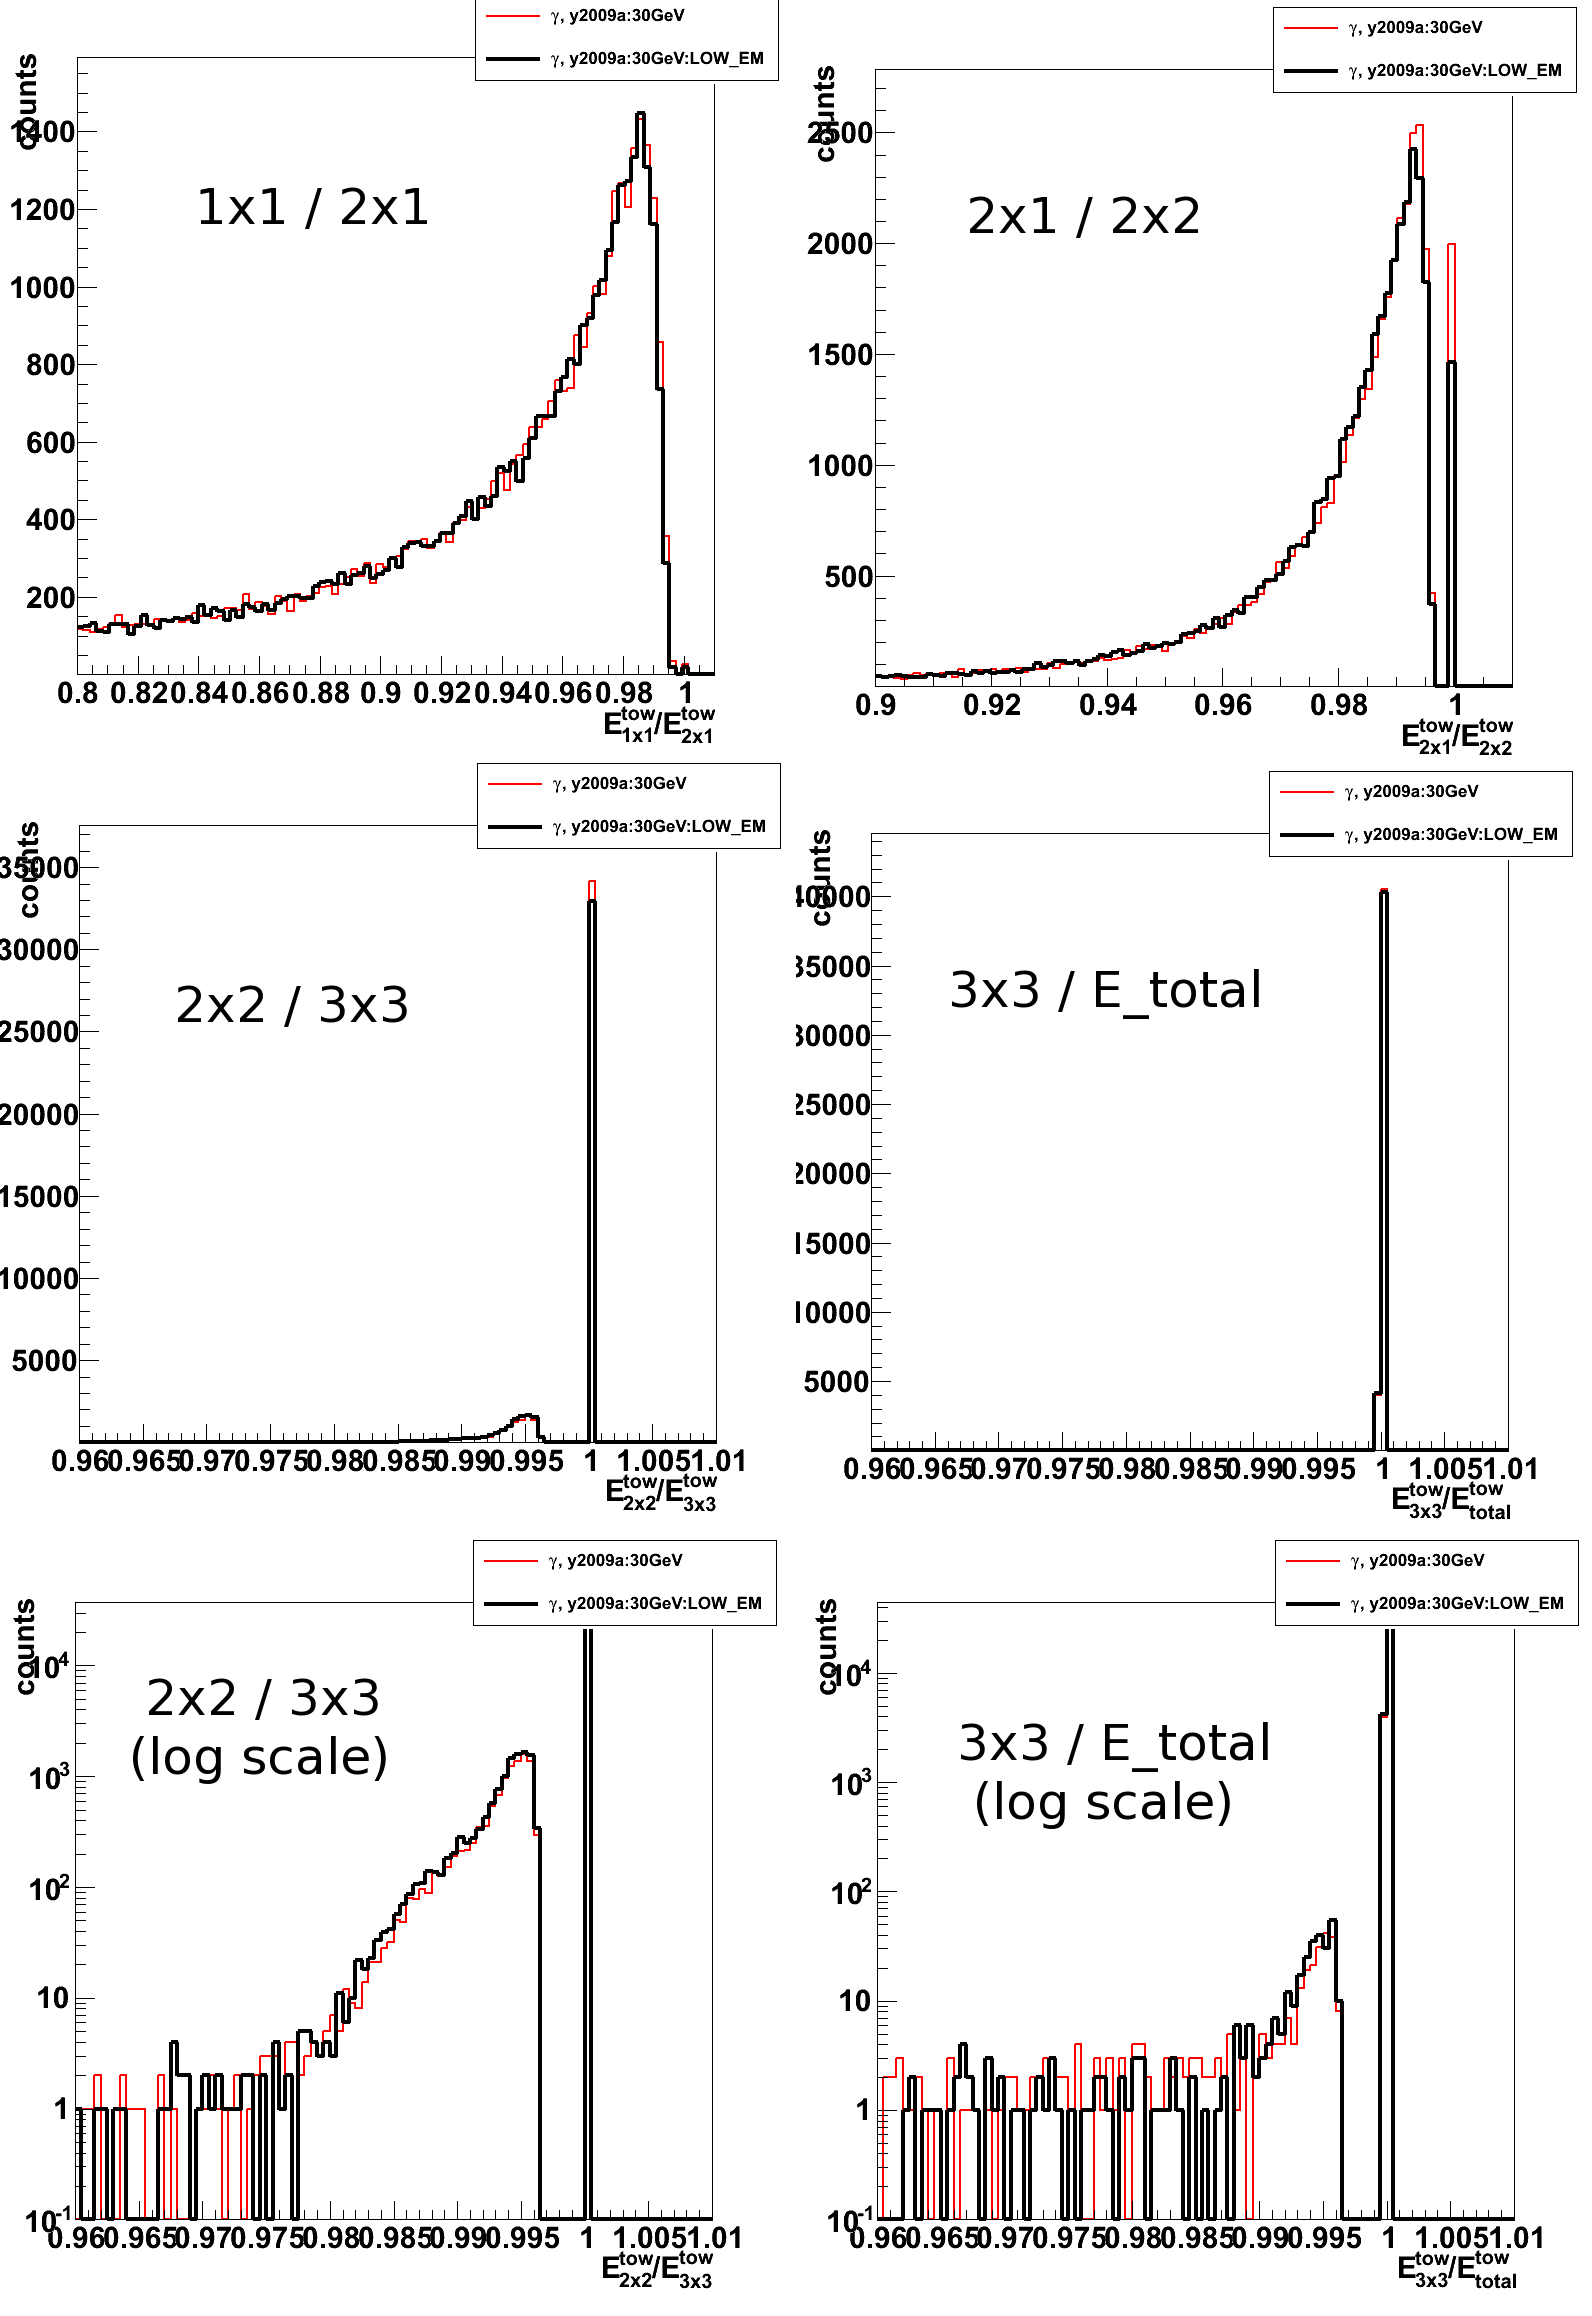
2009.12.07 Low EM study: LOW_EM option, 100KeV cuts, and DCUTE=100KeV
Conclusions/dicsussion at the emc2 hypernew
http://www.star.bnl.gov/HyperNews-star/get/emc2/3369.html
http://www.star.bnl.gov/HyperNews-star/get/emc2/3375.html
Monte-Carlo setup:
- Throwing one photon per event
- Full STAR y2006h (latest EEMC, v6.1 and TPC, v04 geometries)
- Throw particles flat in eta (1.08, 2.0), phi (0, 2pi), and energy (5-35 GeV)
- Using A2Emaker to get reconstructed Tower/SMD energy (no EEMC SlowSimulator in chain)
- Vertex z=0
- ~50K/per particle type
- Non-zero energy: 3 sigma above pedestal
GEANT EM cuts list (default values in GeV)
- CUTGAM - cut for gammas (GEANT default = 0.001)
- CUTELE - cut for electrons (GEANT default = 0.001)
- CUTHAD - cut for charged hadrons (GEANT default = 0.01)
- CUTNEU - cut for neutral hadrons (GEANT default = 0.01)
- CUTMUO - cut for muons (GEANT default = 0.01)
- BCUTE - cut for electron brems (GEANT default = CUTGAM)
- BCUTM - cut for muon brems (GEANT default = CUTGAM)
- DCUTE - cut for electron delta-rays (GEANT default = 10^4)
- DCUTM - cut for muon delta-rays (GEANT default = 10^4)
- LOSS - energy loss
- STRA - energy fluctuation model
- Birks law parameters (Tracking Parameters)
MODEL BIRK1; RKB BIRK2; C BIRK3
Low EM cut configurations (values in GeV)
-
NoCuts: Default STAR geometry EM cuts
Endcap EMC setup is quite non-uniform
(all cuts are set via "Call GSTPAR (ag_imed,'CutName', Value)":- Block EMGT: 30 degree megatile
CUTGAM = 0.00001
CUTELE = 0.00001 - Block ESCI: active scintillator (polystyrene) layer
CUTGAM = 0.00008
CUTELE = 0.001
BCUTE = 0.0001
CUTNEU = 0.001
CUTHAD = 0.001
CUTMUO = 0.001
c-- Define Birks law parameters
BIRK1 = 1.
BIRK2 = 0.013
BIRK3 = 9.6E-6 - Block ELED : lead absorber plate
CUTGAM = 0.00008
CUTELE = 0.001
BCUTE = 0.0001
CUTNEU = 0.001
CUTHAD = 0.001
CUTMUO = 0.001 - Block EALP: thin aluminium plate in calorimeter cell
CUTGAM = 0.00001
CUTELE = 0.00001
LOSS = 1.
STRA = 1. - Block EHMS: defines the triangular SMD strips
CUTGAM = 0.00008
CUTELE = 0.001
BCUTE = 0.0001
c-- Define Birks law parameters
BIRK1 = 1.
BIRK2 = 0.0130
BIRK3 = 9.6E-6
- Block EMGT: 30 degree megatile
- 100KeV: All cuts are set to 100KeV
CUTGAM = 0.0001
CUTELE = 0.0001
BCUTE = 0.0001
BCUTM = 0.0001
DCUTE = 0.0001
DCUTM = 0.0001 - DCUTE: All cuts are set to 10KeV, except electron delta-rays (DCUTE = 100KeV)
CUTGAM = 0.00001
CUTELE = 0.00001
BCUTE = 0.00001
BCUTM = 0.00001
DCUTE = 0.0001
DCUTM = 0.00001 - LOW_EM: All cuts are set to 10KeV
CUTGAM = 0.00001
CUTELE = 0.00001
BCUTE = 0.00001
BCUTM = 0.00001
DCUTE = 0.00001
DCUTM = 0.00001
Figure 1: Endcap EMC sampling fraction for different cluster sizes:
1x1, 2x1, 3x3, and total energy in the EEMC
Lower right plot shows total s.f. vs. photon thrown energy
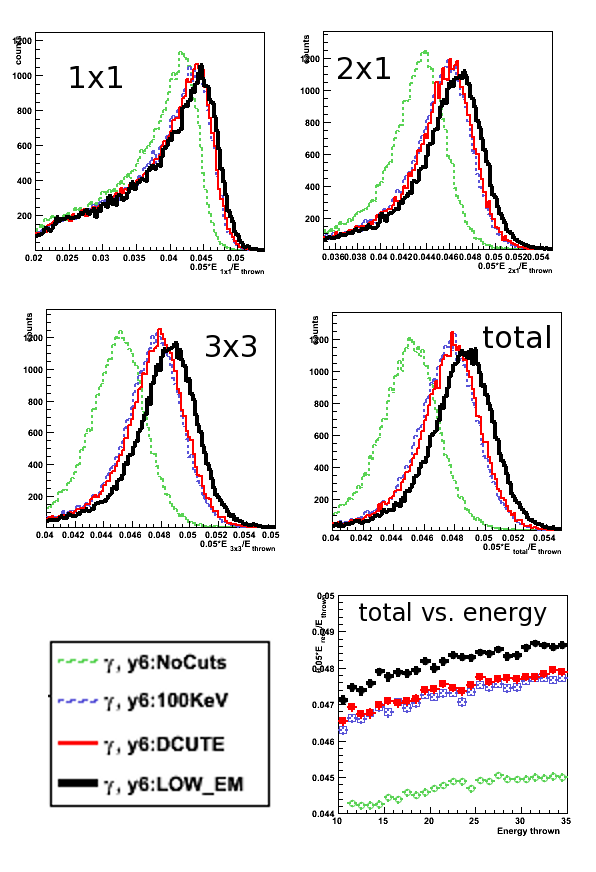
Figure 2: Endcap EMC shower shapes
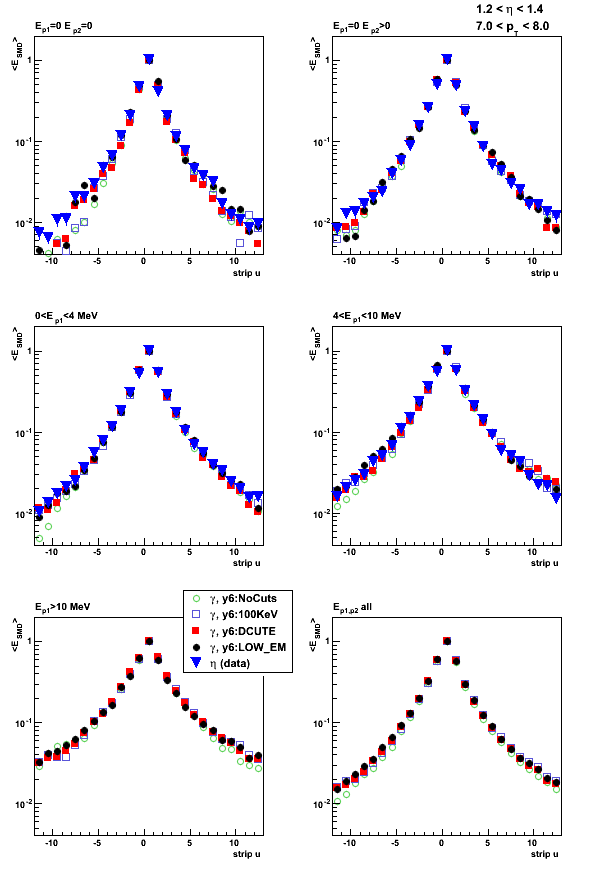
Figure 3: Endcap EMC shower shape ratios
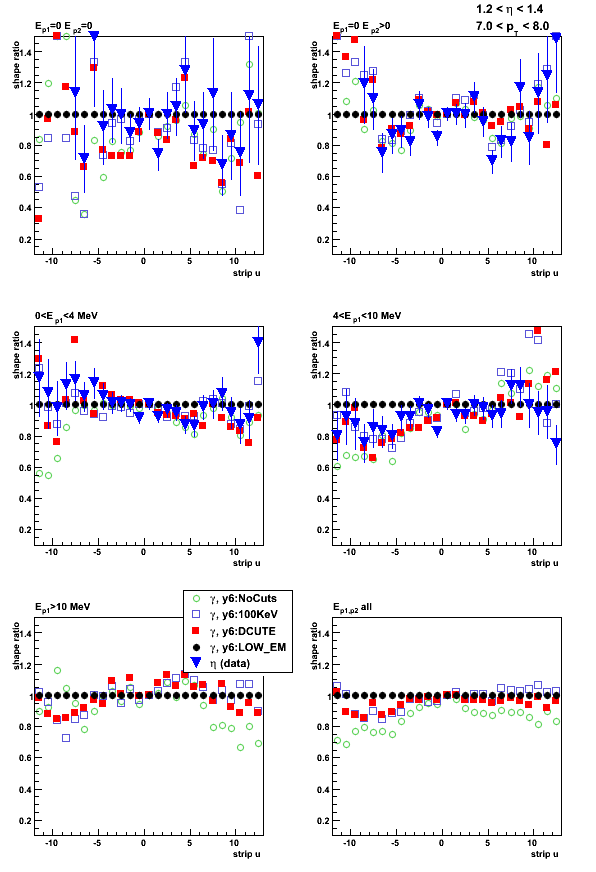
2009.12.08 Low EM timing study: 10KeV vs. 100KeV cut settings
Conclusions/dicsussion at the emc2 hypernew:
http://www.star.bnl.gov/HyperNews-star/get/emc2/3374.html
List of LOW_EM cuts and defaults
Low EM cut configurations (values in GeV)
- NoCuts: Default STAR geometry EM cuts
- LOW_EM:100KeV: All LOW_EM cuts are set to 100KeV
- LOW_EM:10KeV: (default) LOW_EM cuts (10KeV)
- DCUTE: All cuts are set to 10KeV, except for electron delta-rays DCUTE = 100KeV
QCD hard processes timing
Pythia QCD Monte-Carlo:
- Pythia pp@500GeV 2->2 hard QCD processes for parton pt>15GeV
- Full STAR y2009a (latest EEMC, v6.1 and TPC, v04 geometries)
- 50 events per file, 100 jobs
- BFC options and kumac details are here
Figure 1: QCD Total (GEANT/GSTAR+bfc) timing (seconds/event)
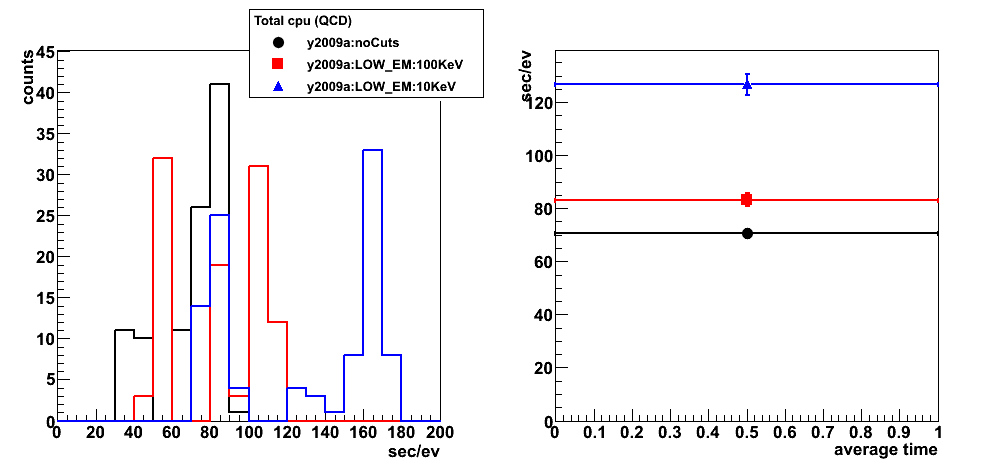
Figure 2: QCD GEANT/GSTAR timing (seconds/event)
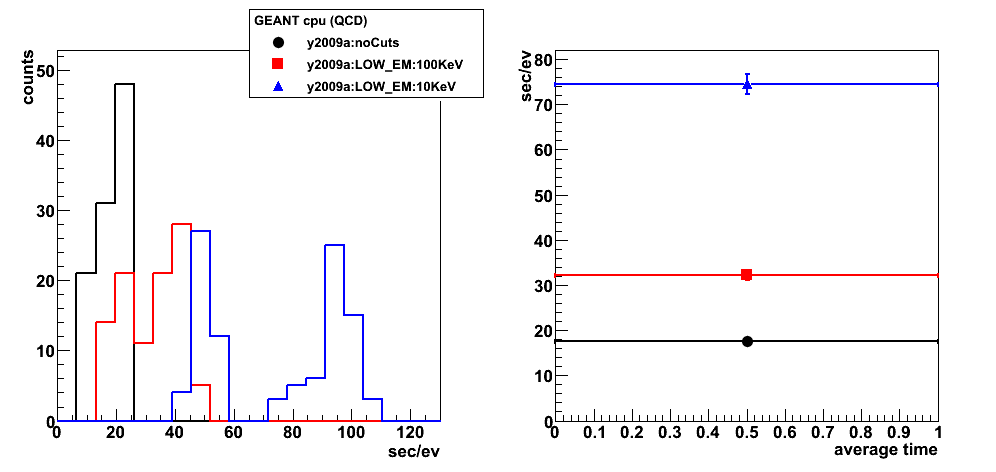
Figure 3: QCD bfc.C timing (seconds/event)
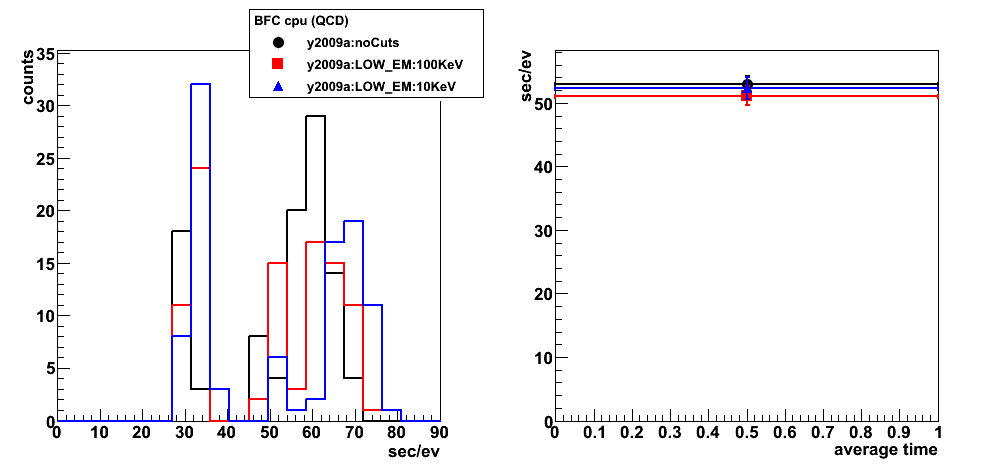
EEMC single photon timing
EEMC single photons Monte-Carlo
- One photon per event
- Full STAR y2006h (latest EEMC, v6.1 and TPC, v04 geometries)
- flat in eta (1.08, 2.0), phi (0, 2pi), and energy (5-35 GeV)
- 250 events per file, 200 jobs
Figure 4: EEMC single photon Total (GEANT/GSTAR+bfc) timing (seconds/event)
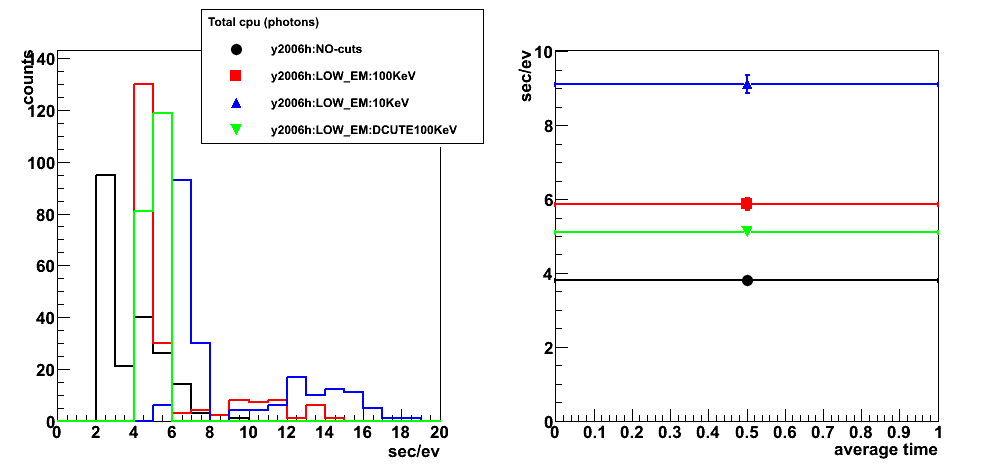
Figure 5: EEMC single photon GEANT/GSTAR timing (seconds/event)

Figure 6: EEMC single photon bfc.C timing (seconds/event)
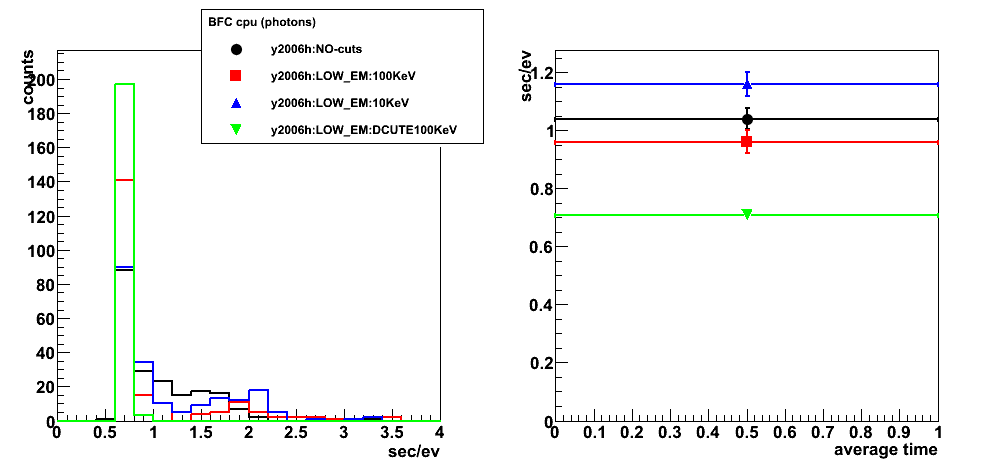
2009.12.17 Ecalgeo-v6.2: embedded LOW_EM cuts in the calorimeter geometry
Monte-Carlo setup:
- Throwing one photon per event
- Full STAR y2006h (latest EEMC-v6.2 and BEMC with LOW_EM cuts, rest of geometry from CVS)
- Throw particles flat in eta (1.08, 2.0), phi (0, 2pi), and energy (5-35 GeV)
- Using A2Emaker to get reconstructed Tower/SMD energy (no EEMC SlowSimulator in chain)
- Vertex z=0
- ~50K/per particle type
- Non-zero energy: 3 sigma above pedestal
Figure 1: (left) Endcap EMC sampling fraction (total calorimeter energy), (right) SMD-u sampling fraction
Red: (previous) ecalgeo-v6.1 with global LOW_EM option
(Note: same points as in this post, Fig. 1 lower left, label y6:LOW_EM)
Black: (new) ecalgeo-v6.2 (embedded LOW_EM cuts), no global LOW_EM option
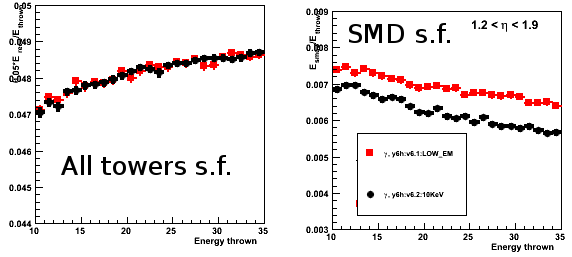
Figure 2: Pre-shower migrations
There is only a few events with pre1>4MeV with new simulations: potential problem with TPC geometry?
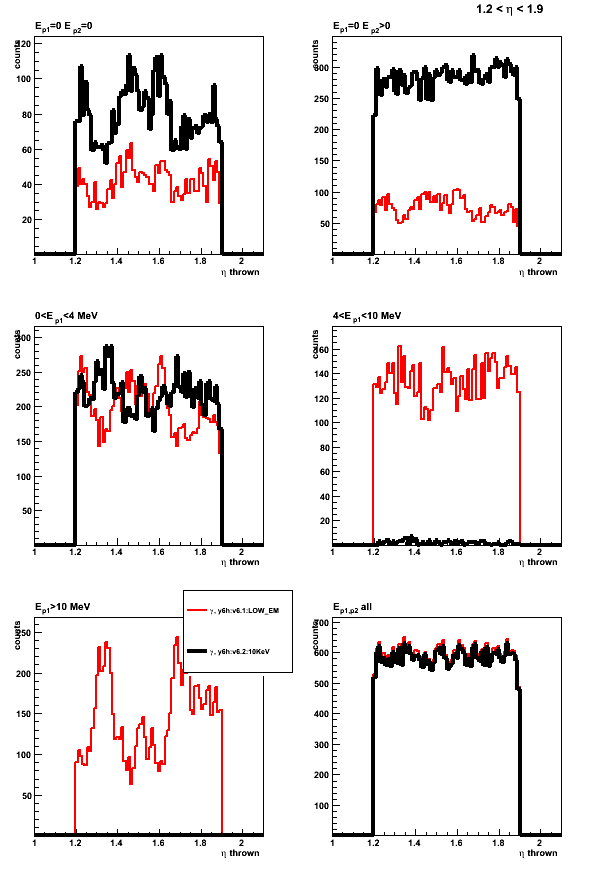
2009.12.20 Ecalgeo-v6.2: embedded LOW_EM cuts after TPC/EEMC overlap fix
Monte-Carlo setup:
- Throwing one photon per event
- Full STAR y2006h (latest EEMC-v6.2 and BEMC with LOW_EM cuts, rest of geometry from CVS)
- Throw particles flat in eta (1.08, 2.0), phi (0, 2pi), and energy (5-35 GeV)
- Using A2Emaker to get reconstructed Tower/SMD energy (no EEMC SlowSimulator in chain)
- Vertex z=0
- ~50K/per particle type
- Non-zero energy: 3 sigma above pedestal
Results: Update for the previous tests of EMC v6.2 geometry after fixing TPC/EEMC overlap
Figure 1: Endcap EMC sampling fraction: total calorimeter energy, pre1-, pre2-, post- shower layers, and SMD-u energy
Red: (previous) ecalgeo-v6.1 with global LOW_EM option
(Note: same points as in this post, Fig. 1 lower left, label y6:LOW_EM)
Black: (new) ecalgeo-v6.2 (embedded LOW_EM cuts), no global LOW_EM option
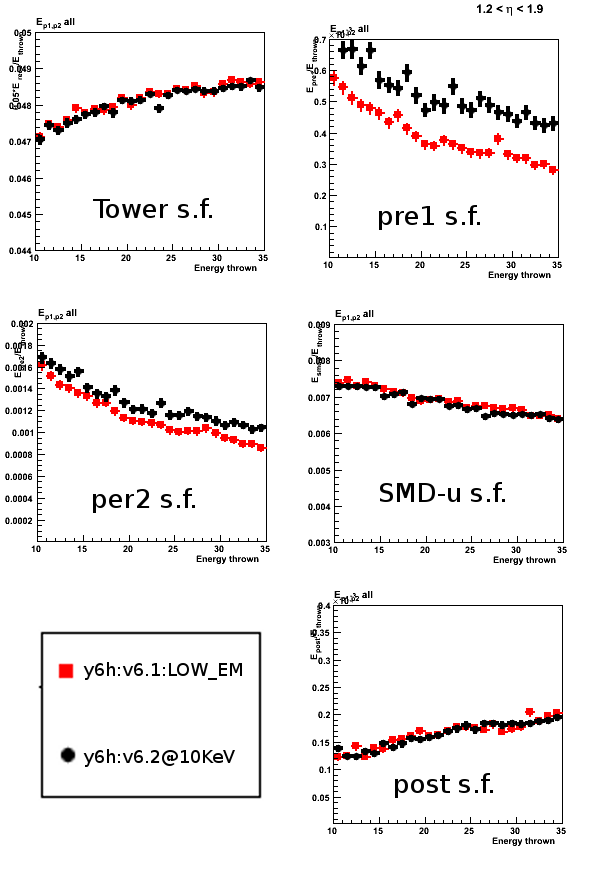
Figure 2: Pre-shower migrations
Change in TPC geometry seems to introduce a reasonable (small) change in pre-shower migration

Photon-jet simulation request
Simulation needs with y2006/y2009 geometry
specific to the photon-jet analysis
* Update version of the previous simulation
request from December 18, 2008 (see Ref. [1])
Understanding effects of trigger, material budget differences,
and throughout comparison between 2006 and 2009 data
requires to have dedicated Monte-Carlo
data samples with both y2006 and y2009 geometries.
Requested samples
We request to produce the following set of
Monte-Carlo samples for the photon-jet analysis:
- S1: 1st priority
Dedicated (gamma filtered, Refs. [2-5]) data sample
for Pythia pp@200GeV prompt photon processes
with y2006 STAR geometry configuration
and partonic pt range 2-25GeV.Simulations configured with:
-
LOW_EM option in starsim (Ref. [6]).
Low cuts on electromagnetic processes in GSTAR -
y2006h geometry tag, which includes
latest Endcap EMC (v6.1) and TPC (v4) geometry fixes. -
Pythia 6.4 CDF Tune A or Perugia tunes (6.4.22)?
-
- S2: 1st priority
Dedicated (gamma filtered, Refs. [2-5]) data sample
for Pythia pp@200GeV hard QCD processes
with y2006 STAR geometry configuration
and partonic pt range 2-25GeV.Same simulation setup as for the sample S1.
- S3: 2nd priority
Pythia pp@200GeV prompt photon and hard QCD
processes with y2009 STAR geometry configuration
and partonic pt range 2-25GeV.Same simulation setup as for the sample S1
but with y2009a geometry tag. -
S4: 3rd priority
Pythia pp@500GeV prompt photon and hard QCD
processes with y2009 STAR geometry configuration
and partonic pt range 2-25GeV.Same simulation setup as for the sample S1
but with y2009a geometry tag.
Event number, CPU time, and disk space estimates
Below I provide some estimates of CPU and disk space
which are required to produce the data samples listed above.
These estimates are based on the previous (private)
production of the MC gamma-filtered events with y2006
geometry which was done at MIT computer cluster
by Michael Betancourt (Ref. [2,4-5]):
- E1 (prompt photons)
Pythia pp@200GeV prompt photon simulations
with ~7 pb^-1 luminosity:-
~60 days running time on a single CPU
-
~17Gb of disk space to store MuDst/geant files
-
Number of (filtered) events:
~ 30K for pt range 6-9GeV
~ 15K for pt range 9-15GeV
-
- E2 (QCD hard process)
Pythia pp@200 QCD hard process simulations
with (at least) 1 pb^-1 luminosity:-
~ 620 days running on a single CPU
(less than a week on a cluster with 100 CPUs) -
~ 150Gb of disk space to store MuDst/geant files
-
Number of (filtered) events:
~ 650K for pt range 6-9GeV
~ 300K for pt range 9-15GeV
-
Notes on the estimates:
- N1
Enabling LOW_EM option in GSTAR increases
the time estimates by ~40% (Ref. [7]). - N2
Additional production of jet trees will
require a disk space on the order of < 2%
of the total size of the MuDst/geant files. - N3
Additional production of gamma trees will also
require a disk space on the order of a few percents
of the total size of the MuDst/geant files.
References
-
Previous simulation request (Date: 2008, Dec 18):
http://www.star.bnl.gov/HyperNews-star/protected/get/starspin/3596.html -
Michael's document on
"Targeted MC procedure for the gamma-jet program at STAR":
http://drupal.star.bnl.gov/STAR/system/files/20080729_gammaFilter_by_MichaelBetancourt.pdf -
simulations with filtering readiness:
http://www.star.bnl.gov/HyperNews-star/protected/get/starsimu/387/1/1/2/1/1/2/3/1.html -
Filtered photon production with y2006 geometry:
http://www.star.bnl.gov/HyperNews-star/protected/get/phana/256.html -
More details on statistics needed and disk space estimates:
http://www.star.bnl.gov/HyperNews-star/protected/get/phana/297.html -
LOW_EM option in GSTAR:
http://www.star.bnl.gov/HyperNews-star/protected/get/phana/371.html -
Time estimates with and without LOW_EM option:
2010
Year 2010 posts
01 Jan
January 2010 posts
2010.01.04 y2006 vs y2009 EEMC pre-shower migration
Monte-Carlo setup:
- Throwing one photon per event
- Full STAR y2006h/y2009a
- Throw particles flat in eta (1.08, 2.0), phi (0, 2pi), and energy (5-35 GeV)
- Using A2Emaker to get reconstructed Tower/SMD energy (no EEMC SlowSimulator in chain)
- Vertex z=0
- ~50K/per particle type
- Non-zero energy: 3 sigma above pedestal
Geometry configurations:
- y6h:v6.2:10KeV y2006h after fixing TPC/EEMC overlap (CVS:2009/12/17)
- y6h:10KeV y2006h Mising TPC material bug is resolved (CVS:2009/12/29)
- y9a:10KeV y2009a after Mising TPC material bug is resolved (CVS:2009/12/29)
Note: results are with CVS before "15Deg rotated volume" bug being fixed
Figure 1:Pre-shower migration: y2006h (red - CVS:2009/12/17) vs. y2006h (black - CVS:2009/12/29)

Figure 2: Pre-shower migration: y2006h (red) vs. y2009a (black) all with CVS:2009/12/29

2010.01.07 EEMC response to single photons with y2006h vs y2009a geometries
Monte-Carlo setup
- Throwing one photon per event
- Full STAR y2006h/y2009a configurations
- Throw particles flat in eta (1.08, 2.0), phi (0, 2pi), and energy (5-35 GeV)
- Using A2Emaker to get reconstructed Tower/SMD energy (no EEMC SlowSimulator in chain)
- Vertex z=0
- ~50K/per particle type
- Non-zero energy: 3 sigma above pedestal
Geometry configurations:
- y6h:10KeV (black) - y2006h with emc_10KeV
- y9a:10KeV (red) - y2009a with emc_10KeV
STAR geometry includes the latest "15Deg rotated volume" bug bug fix
Figure 1: EEMC sampling fraction
(left) vs. thrown photon energy (with 1.2 < eta < 1.9 cut)
(right) vs. thrown photon eta
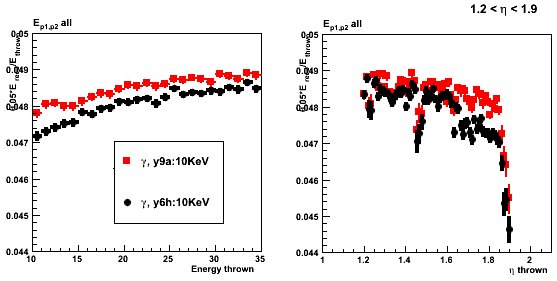
Figure 2: 2x1/3x3 clustering

Figure 3: Shower shapes (u plane)
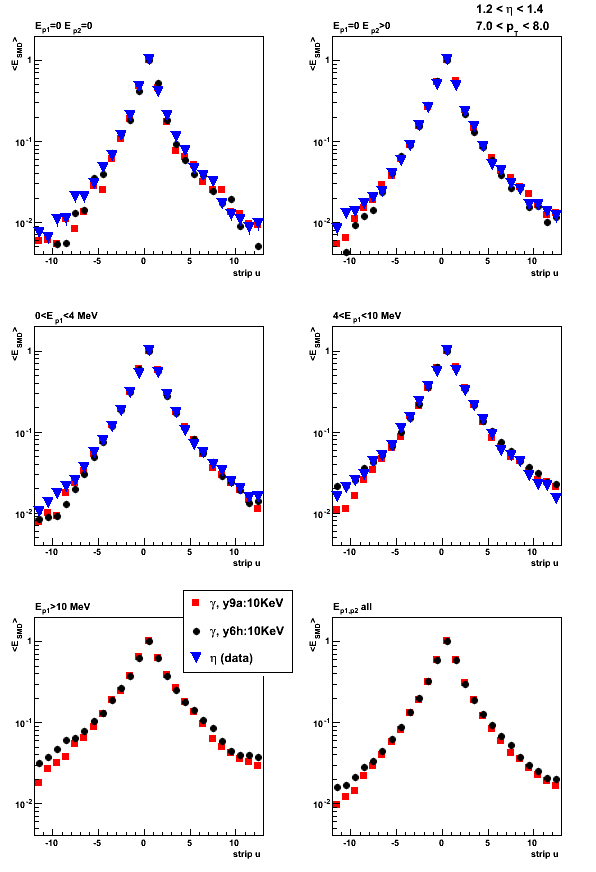
Figure 4: Shower shape ratios (u plane)

Figure 5: Pre-shower migration (1.2 < eta < 1.9)
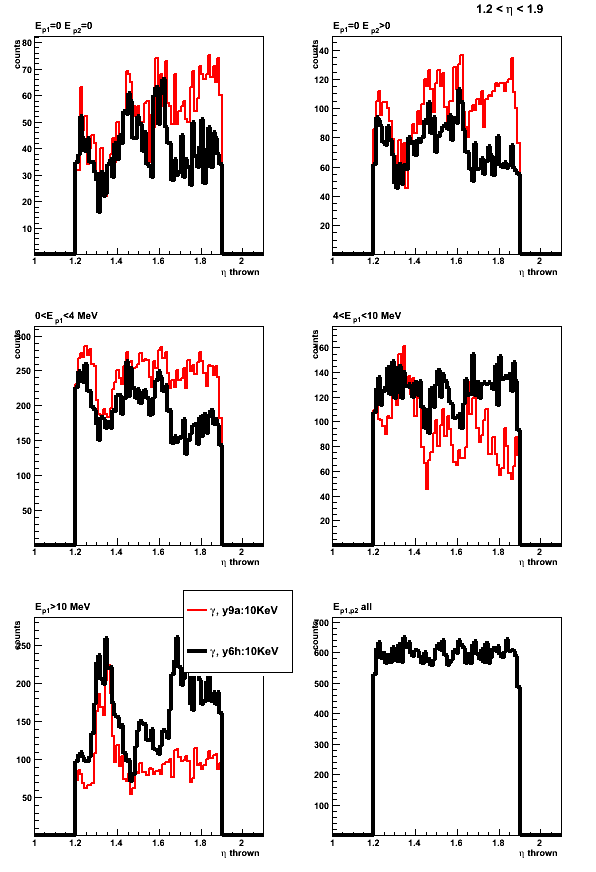
Figure 6: Average pre-shower1 energy vs. thown photon position in EEMC
(left) y2009a with emc_10KeV
(right) y2006h with emc_10KeV
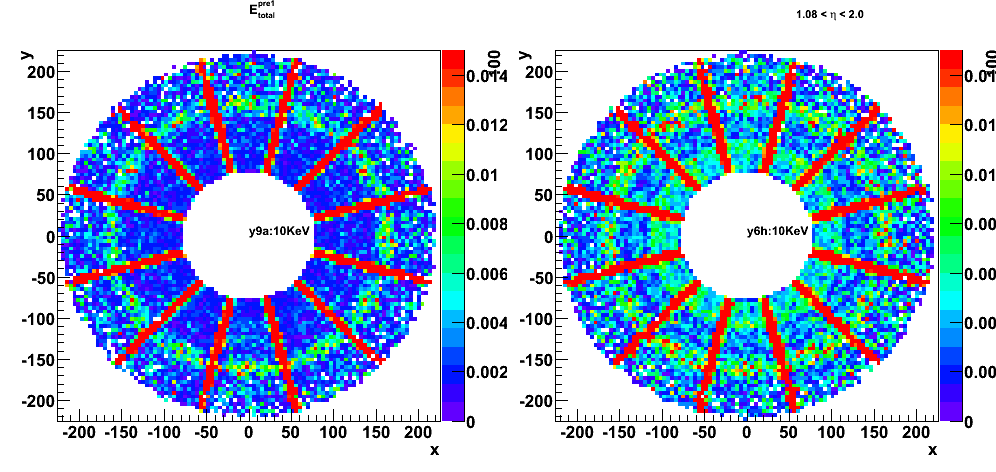
2010.01.08 EEMC response 2006 vs. 2009: phi cuts
EEMC migration plots with cuts on TPC sector boundaries
Click here for results before phi cuts
Monte-Carlo setup
- Throwing one photon per event
- Full STAR y2006h/y2009a configurations
- Throw particles flat in eta (1.08, 2.0), phi (0, 2pi), and energy (5-35 GeV)
- Using A2Emaker to get reconstructed Tower/SMD energy (no EEMC SlowSimulator in chain)
- Vertex z=0
- ~50K/per particle type
- Non-zero energy: 3 sigma above pedestal
Geometry configurations:
- y6h:10KeV (black) - y2006h with emc_10KeV option
- y9a:10KeV (red) - y2009a with emc_10KeV option
Figure 1: Average pre-shower1 energy vs. thown photon position in EEMC
with cuts on TPC sector boundaries: cos(12*(phi-Pi/6.)) < -0.65 (similar plot before phi cuts)
(left) y2009a with emc_10KeV
(right) y2006h with emc_10KeV
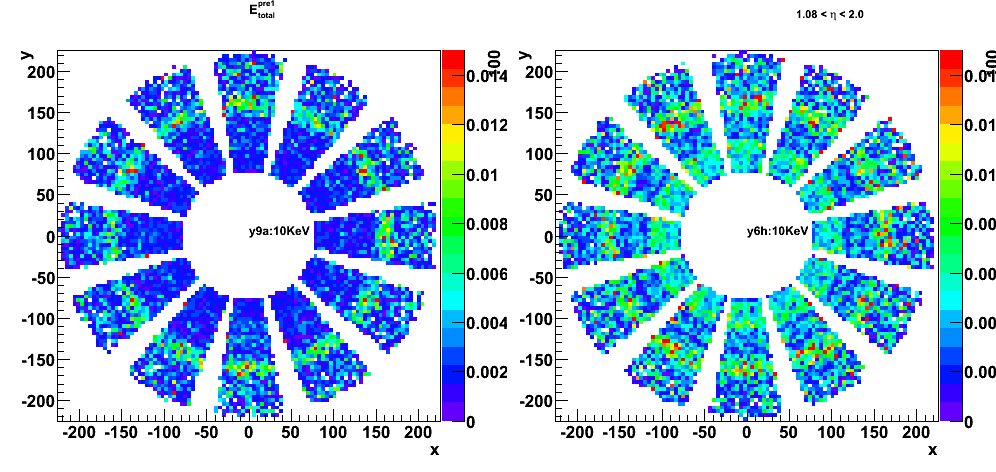
Figure 2: Pre-shower 1 sampling fraction (E_pre1/E_thrown) vs. thrown eta
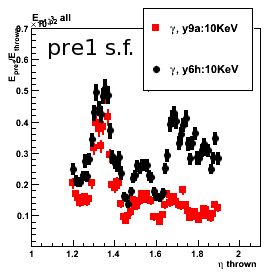
Figure 3: EEMC sampling fraction
(left) vs. thrown photon energy (with 1.2 < eta < 1.9 cut)
(right) vs. thrown photon eta
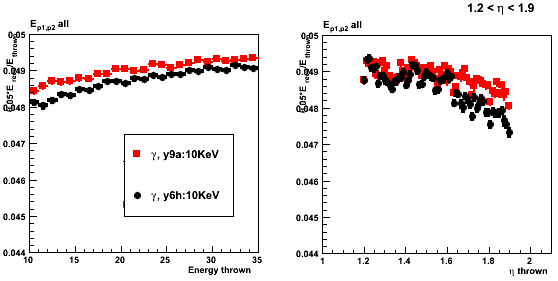
Figure 4: Pre-shower migration (1.2 < eta < 1.9)
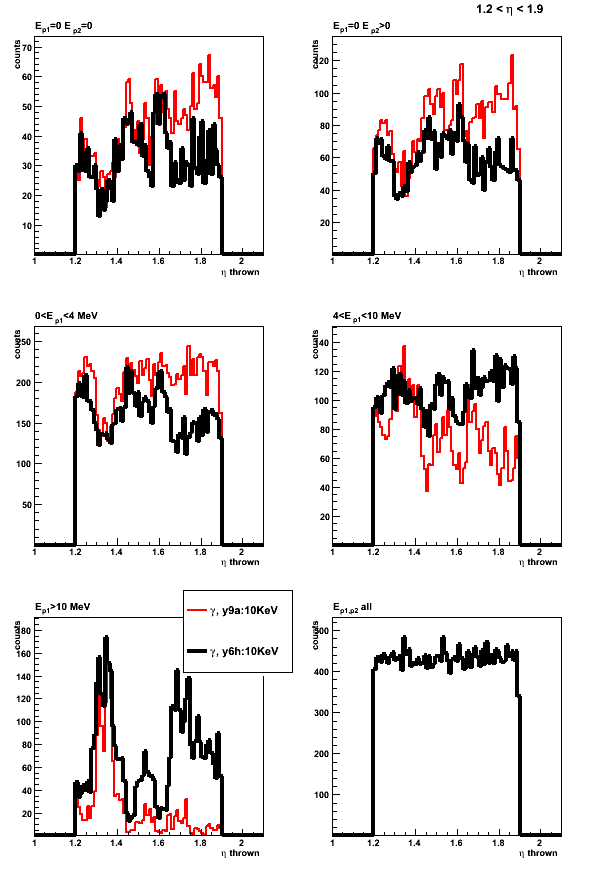
2010.01.12 W test sample QA
All plost from second (with vertex distribution) test W-sample from Lidia/Jason.
generated files are from /star/rcf/test/Wprod_test2/
The previous sample with fixed (zero) vertex can be found was announced here:
http://www.star.bnl.gov/HyperNews-star/protected/get/starsimu/435.html
Figure 1: Electron from W decay (a) eta, (b) phi, (c) pt and (d) energy distributions
from geant record (no kinematic cuts)


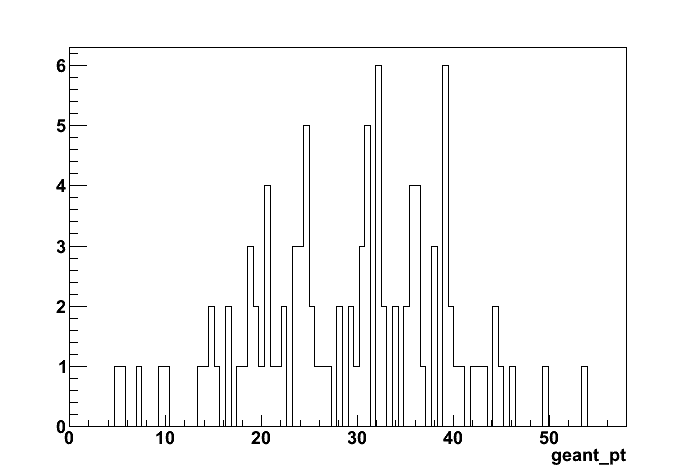
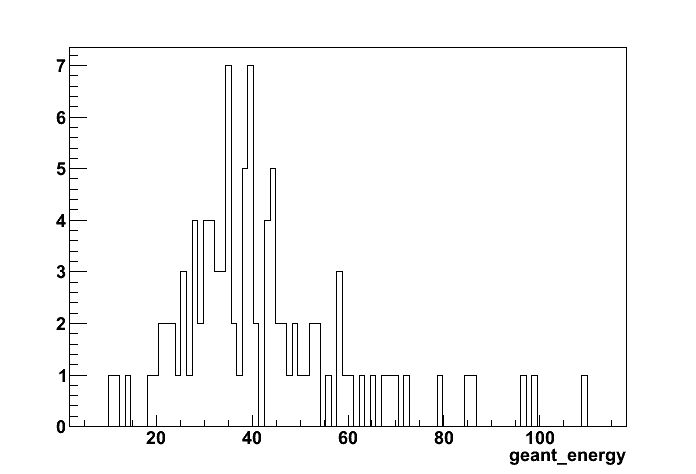
Figure 2: Reconstructed vs. geant vertex (Cuts: abs(geant_eta_electron) < 1)
(left) difference, (right) ratio
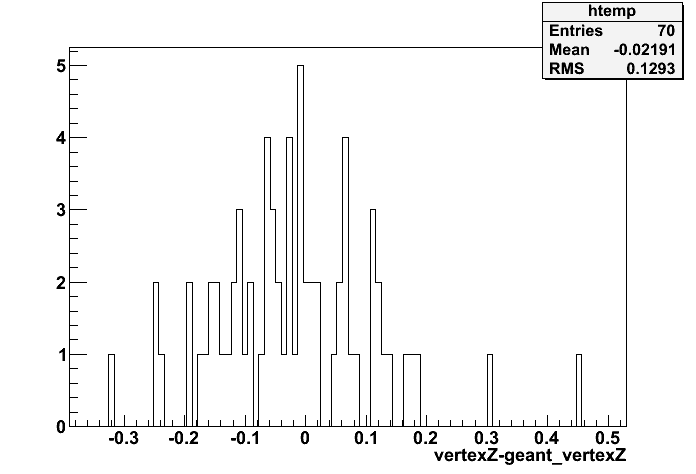

Figure 3:
(left) Correlation between thrown and reconsructed energy: abs(geant_eta_electron) < 1
(right) ratio of the reconsructed to thrown energy (Bemc_Etow > 25)
Reconstructed energy is the total energy in all Barrel towers
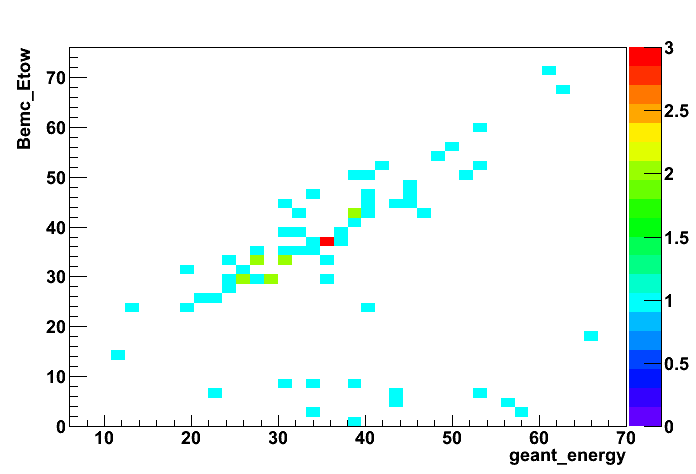
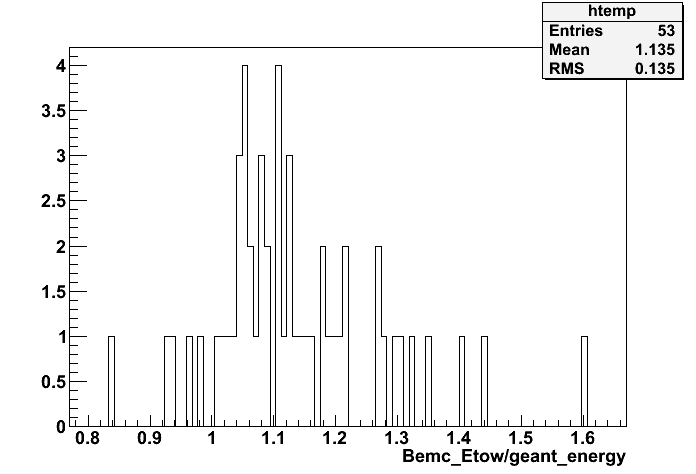
Data base setup
The follwoing DB tables are used to read MuDst (dbMk->SetDateTime(20090325,0)):
StEmcSimulatorMaker:INFO - loaded a new bemcPed table with beginTime 2009-03-24 22:16:13 and endTime 2009-03-26 06:03:44
StEmcSimulatorMaker:INFO - loaded a new bemcStatus table with beginTime 2009-03-24 02:16:58 and endTime 2009-03-26 04:07:02
StEmcSimulatorMaker:INFO - loaded a new bemcCalib table with beginTime 2008-12-15 00:00:02 and endTime 2037-12-31 12:00:00
StEmcSimulatorMaker:INFO - loaded a new bemcGain table with beginTime 1999-01-01 00:08:00 and endTime 2037-12-31 12:00:00
StEmcSimulatorMaker:INFO - loaded a new bprsPed table with beginTime 2008-03-04 10:30:56 and endTime 2037-12-31 12:00:00
StEmcSimulatorMaker:INFO - loaded a new bprsStatus table with beginTime 2008-12-15 00:00:00 and endTime 2037-12-31 12:00:00
StEmcSimulatorMaker:INFO - loaded a new bprsCalib table with beginTime 1999-01-01 00:10:00 and endTime 2037-12-31 12:00:00
StEmcSimulatorMaker:INFO - loaded a new bprsGain table with beginTime 1999-01-01 00:08:00 and endTime 2037-12-31 12:00:00
StEmcSimulatorMaker:INFO - loaded a new bsmdePed table with beginTime 2009-03-24 15:42:29 and endTime 2009-03-25 11:24:55
StEmcSimulatorMaker:INFO - loaded a new bsmdeStatus table with beginTime 2009-03-24 15:42:29 and endTime 2009-03-25 11:24:55
StEmcSimulatorMaker:INFO - loaded a new bsmdeCalib table with beginTime 2002-11-14 00:01:00 and endTime 2037-12-31 12:00:00
StEmcSimulatorMaker:INFO - loaded a new bsmdeGain table with beginTime 1999-01-01 00:08:00 and endTime 2037-12-31 12:00:00
StEmcSimulatorMaker:INFO - loaded a new bsmdpPed table with beginTime 2009-03-24 15:42:29 and endTime 2009-03-25 11:24:55
StEmcSimulatorMaker:INFO - loaded a new bsmdpStatus table with beginTime 2009-03-24 15:42:29 and endTime 2009-03-25 11:24:55
StEmcSimulatorMaker:INFO - loaded a new bsmdpCalib table with beginTime 2002-11-14 00:01:00 and endTime 2037-12-31 12:00:00
StEmcSimulatorMaker:INFO - loaded a new bsmdpGain table with beginTime 1999-01-01 00:08:00 and endTime 2037-12-31 12:00:00
StEmcSimulatorMaker:INFO - loaded a new bemcTriggerStatus table with beginTime 2009-03-23 07:50:04 and endTime 2009-04-01 18:10:03
StEmcSimulatorMaker:INFO - loaded a new bemcTriggerPed table with beginTime 2009-03-20 04:11:43 and endTime 2009-03-30 20:00:05
StEmcSimulatorMaker:INFO - loaded a new bemcTriggerLUT table with beginTime 2009-03-23 07:50:04 and endTime 2009-04-03 22:08:11
2010.01.13 W test sample QA: Pass 2
http://drupal.star.bnl.gov/STAR/node/16704
QA of the test W-sample from Lidia/Jason.
generated MuDst are from /star/simu/jwebb/01-11-2010-w-test-production/
QA plots for the previous pass can be found here
Two channels being analyzed:
- wtest10000 W+ --> e+ nu (shown by black line)
- wtest10001 W- --> e- nu (shown by red line)
Cuts: |geant_eta_lepton| < 1
Discussions can be found here:
http://www.star.bnl.gov/HyperNews-star/protected/get/starsimu/440.html
Figure 1: (left) Reconstructed vertex z distribution
(right) reconstructed minus geant z-vertex
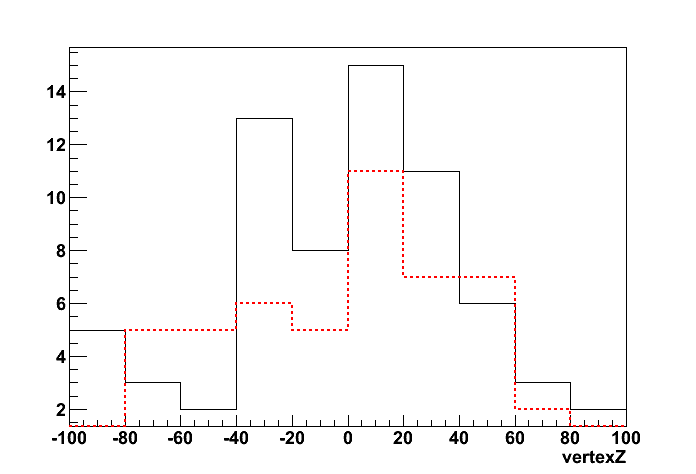

Figure 2: E2x2/E_geant energy ratio
Black: positron from W+, mean value= 0.972973;
Red - electron from W- mean value = 0.969773
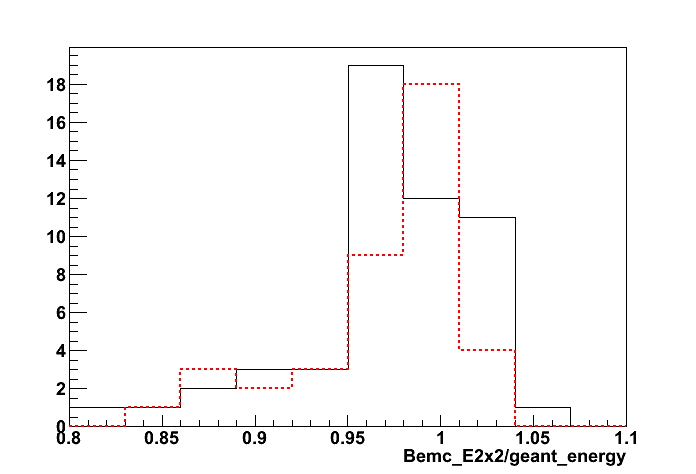
Figure 3: E1x1/E_geant (highest tower) energy ratio
Black: positron from W+, mean value= 0.815287;
Red - electron from W- mean value = 0.812098
![]()
Update on Jan 14, 2010
Figure 4: Lepton E2x2/E_geant energy ratio
| Parameter | black: positron from W+ | red: electron from W- |
| gaus-Constant | 1.60709e+01 , err=3.08565e+00 | 1.56834e+01 , err=4.71967e+00 |
| gaus-Mean | 9.85514e-01 , err=4.94309e-03 | 9.86118e-01 , err=5.43577e-03 |
| gaus-Sigma | 3.15205e-02 , err=3.73952e-03 | 2.52009e-02 , err=6.57793e-03 |
| Hist-Mean | 0.972973 | 0.969773 |
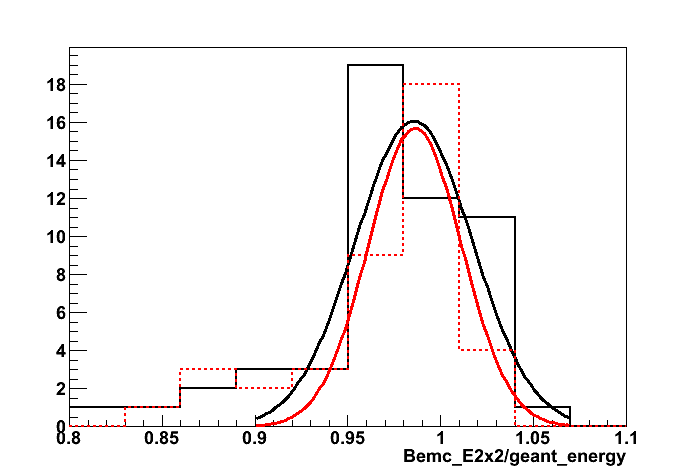
Figure 5: Lepton E3x3/E_geant energy ratio
| Parameter | black: positron from W+ | red: electron from W- |
| gaus-Constant | 1.48719e+01 , err=2.82186e+00 | 1.35741e+01 , err=3.36776e+00 |
| gaus-Mean | 9.89924e-01 , err=5.72959e-03 | 9.83056e-01 , err=6.28736e-03 |
| gaus-Sigma | 3.37758e-02 , err=4.24983e-03 | 3.00597e-02 , err=6.06841e-03 |
| Hist-Mean | 0.975662 | 0.974163 |
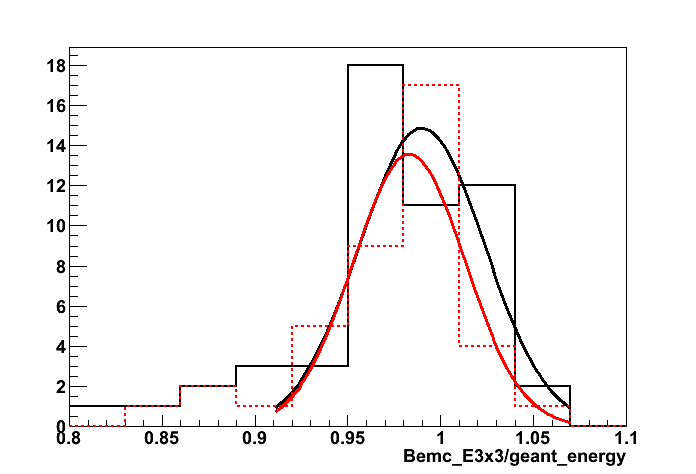
2010.01.15 W test sample QA: Pass 3
QA of the test W-sample from Lidia/Jason.
generated MuDst are from /star/data08/users/starreco/recowtest/
QA plots for the previous pass 2 can be found here
QA plots for the previous pass 1 can be found here
Two channels being analyzed:
- wtest10000 W+ --> e+ nu (shown by black line)
- wtest10001 W- --> e- nu (shown by red line)
Cuts: |geant_eta_lepton| < 1
Discussions can be found here:
http://www.star.bnl.gov/HyperNews-star/protected/get/starsimu/443.html
Figure 1: Reconstructed minus geant z-vertex
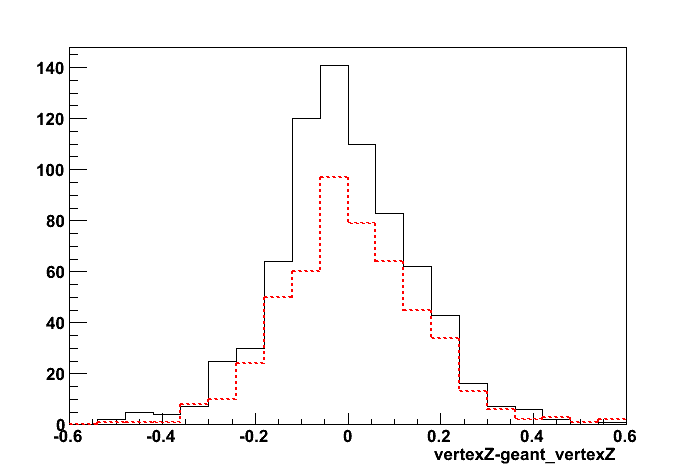
Figure 2: Lepton E2x2/E_geant energy ratio
| Parameter | black: positron from W+ | red: electron from W- |
| gaus-Constant | 6.24023e+01 , err=3.46979e+00 | 4.73536e+01 , err=3.16029e+00 |
| gaus-Mean | 9.79982e-01 , err=1.69854e-03 | 9.79787e-01 , err=1.68813e-03 |
| gaus-Sigma | 3.52892e-02 , err=1.40963e-03 | 3.15336e-02 , err=1.40759e-03 |
| Hist-Mean | 0.972122 | 0.975073 |

Figure 3: Lepton E3x3/E_geant energy ratio
| Parameter | black: positron from W+ | red: electron from W- |
| gaus-Constant | 6.33596e+01 , err=3.58862e+00 | 4.72335e+01 , err=3.19552e+00 |
| gaus-Mean | 9.83287e-01 , err=1.72276e-03 | 9.83632e-01 , err=1.67661e-03 |
| gaus-Sigma | 3.45514e-02 , err=1.48019e-03 | 3.05224e-02 , err=1.38944e-03 |
| Hist-Mean | 0.974372 | 0.977858 |
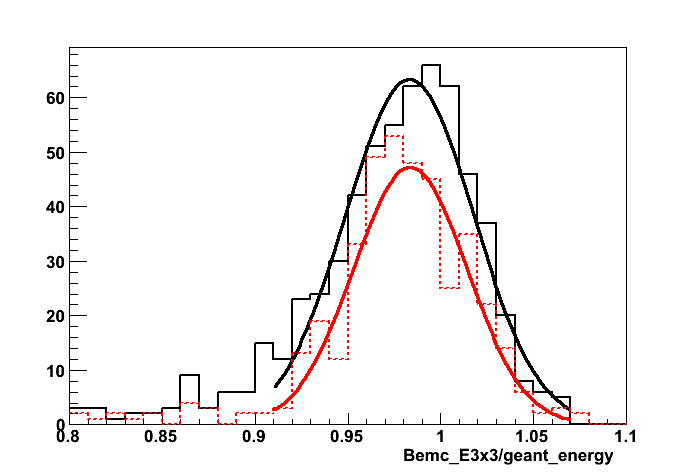
2010.01.18 EEMC response 2006 vs. 2009: typo in TPC volume size bug fix
Click here for previous study before TPC typo fix
Monte-Carlo setup
- Throwing one photon per event
- Full STAR y2006h/y2009a configurations
- Throw particles flat in eta (1.08, 2.0), phi (0, 2pi), and energy (5-35 GeV)
- Using A2Emaker to get reconstructed Tower/SMD energy (no EEMC SlowSimulator in chain)
- Vertex z=0
- ~50K/per particle type
- Non-zero energy: 3 sigma above pedestal
Before and after the fix comparison
Geometry configurations:
- y6h:10KeV:old (red) - y2006h with emc_10KeV option
- y6h:10KeV (black) - y2006h with emc_10KeV option, after TPC typo fixed
Figure 1: Pre-shower migration (1.2 < eta < 1.9)
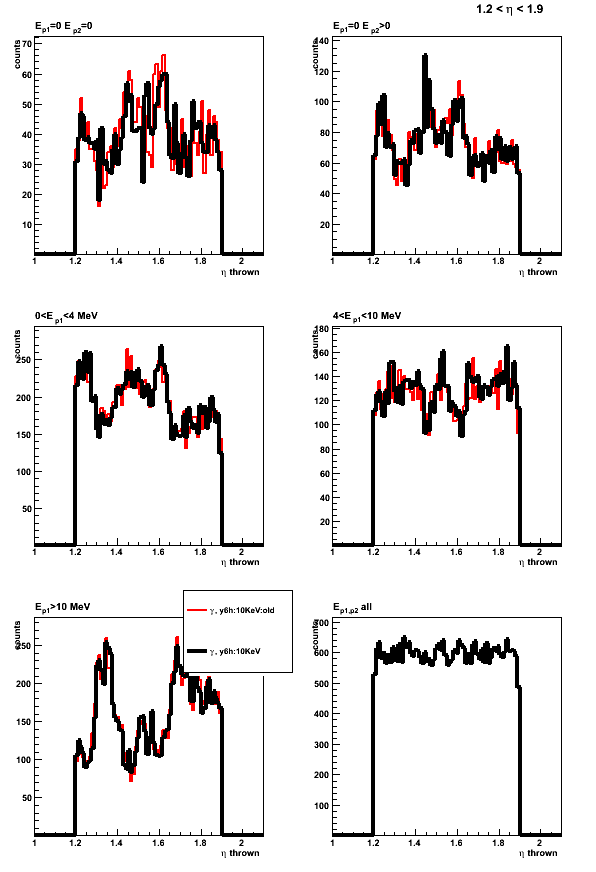
y2006h vs. y2009a comparison after a TPC typo fix
Geometry configurations:
- y9a:10KeV (red) - y2009a with emc_10KeV option
- y6h:10KeV (black) - y2006h with emc_10KeV option
Figure 2: Pre-shower migration (1.2 < eta < 1.9): y2006h vs. y2009a

2010.01.18 W test sample: Cluster ratios and skewed gaussian fits
W test sample from Lidia/Jason. MuDst's from /star/data08/users/starreco/recowtest/
Two channels being analyzed:
- wtest10000 W+ -> e+ nu
- wtest10001 W- -> e- nu
Figure 1: Lepton yield vs. rapidity (no cuts)
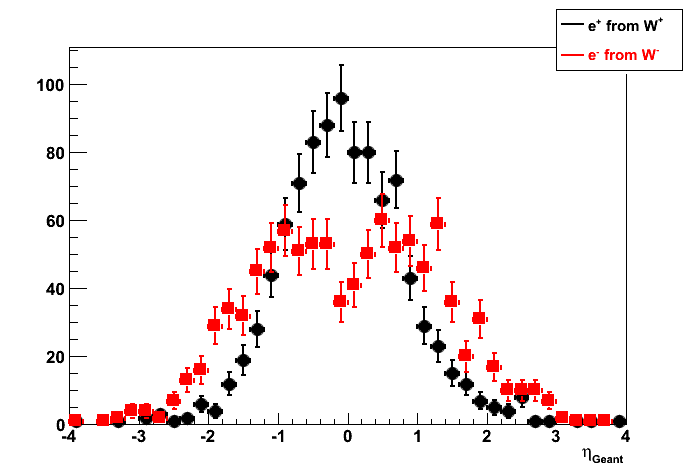
Figure 2: Lepton yield vs. pt and energy
(left) no rapidity cuts
(right) |lepton_eta| < 1
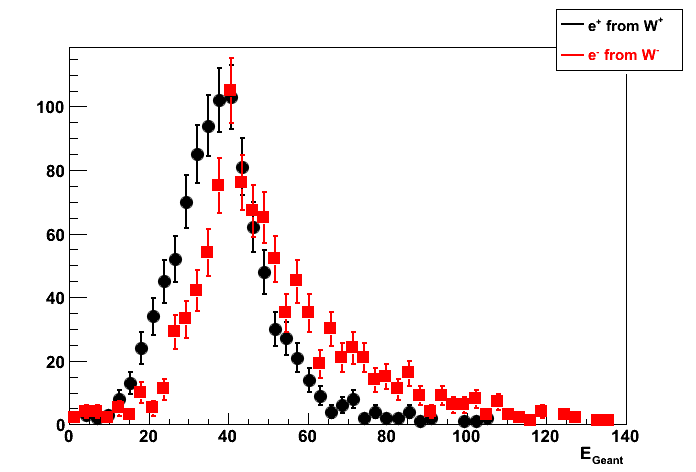
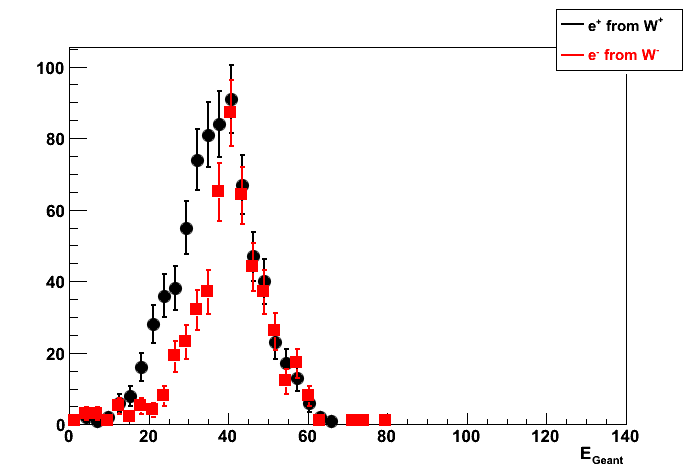
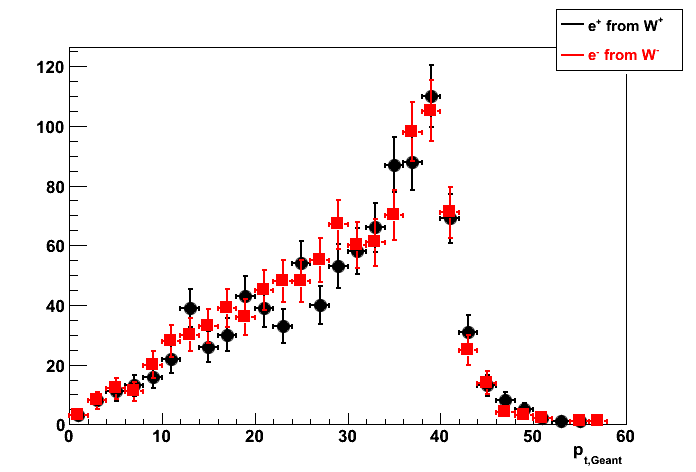

Cluster energy vs. original lepton energy
All plots below with |lepton_eta| < 1
Skewed gaussian fits: [const]*exp(-0.5*((x-[mean])/([sigma]*(1+[skewness]*(x-[mean]))))**2)
Figure 3: Lepton E1x1/E_geant energy ratio
![]()
Figure 4: Lepton E2x2/E_geant energy ratio
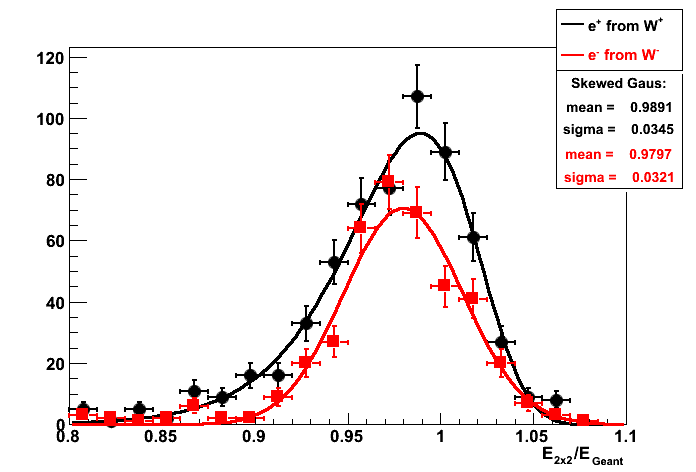
Figure 5: Lepton E3x3/E_geant energy ratio
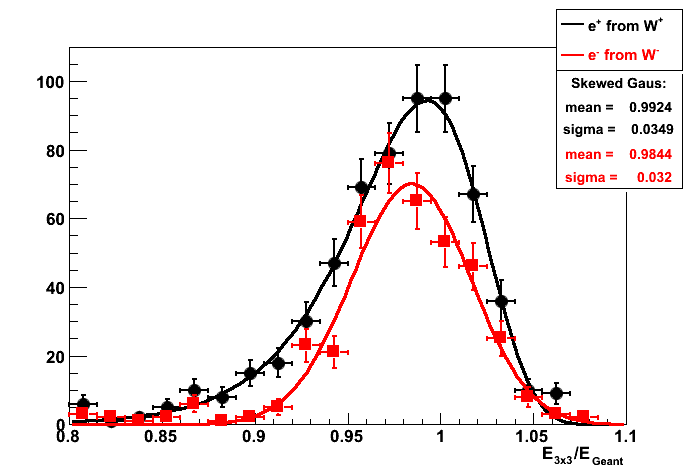
2010.01.26 Endcap/Barrel clustering with official W-MC
Simulations: official pp 500GeV pythia W production
Two channels being analyzed:
- W+ -> e+ nu (rcf10010*.root)
- W- -> e- nu (rcf10011*.root)
Lepton from W in the Endcap: 1.2 < eta_lepton < 1.9
Figure 1: Lepton yield vs. energy

Figure 2: Lepton (left) E1x1/E_thrown and (right) E2x2/E_thrown energy ratio
Skewed gaussian fits: [const]*exp(-0.5*((x-[mean])/([sigma]*(1+[skewness]*(x-[mean]))))**2)
![]()

Figure 3: Endcap EMC lepton E3x3/E_thrown energy ratio
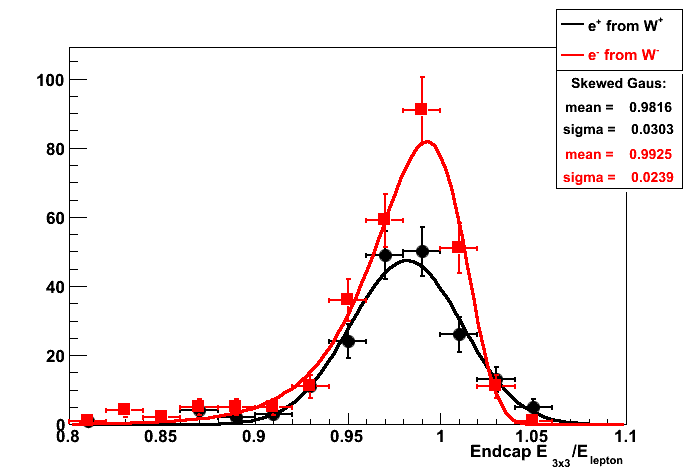
Figure 4: Endcap 2x2 sampling fraction (s.f.) vs. thrown lepton (left) energy and (right) eta
S.f. is defined as an average E_2x2/E_thrown for E_2x2/E_thrown>0.8

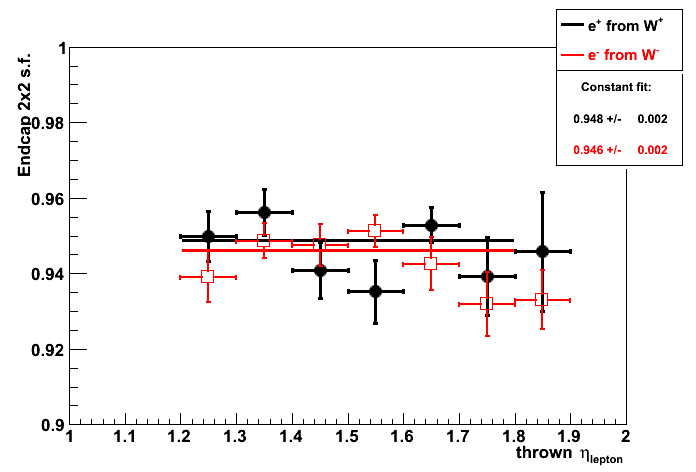
Figure 5: Endcap 3x3 sampling fraction (s.f.) vs. thrown lepton (left) energy and (right) eta
S.f. is defined as an average E_3x3/E_thrown for E_3x3/E_thrown>0.8
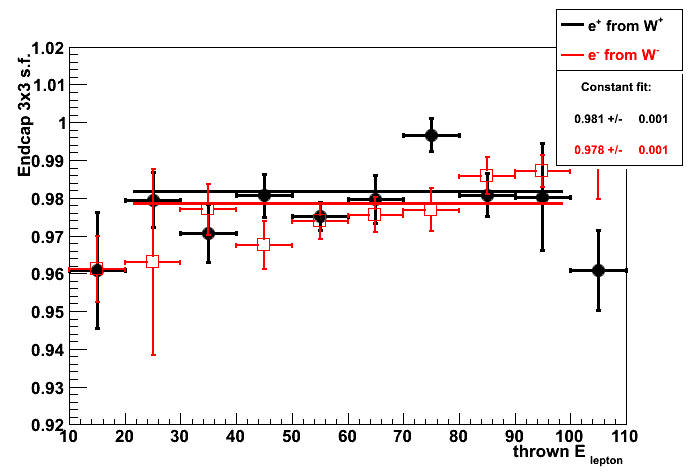

Lepton from W in the Barrel: |eta_lepton| <1
Figure 6: Lepton yield vs. energy
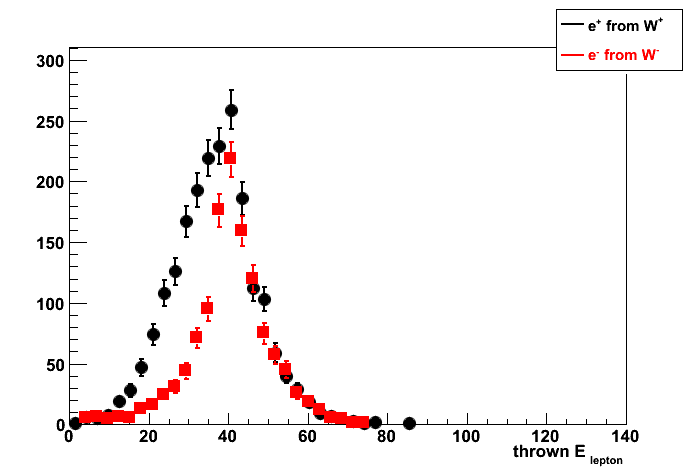
Figure 7: Lepton (left) E1x1/E_thrown and (right) E2x2/E_thrown energy ratio
![]()

Figure 8: Barrel EMC lepton E3x3/E_thrown energy ratio
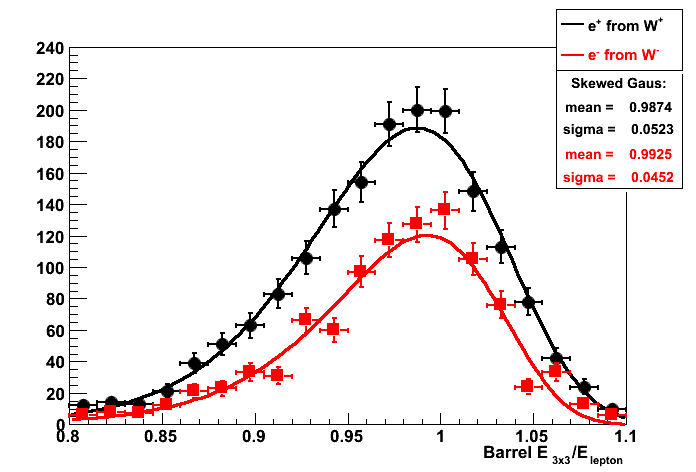
Figure 9: Barrel 2x2 s.f. vs. thrown lepton (left) energy and (right) eta
S.f. is defined as an average E_2x2/E_thrown for E_2x2/E_thrown>0.8


Figure 10: Barrel 3x3 s.f. vs. thrown lepton (left) energy and (right) eta
S.f. is defined as an average E_3x3/E_thrown for E_3x3/E_thrown>0.8
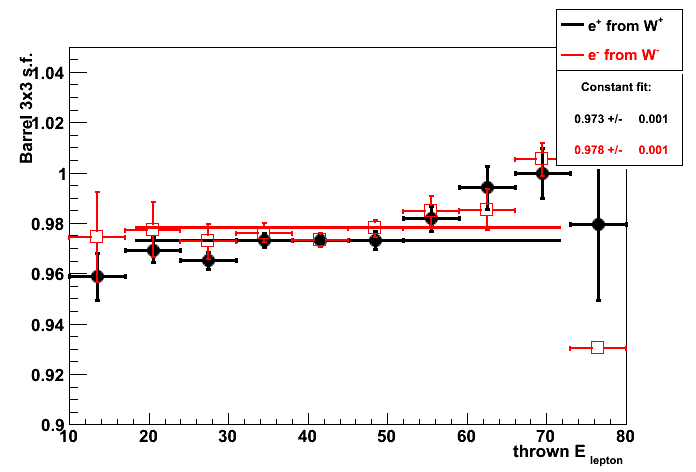
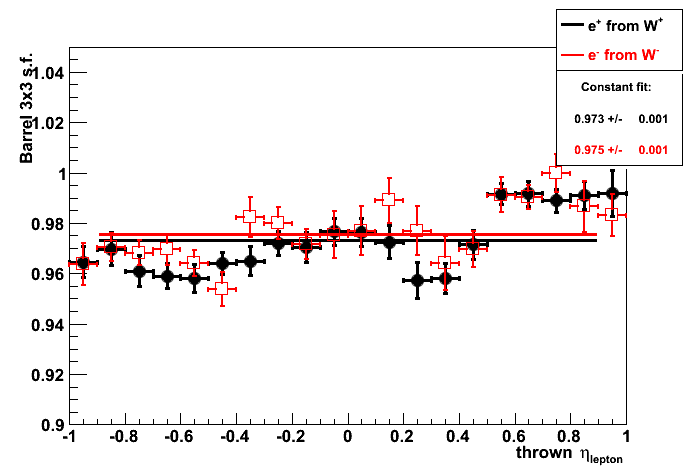
02 Feb
February 2010 posts
2010.02.08 StEemcGammaFilterMaker QA: QCD vs. gamma-jet ccept/reject rates
StEemcGammaFilterMaker QA
Pythia generated processes
| Pythia gamma-jet | Pythia QCD 2->2 processes |
| 14 f + fbar -> g + gamma | 11 f + f' -> f + f' (QCD) |
| 18 f + fbar -> gamma + gamma | 12 f + fbar -> f' + fbar' |
| 29 f + g -> f + gamma | 13 f + fbar -> g + g |
| 114 g + g -> gamma + gamma | 28 f + g -> f + g |
| 115 g + g -> g + gamma | 53 g + g -> f + fbar |
| 68 g + g -> g + g |
Number of generated events per parton pt bin
| Number of generated events (100events/job) |
||||||
| Parton pt range (GeV) | 2-3 | 3-4 | 4-6 | 6-9 | 9-15 | 15-25 |
| Pythia gamma-jet | 50K | 50K | 50K | 50K | 50K | 50K |
| Pythia QCD 2->2 processes | 100K | 100K | 50K | 50K | 50K | 50K |
Filter configuration
| Filter parameter | Value | Notes |
| mConeRadius | 0.24 | |
| mSeedThreshold | 2.5 | Cluster seed energy threshold |
| mClusterThreshold | 3.7 | Cluster Et threshold |
| mEtaLow | 0.9 | EEMC acceptance |
| mEtaHigh | 2.1 | EEMC acceptance |
| mSmearEnergy | 0 | Disabled |
| mThrowTracks | 0 | Disabled |
| mCalDepth | 279.5 | ZDC SMD depth |
| mMinPartEnergy | 1e-05 | Disabled by mThrowTracks=0 |
| mHadronScale | 0.4 | Downscale factor for hadron energy |
| mFilterMode | 0 | Accepting all events |
stasim/Pythia options
- detp geometry y2006h
- Calorimeter cut for electromagnetic processes: emc_10keV
- call pytune(100): PYTUNE v1.015; CDF Tune A
Figures
Figure 1: Pythia Eemc gamma filter QA:
(left) False rejection, (right) fraction of accepted events
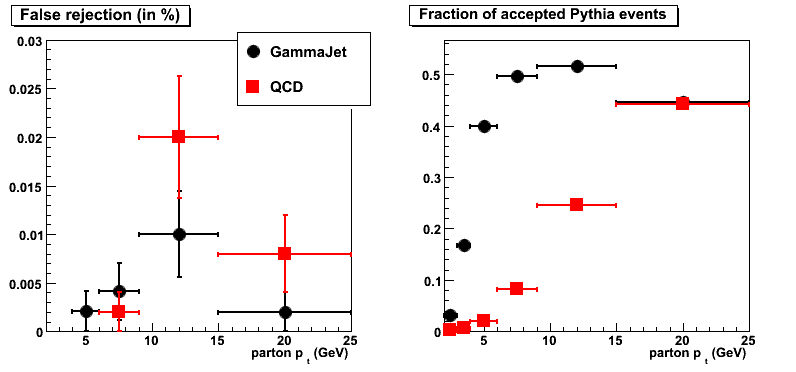
Comments
- Overall false rejection is < 0.02% (10^-4)
for both QCD and gamma-jet simulations. - In parton pt range 6-15 GeV the acceptance rate
for the gamma-jet MC is ~ 50%
(I think this is due to rapidity fiducial cut,
otherwise it should be closer to 100%).
For the QCD sample (in the same pt region)
acceptance rate is 8-25%. - Somehow for highest parton pt filter acceptance is the
same for gamma-jet and QCD Monte-Carlo.
2010.02.09 BFC and Pythia QA: relative to trigger
QCD and gamma-jet data samples are described here
Pythia filter configuration
StEemcGammaFilter:: running the TEST mode (accepting all events). Set mFilterMode=1 to actually reject events
StEemcGammaFilter:: mConeRadius 0.22 mSeedThreshold 2.1 mClusterThreshold 3.25 mEtaLow 0.95 mEtaHigh 2.1
StEemcGammaFilter:: mCalDepth 279.5 mMinPartEnergy 1e-05 mHadronScale 0.4 mFilterMode 0 mPrintLevel 0
BFC filter configuration
StChain:INFO - Init() : Seed energy threshold = 2.8 GeV
StChain:INFO - Init() : Cluster eT threshold = 4.2 GeV
StChain:INFO - Init() : Maximum vertex = +/- 120 cm
StChain:INFO - Init() : Running the TEST mode (accepting all events). Set mFilterMode=1 to actually reject events in BFC
Accept/Reject relative to the total number of Pythia generated events
Figure 1: Fraction of accepted events

Figure 2: False rejection (Y-axis scale is 10^-3)
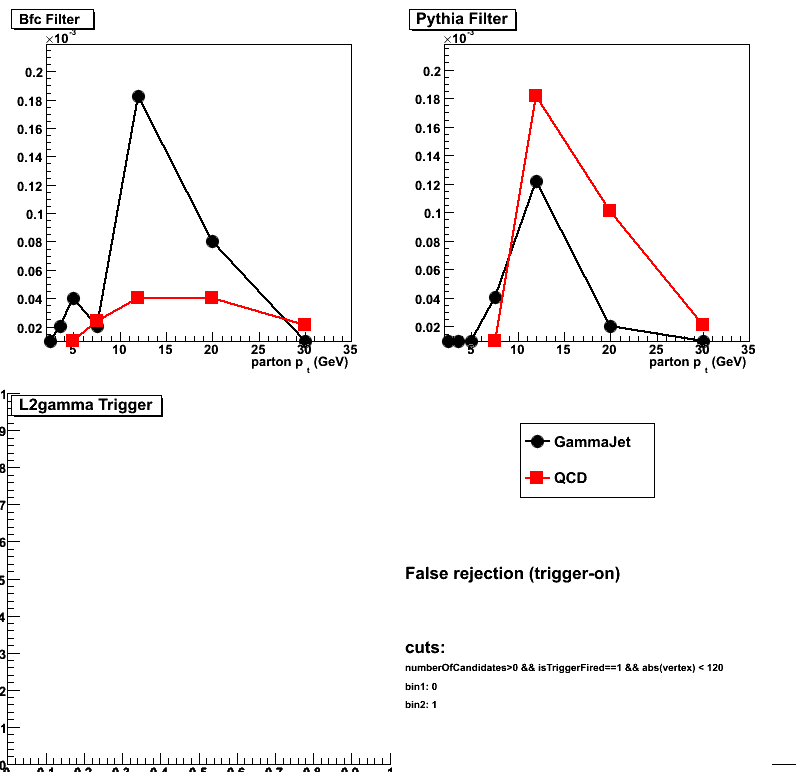
Accept/Reject relative to the number of triggered events
Figure 3: Fraction of accepted events (relative to triggered events)
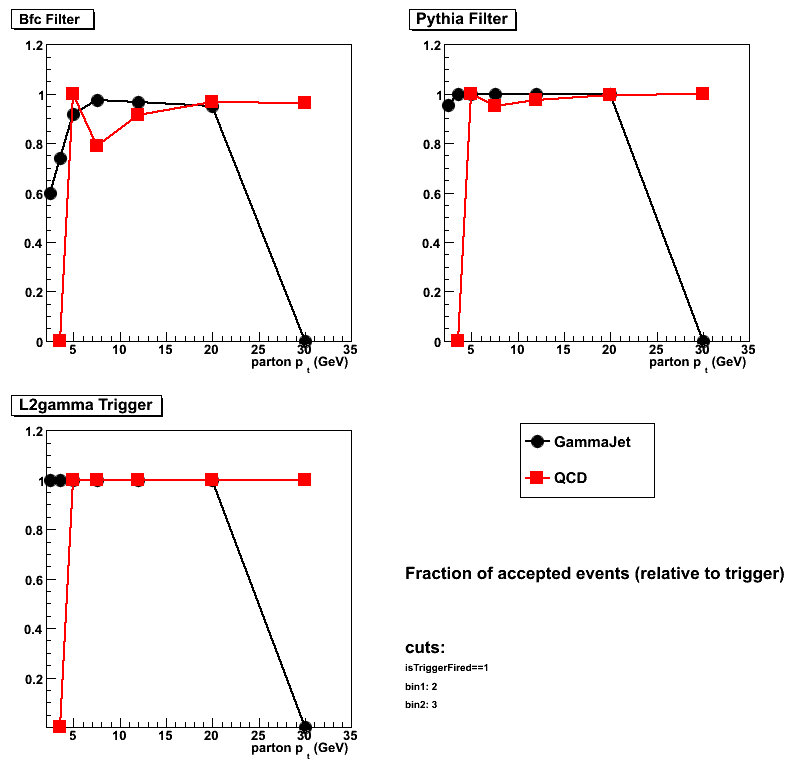
Figure 4: False rejection relative to triggered events
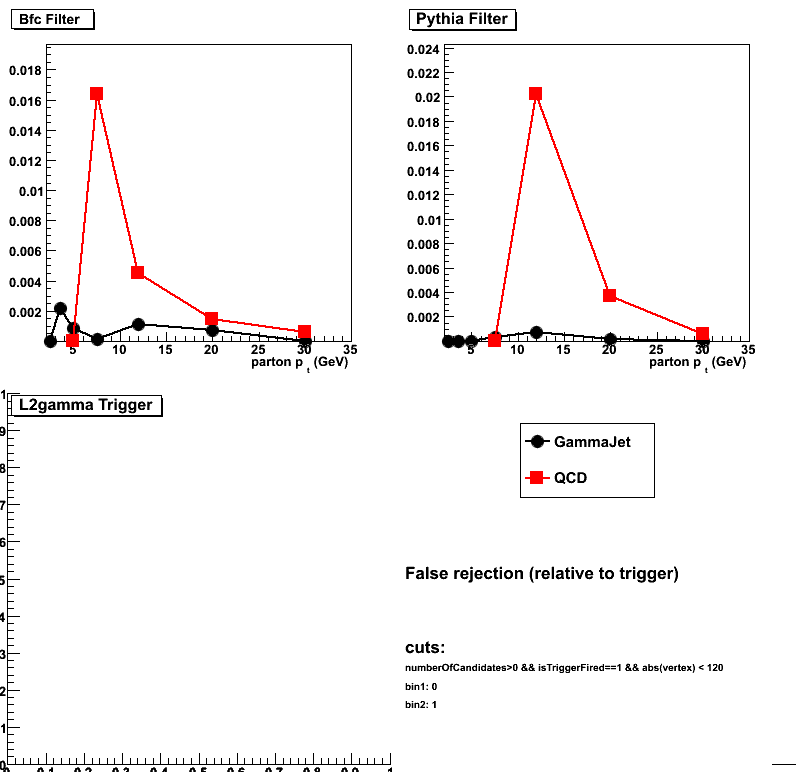
2010.02.10 Money plots for W cross section
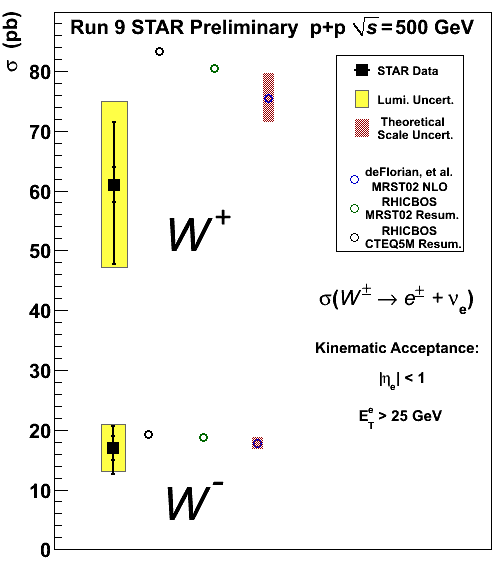
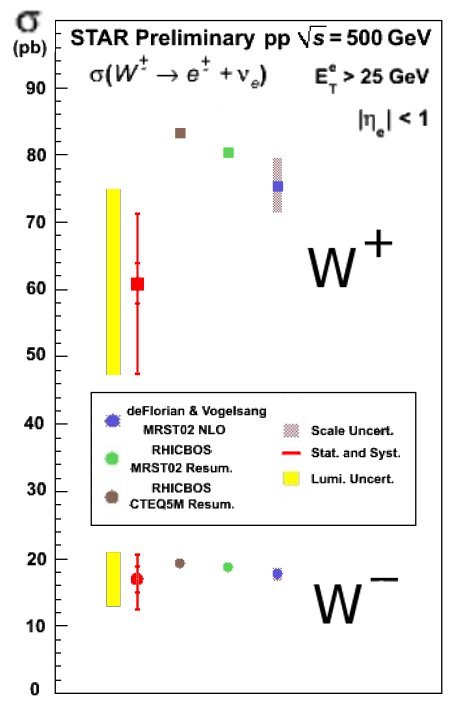
2010.02.11 BFC and Pythia QA: Gain no-gain-spread, mean=1.05
Click here for discussion and results with spread=0.05/gain=0.95
QCD and gamma-jet data samples are described here
Resultys without gain shift can be found here
(Note: ignore parton pt=25-35GeV for the gamma-jet sample since all jobs failed)
Pythia filter configuration
StEemcGammaFilter:: running the TEST mode (accepting all events). Set mFilterMode=1 to actually reject events
StEemcGammaFilter:: mConeRadius 0.22 mSeedThreshold 2.1 mClusterThreshold 3.25 mEtaLow 0.95 mEtaHigh 2.1
StEemcGammaFilter:: mCalDepth 279.5 mMinPartEnergy 1e-05 mHadronScale 0.4 mFilterMode 0 mPrintLevel 0
BFC filter configuration
StChain:INFO - Init() : Seed energy threshold = 2.8 GeV
StChain:INFO - Init() : Cluster eT threshold = 4.2 GeV
StChain:INFO - Init() : Maximum vertex = +/- 120 cm
StChain:INFO - Init() : Running the TEST mode (accepting all events). Set mFilterMode=1 to actually reject events in BFC
Accept/Reject relative to the total number of Pythia generated events
Figure 1: Fraction of accepted events
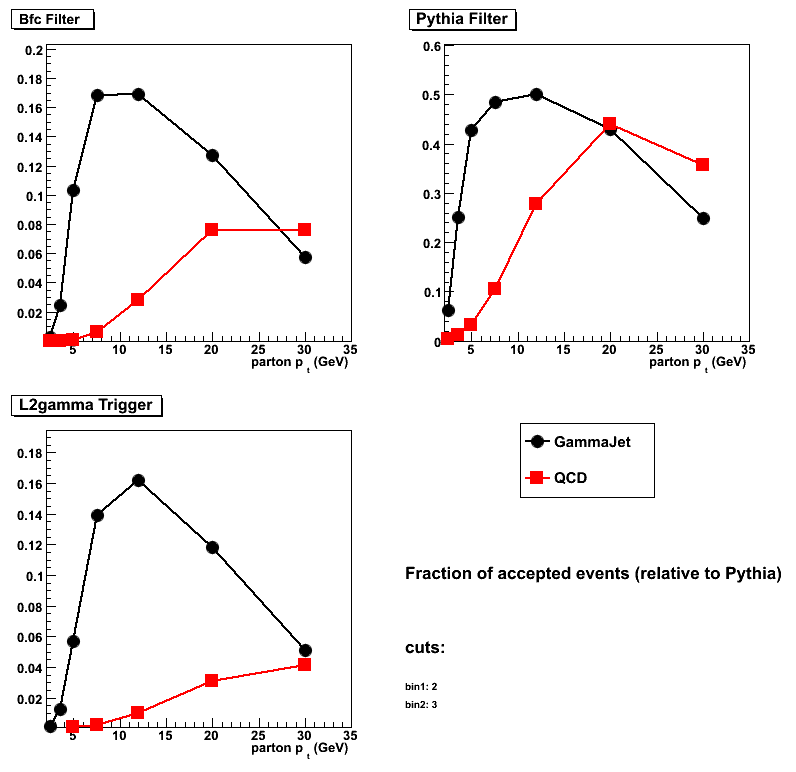
| Accept rate: fract. of generated events | |||
| GammaJet | |||
| pt bin | Bfc Filter | Pythia Filter | L2gamma Trigger |
| pt=2-3 | 0.0023 | 0.06264 | 0.00148 |
| pt=3-4 | 0.0242285 | 0.250601 | 0.0126854 |
| pt=4-6 | 0.103111 | 0.427535 | 0.0571313 |
| pt=6-9 | 0.16828 | 0.48368 | 0.13918 |
| pt=9-15 | 0.1692 | 0.50118 | 0.1619 |
| pt=15-25 | 0.12708 | 0.42904 | 0.11786 |
| pt=25-35 | 0.05702 | 0.24854 | 0.0509 |
| QCD | |||
| pt bin | Bfc Filter | Pythia Filter | L2gamma Trigger |
| pt=2-3 | 3.003e-05 | 0.00426426 | 2.002e-05 |
| pt=3-4 | 0.0001001 | 0.0122923 | 1.001e-05 |
| pt=4-6 | 0.00078 | 0.03166 | 0.00014 |
| pt=6-9 | 0.00622 | 0.10538 | 0.00216 |
| pt=9-15 | 0.02822 | 0.27666 | 0.01022 |
| pt=15-25 | 0.07568 | 0.4405 | 0.03086 |
| pt=25-35 | 0.0761 | 0.35556 | 0.04116 |
Figure 2: False rejection (Y-axis scale is 10^-3)
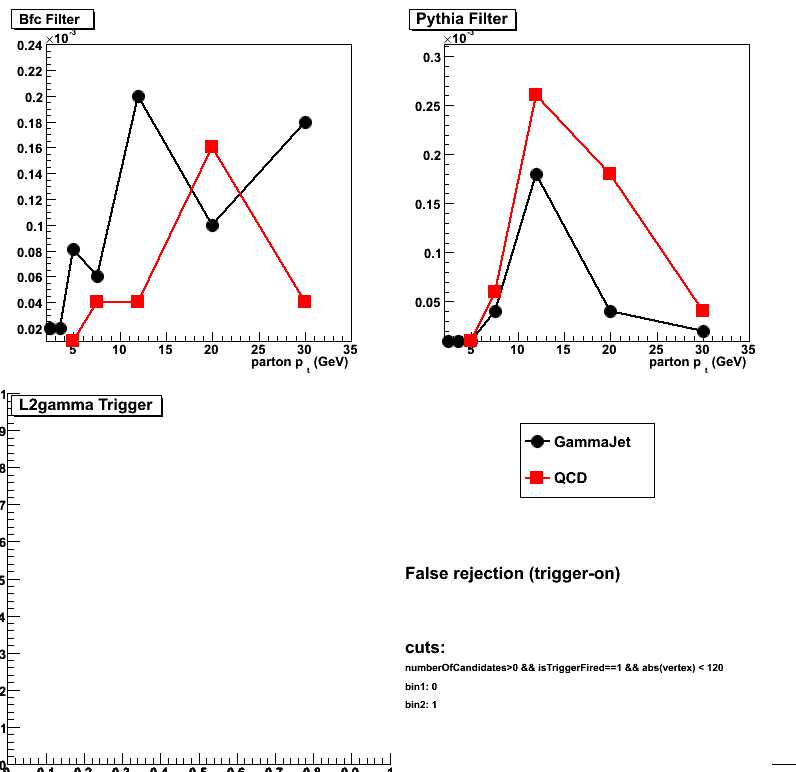
| False reject: fract. of generated events | |||
| GammaJet | |||
| pt bin | Bfc Filter | Pythia Filter | L2gamma Trigger |
| pt=2-3 | 2e-05 | 0 | 0 |
| pt=3-4 | 2.00401e-05 | 0 | 0 |
| pt=4-6 | 8.08081e-05 | 0 | 0 |
| pt=6-9 | 6e-05 | 4e-05 | 0 |
| pt=9-15 | 0.0002 | 0.00018 | 0 |
| pt=15-25 | 0.0001 | 4e-05 | 0 |
| pt=25-35 | 0.00018 | 2e-05 | 0 |
| QCD | |||
| pt bin | Bfc Filter | Pythia Filter | L2gamma Trigger |
| pt=2-3 | 0 | 0 | 0 |
| pt=3-4 | 0 | 0 | 0 |
| pt=4-6 | 0 | 0 | 0 |
| pt=6-9 | 4e-05 | 6e-05 | 0 |
| pt=9-15 | 4e-05 | 0.00026 | 0 |
| pt=15-25 | 0.00016 | 0.00018 | 0 |
| pt=25-35 | 4e-05 | 4e-05 | 0 |
Accept/Reject relative to the number of triggered events
Figure 3: Fraction of accepted events (relative to triggered events)
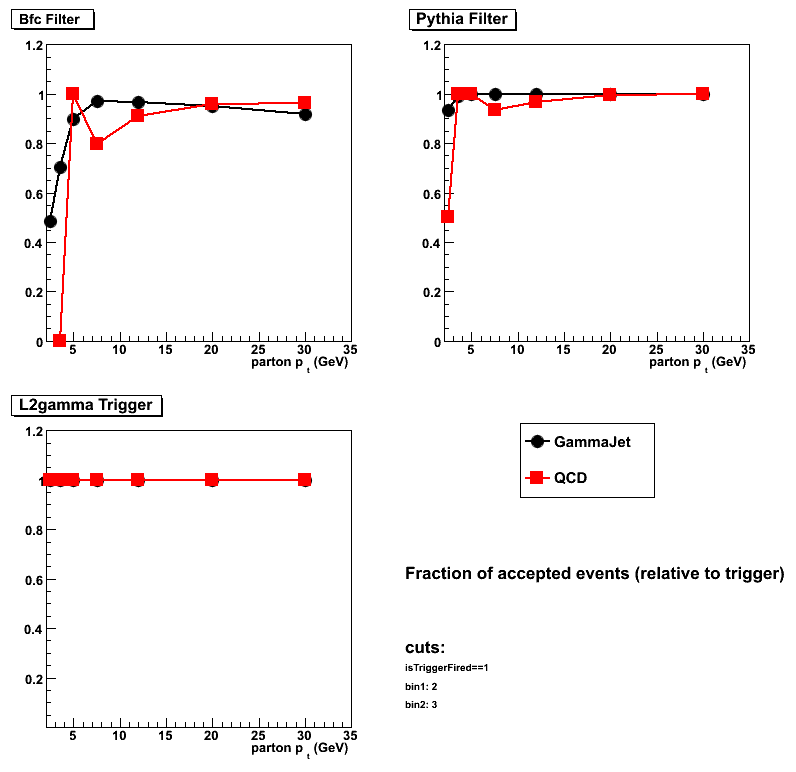
Figure 4: False rejection relative to triggered events
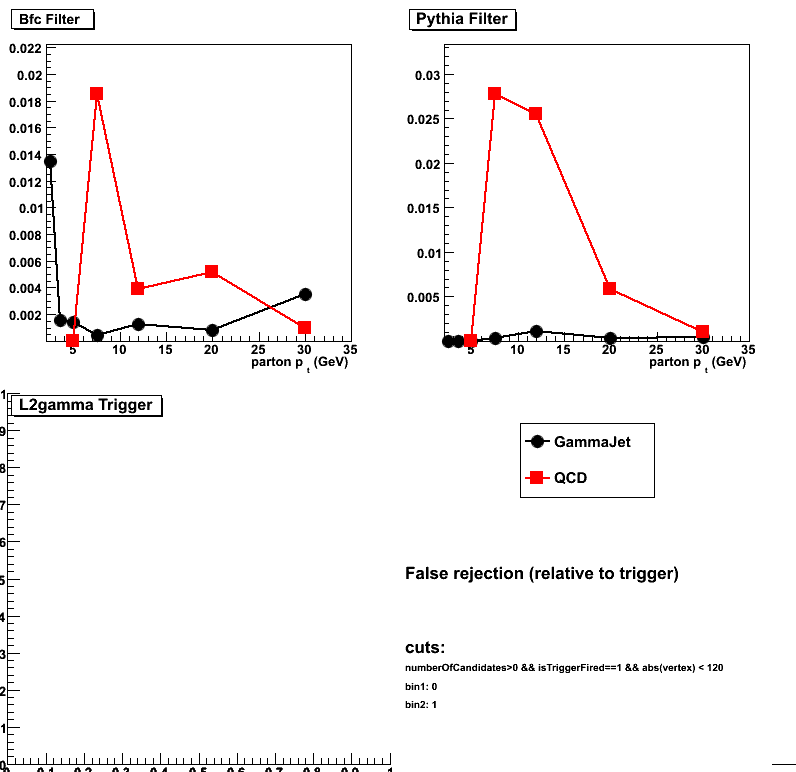
Accept/Reject relative to the number of Pythia filter accepted events
Figure 5: Fraction of accepted events relative to Pythia filter accepted events
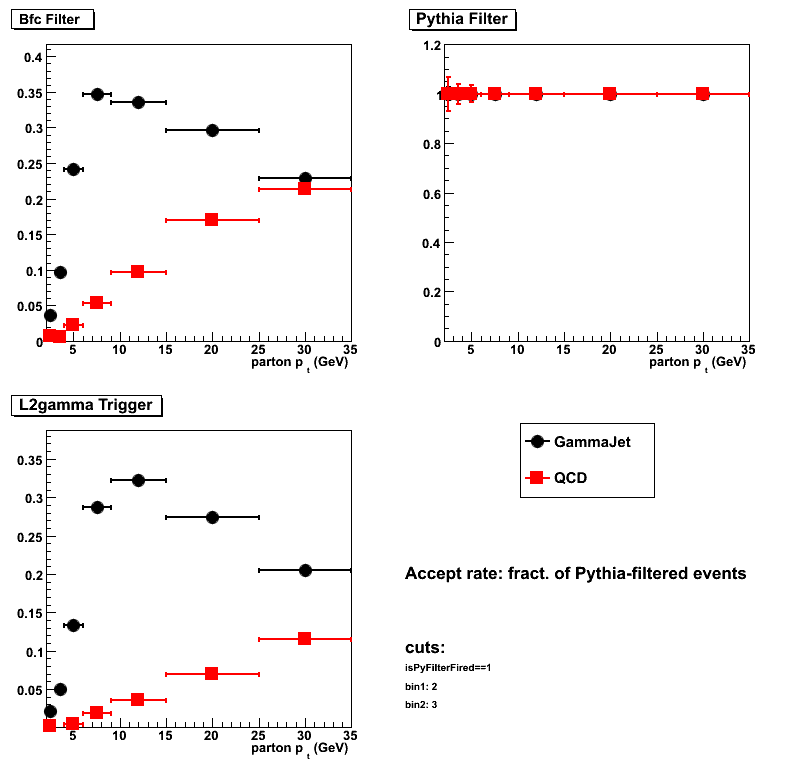
| Accept rate: fract. of Pythia-filtered events | |||
| GammaJet | |||
| pt bin | Bfc Filter | Pythia Filter | L2gamma Trigger |
| pt=2-3 | 0.0363985 | 1 | 0.0220307 |
| pt=3-4 | 0.0966813 | 1 | 0.0501399 |
| pt=4-6 | 0.241081 | 1 | 0.133488 |
| pt=6-9 | 0.347461 | 1 | 0.287587 |
| pt=9-15 | 0.336286 | 1 | 0.322639 |
| pt=15-25 | 0.29573 | 1 | 0.274613 |
| pt=25-35 | 0.228776 | 1 | 0.204635 |
| QCD | |||
| pt bin | Bfc Filter | Pythia Filter | L2gamma Trigger |
| pt=2-3 | 0.00704225 | 1 | 0.00234742 |
| pt=3-4 | 0.00488599 | 1 | 0.000814332 |
| pt=4-6 | 0.0214782 | 1 | 0.00442198 |
| pt=6-9 | 0.053141 | 1 | 0.0191687 |
| pt=9-15 | 0.0965806 | 1 | 0.0356394 |
| pt=15-25 | 0.16958 | 1 | 0.0695573 |
| pt=25-35 | 0.213185 | 1 | 0.115592 |
Figure 6: False rejection relative to Pythia filter accepted events
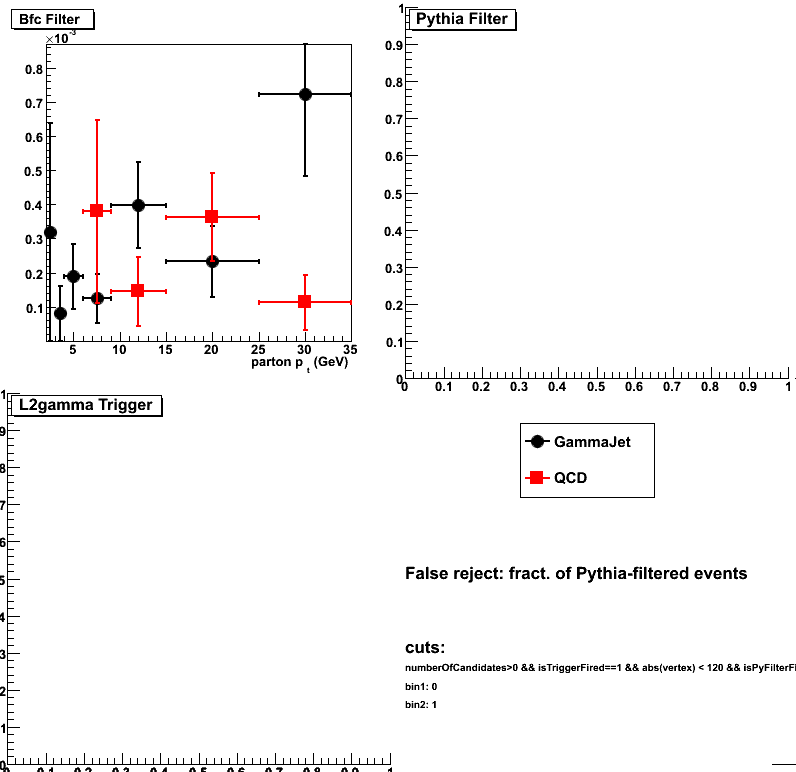
| False reject: fract. of Pythia-filtered events | |||
| GammaJet | |||
| pt bin | Bfc Filter | Pythia Filter | L2gamma Trigger |
| pt=2-3 | 0.000319285 | 0 | 0 |
| pt=3-4 | 7.9968e-05 | 0 | 0 |
| pt=4-6 | 0.000189009 | 0 | 0 |
| pt=6-9 | 0.000124049 | 0 | 0 |
| pt=9-15 | 0.000399058 | 0 | 0 |
| pt=15-25 | 0.000233079 | 0 | 0 |
| pt=25-35 | 0.000724229 | 0 | 0 |
| QCD | |||
| pt bin | Bfc Filter | Pythia Filter | L2gamma Trigger |
| pt=2-3 | 0 | 0 | 0 |
| pt=3-4 | 0 | 0 | 0 |
| pt=4-6 | 0 | 0 | 0 |
| pt=6-9 | 0.000379579 | 0 | 0 |
| pt=9-15 | 0.000144582 | 0 | 0 |
| pt=15-25 | 0.000363224 | 0 | 0 |
| pt=25-35 | 0.000112499 | 0 | 0 |
2010.02.11 BFC and Pythia QA: Gain spread=0.05, mean=0.95
QCD and gamma-jet data samples are described here
Resultys without gain spread can be found here
(Note: ignore parton pt=25-35GeV for the gamma-jet sample since all jobs failed)
Gain spread implementation in StEEmcSlowMaker.cxx (private version):
void StEEmcSlowMaker::setTowerGainSpread(Float_t s, Float_t mTowerGainMean)
{
LOG_INFO << "setTowerGainSpread(): gain spread: " << s << "; gain mean value: " << mTowerGainMean << endm;
// initialize tower gain factors to 1
for ( Int_t sec=0;sec<kEEmcNumSectors;sec++ )
for ( Int_t sub=0;sub<kEEmcNumSubSectors;sub++ )
for ( Int_t eta=0;eta<kEEmcNumEtas;eta++ )
{
// mTowerGainFact[sec][sub][eta]=1.0;
Float_t f = -1.0E9;
while ( f <= -1. || f >= 1.0 )
f = gRandom->Gaus(0., s);
mTowerGainFact[sec][sub][eta] = mTowerGainMean + f;
}
}
Pythia filter configuration
StEemcGammaFilter:: running the TEST mode (accepting all events). Set mFilterMode=1 to actually reject events
StEemcGammaFilter:: mConeRadius 0.22 mSeedThreshold 2.1 mClusterThreshold 3.25 mEtaLow 0.95 mEtaHigh 2.1
StEemcGammaFilter:: mCalDepth 279.5 mMinPartEnergy 1e-05 mHadronScale 0.4 mFilterMode 0 mPrintLevel 0
BFC filter configuration
StChain:INFO - Init() : Seed energy threshold = 2.8 GeV
StChain:INFO - Init() : Cluster eT threshold = 4.2 GeV
StChain:INFO - Init() : Maximum vertex = +/- 120 cm
StChain:INFO - Init() : Running the TEST mode (accepting all events). Set mFilterMode=1 to actually reject events in BFC
Accept/Reject relative to the total number of Pythia generated events
Figure 1: Fraction of accepted events
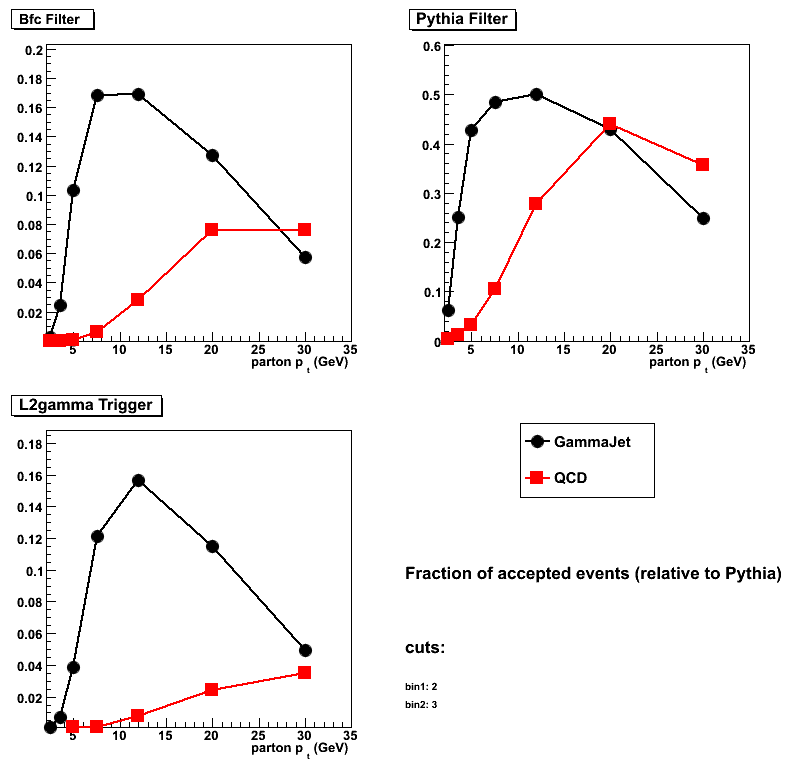
Figure 2: False rejection (Y-axis scale is 10^-3)
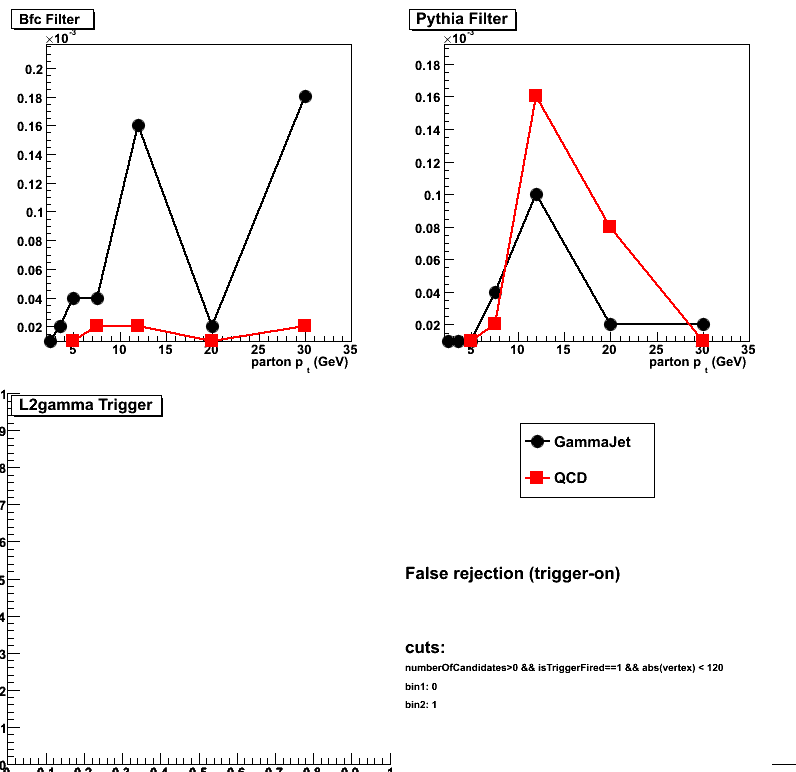
Accept/Reject relative to the number of triggered events
Figure 3: Fraction of accepted events (relative to triggered events)

Figure 4: False rejection relative to triggered events
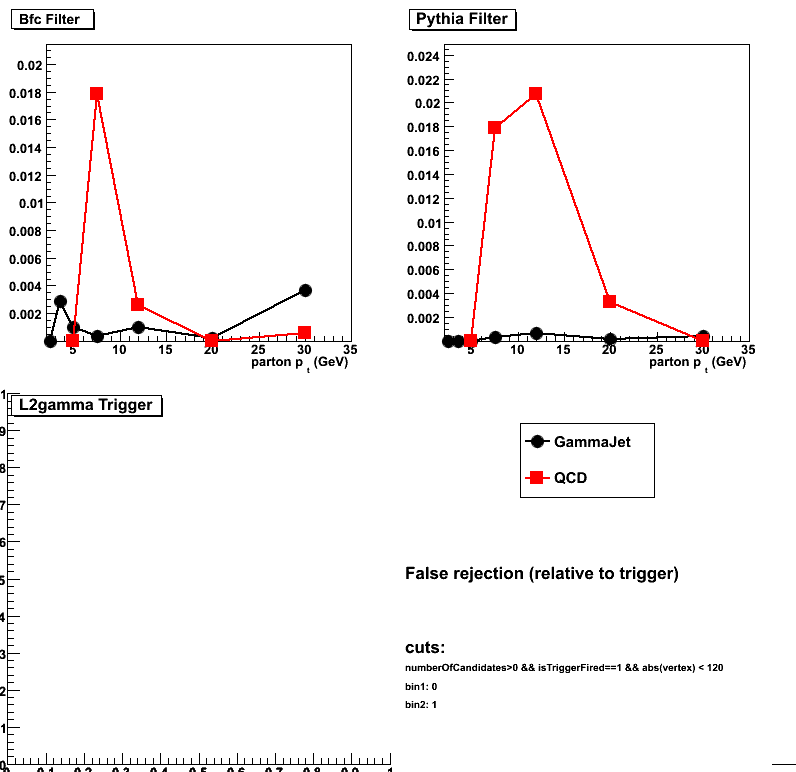
2010.02.12 Final Pythia and BFC EEMC-gamma-filter paramter settings
Pythia generated processes
| Prompt photons (gamma-jets) | 2->2 QCD | ||
| id | Process | id | Process |
| 14 | f + fbar -> g + gamma | 11 | f + f' -> f + f' (QCD) |
| 18 | f + fbar -> gamma + gamma | 12 | f + fbar -> f' + fbar' |
| 29 | f + g -> f + gamma | 13 | f + fbar -> g + g |
| 114 | g + g -> gamma + gamma | 28 | f + g -> f + g |
| 115 | g + g -> g + gamma | 53 | g + g -> f + fbar |
| 68 | g + g -> g + g | ||
Number of generated events per parton pt bin
| Number of generated events (100events/job) |
|||||||
| Parton pt range (GeV) | 2-3 | 3-4 | 4-6 | 6-9 | 9-15 | 15-25 | 25-35 |
| gamma-jets | 50K | 50K | 50K | 50K | 50K | 50K | 50K |
| 2->2 QCD processes | 100K | 100K | 50K | 50K | 50K | 50K | 50K |
Pythia Filter configuration
StRoot/StMCFilter/StEemcGammaFilter.cxx
StRoot/StMCFilter/StEemcGammaFilter.h
| Filter parameter | Value | Notes |
| mConeRadius | 0.22 | |
| mSeedThreshold | 2.6 | Cluster seed energy threshold (GeV) |
| mClusterThreshold | 3.6 | Cluster Et threshold (GeV) |
| mEtaLow | 0.95 | EEMC acceptance |
| mEtaHigh | 2.1 | EEMC acceptance |
| mMaxVertex | 120.0 | Vertex z cut (cm) |
| mCalDepth | 279.5 | EEMC SMD depth (cm) |
| mMinPartEnergy | 1e-05 | Ignore track with minim energy (GeV) |
| mHadronScale | 0.4 | Downscale factor for hadron energy |
| mFilterMode | 0 / 1 | 0=Accept all events; 1=reject events |
BFC Filter configuration
StRoot/StFilterMaker/StEemcGammaFilterMaker.cxx
StRoot/StFilterMaker/StEemcGammaFilterMaker.h
| Filter parameter | Value | Notes |
| mSeedEnergyThreshold | 3.4 | Cluter seed energy threshold (GeV) |
| mClusterEtThreshold | 4.5 | Cluster Et threshold (GeV) |
| mEemcSamplingFraction | 0.05 | Assume 5% sampling fraction for EEMC |
| mMaxVertex | 120.0 | Vertex z cut (cm) |
| mFilterMode | 0 / 1 | 0=Accept all events; 1=reject events |
GammaMaker configuration
| Filter parameter | Value | Notes |
| ConeRadius | 0.7 | |
| ClusterEtThreshold | 5.5 | (GeV) |
| SeedEnergyThreshold | 4.2 | (GeV) |
| ClusterEnergyThreshold | 5.5 | (GeV) |
EEMC SlowSimulator configuration
(for a moment private version) of StEEmcSlowMaker.cxx
with modified setTowerGainSpread(Float_t s, Float_t mTowerGainMean)
| Filter parameter | Value | Notes |
| mTowerGainMean | 1.05 | Overall +5% gain shift |
| GainSpread | 0 | No gain spread |
GSTAR/Pythia options
- detp geometry y2006h
- Calorimeter cut for electromagnetic processes: emc_10keV
- call pytune(100): PYTUNE v1.015; CDF Tune A
or
call pytune(320): PYTUNE Perugia; Perugia 0 tune
2010.02.16 Pythia and BFC filter QA vs. gamma candidate pt and eta
QCD and gamma-jet data samples and filter configurtions are given here
Note: for this study I have used ideal EEMC gains (no gain shift/spread)
Note on trigger effect intepretation:
There is no requirement for the Pythia gamma-jet sample to have direct gamma
headed to the EEMC, only requirement is to have a gamma candidate in the EEMC,
so the away side jet may also contribute.
Figure 1: pt distribution of the gamma candidates
for Pythia/Bfc level filter and triggered events
Event cuts: at least one gamma candidate, |v_z| <120
Left: Pythia gamma-jet MC; (right) 2->2 Pythia QCD
Lower plots: fraction of accepted gamma candidates by filter/trigger
No parton pt weights (= ignore bumps in pt distribution for gamma-jet sample)
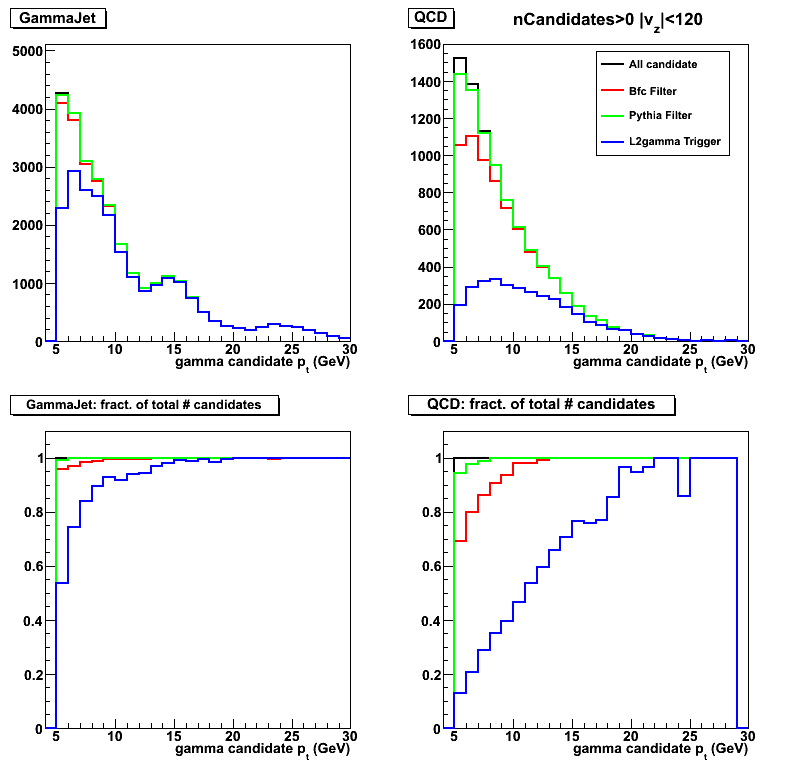
Figure 2: Rapidity distribution of the gamma candidates (Same conditions as in Fig. 1)
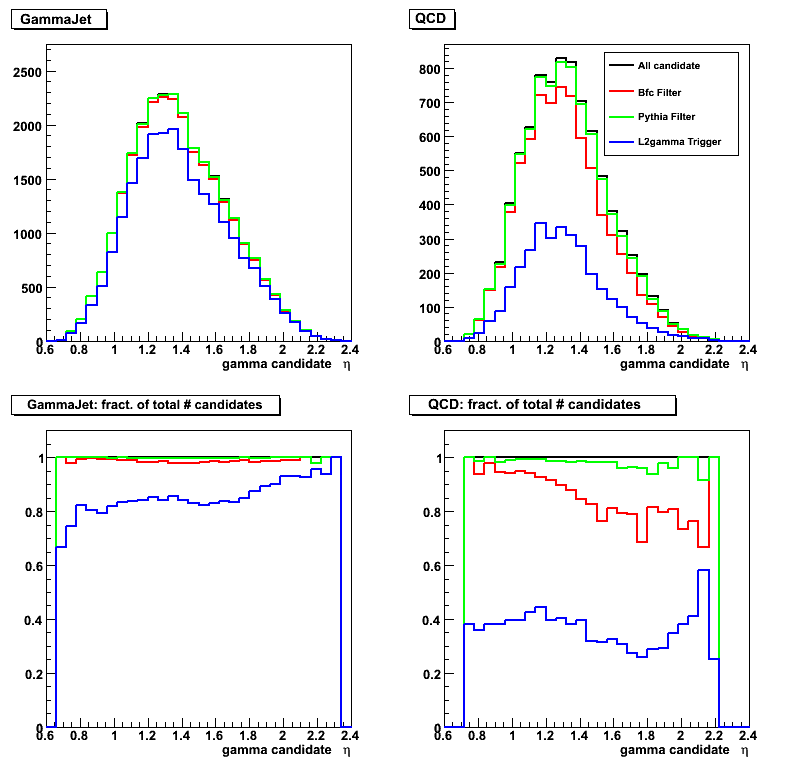
Figure 3: pt distribution of false rejection for Pythia/Bfc filters
Candidate cuts: at least one gamma candidate, l2gamm-trigger=fired, |v_z| <120
Most of false rejection (~ 1-3% for QCD) is for gamma candidates with pt < 8GeV
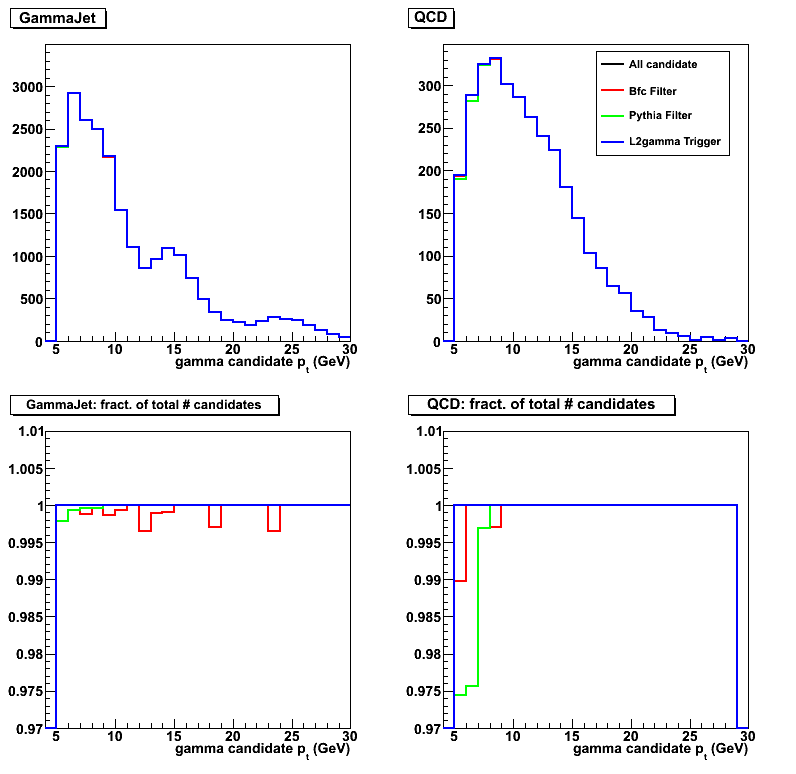
03 Mar
March 2010 posts
2010.03.02 Endcap photon-jets simulation request (draft)
Request last updated on Jul 21, 2010
Request summary
Total resources estimate for QCD with 1/pb and prompt-photon with 10/pb suimulations:
- CPU: 4.2 CPU years (2.2 weeks of running on a 100 CPUs)
- Disk space: 0.15Tb
- Numbe of filtered events: 0.74M
| partonic pt |
QCD |
prompt photon |
| 2-3 | 0 | 30K |
| 3-4 | 0 | 36K |
| 4-6 | 130K | 76K |
| 6-9 | 240K | 40K |
| 9-15 | 150K | 10K |
| 15-35 | 23K | 1K |
Latest filter bias/timing test and simulation request spreasheet
- EEMC simulation spreadsheet and timing tests
- Pythia/bfc filter bias
- Pythia tunes comparison agains data (CDF-Tune-A vs. Perugia0)
- Estimate of the contribution from lowerst partonic pt, pt<4GeV (see Fig. 6)
- L2-Endcap-gamma filter emulation study with single photon Monte-Carlo
- Bias tests with pi0 finder (last updated May 14, 2010)
Note: These and all other studies are linked from here
Filter code in cvs
- Pythia gamma-filter code:
- BFC gamma-filter code:
StEemcGammaFilterMaker.cxx
StEemcGammaFilterMaker.h
eemcGammaFilterMakerParams.idl
Further information related to this request
- Lidia added "y2006h" tag (latest Endcap geometry fixes, and Calorimeters with LOW_EM cuts)
http://www.star.bnl.gov/HyperNews-star/protected/get/starsimu/452/1.html
- x/y beam offset:
Run 6: x=0.0cm, y=-0.3cm (from /STAR/comp/calib/Beamline/Run6)
Run 9: x=0.3cm, y= 0.0cm (from /STAR/comp/calib/BeamLine/Run9)
- Vertex z cut:
+/- 120cm
- Vertex z spread:
Run 6: 55cm (gaus fit to Fig.1 from this post: /STAR/node/13276)
Run 9: 63cm are taken from Pibero's embedding study:
www4.rcf.bnl.gov/~pibero/spin/dijets/2009.10.23/embedding.html
- Vertex x/y spread set to zero for all runs.
FYI, Run 9 x/y spread is x=0.57, y=0.58
http://www4.rcf.bnl.gov/~pibero/spin/dijets/2009.10.23/XYVertexJetTriggers.png
- Vertex option:
Use option consistent with bfc tags used for data production (VFPPV/Run-6 or VFPPVnoCTB/Run-9):
Run 6: Leave vertex to be reconstructed vertex, and use VFPPV with beamline
Run 9: Leave vertex to be reconstructed vertex, and use VFPPVnoCTB with beamline
FYI: bfc options for different years:
http://www.star.bnl.gov/devcgi/dbProdOptionRetrv.pl
- Use the latest available "SLXXy" library tag
- No sdt option for bfc with Monte-Carlo. See note from Jreome's:
http://www.star.bnl.gov/HyperNews-star/protected/get/starsoft/7905/1/1/2.html
- Need to add new bfc tag. Request send to starsimu list:
http://www.star.bnl.gov/HyperNews-star/protected/get/starsimu/453.html
- Using Perugia0 tunes (i.e. call pytune(320))
- GMT timestamp update
http://www.star.bnl.gov/HyperNews-star/protected/get/ phana/481.html
Run 6 200 GeV
sdt20060512.043500 (GMT during run 7132005)
sdt20060513.064000 (GMT during run 7133011)
sdt20060514.090000 (GMT during run 7134015)
sdt20060516.152000 (GMT during run 7136022)
sdt20060518.073700 (GMT during run 7138010)
sdt20060520.142000 (GMT durign run 7140024)
sdt20060521.052000 (GMT during run 7141011)
sdt20060522.124500 (GMT during run 7142029)
sdt20060523.204400 (GMT during run 7143044)
sdt20060525.114000 (GMT during run 7145023)
sdt20060526.114000 (GMT during run 7146020)
sdt20060528.144500 (GMT during run 7148028)
sdt20060602.071500 (GMT during run 7153015)
sdt20060604.191200 (GMT during run 7155043)
Run 9 500 GeV
sdt20090320.014942
sdt20090321.095723
sdt20090324.064934
sdt20090328.040659
sdt20090329.014902
sdt20090404.194055
sdt20090407.030832
sdt20090410.020208
sdt20090411.103512
sdt20090413.021450
Run 9 200 GeV
std20090506.083000 (GMT during run 10126017)
std20090508.152000 (GMT during run 10128053)
std20090514.145500 (GMT during run 10134035)
std20090516.182500 (GMT during run 10135070)
std20090517.214000 (GMT during run 10137052)
std20090518.111600 (GMT during run 10138027)
std20090519.173200 (GMT during run 10139069)
std20090520.100500 (GMT during run 10140011)
std20090522.141000 (GMT during run 10142043)
std20090523.183500 (GMT during run 10143065)
std20090524.112000 (GMT during run 10144035)
std20090525.062000 (GMT during run 10145012)
std20090526.140000 (GMT during run 10146052)
- FYI:
simulation request posted to SPIN PWG:
http://www.star.bnl.gov/HyperNews-star/protected/get/starspin/3982.html
Code status:
http://www.star.bnl.gov/HyperNews-star/protected/get/starsoft/8073.html
Code per review (by Pibero and Victor):
http://www.star.bnl.gov/HyperNews-star/protected/get/starsoft/8073/2.html
Note: code being approved
Original disk space estimate (see spreadsheed linked above for the latest estimates):
http://www.star.bnl.gov/HyperNews-star/protected/get/starspin/3982.html
------------------------ REQUEST DRAFT BELOW ----------------------------------------
Endcap photon-jets / QCD 2->2 simulations
04 Apr
April 2010 posts
2010.04.09 BFC and Pythia QA: 10% gain shift
See this post from Alice for QCD sample rates
QCD and gamma-jet data samples are described here (filter parameters are listed below)
Pythia filter configuration
StEemcGammaFilter:: running the TEST mode (accepting all events). Set mFilterMode=1 to actually reject events
StEemcGammaFilter:: mConeRadius 0.22 mSeedThreshold 2.6 mClusterThreshold 3.6 mEtaLow 0.95 mEtaHigh 2.1 mMaxVertex 120
StEemcGammaFilter:: mCalDepth 279.5 mMinPartEnergy 1e-05 mHadronScale 1 mFilterMode 0 mPrintLevel 1
BFC filter configuration
StChain:INFO - Init() : Using gamma filter on the EEMC
StChain:INFO - Init() : EEMC Sampling Fraction = 0.05
StChain:INFO - Init() : Seed energy threshold = 3.4 GeV
StChain:INFO - Init() : Cluster eT threshold = 4.5 GeV
StChain:INFO - Init() : Maximum vertex = +/- 120 cm
StChain:INFO - Init() : Running the TEST mode (accepting all events). Set mFilterMode=1 to actually reject events in BFC
StEEmcSlowMaker
BFC:INFO - setTowerGainSpread(): gain spread: 0; gain mean value: 1.1
Accept/Reject relative to the total number of Pythia generated events
Figure 1: Fraction of accepted events

| Accept rate: fract. of generated events | |||
| GammaJet | |||
| pt bin | Bfc Filter | Pythia Filter | L2gamma Trigger |
| pt=2-3 | 0.00646 | 0.09532 | 0.00656 |
| pt=3-4 | 0.03042 | 0.2401 | 0.02772 |
| pt=4-6 | 0.09438 | 0.42552 | 0.07568 |
| pt=6-9 | 0.165984 | 0.54004 | 0.149137 |
| pt=9-15 | 0.167329 | 0.559137 | 0.162972 |
| pt=15-25 | 0.12486 | 0.45662 | 0.11744 |
| pt=25-35 | 0.0562525 | 0.269499 | 0.0536273 |
Figure 2: False rejection (Y-axis scale is 10^-3)
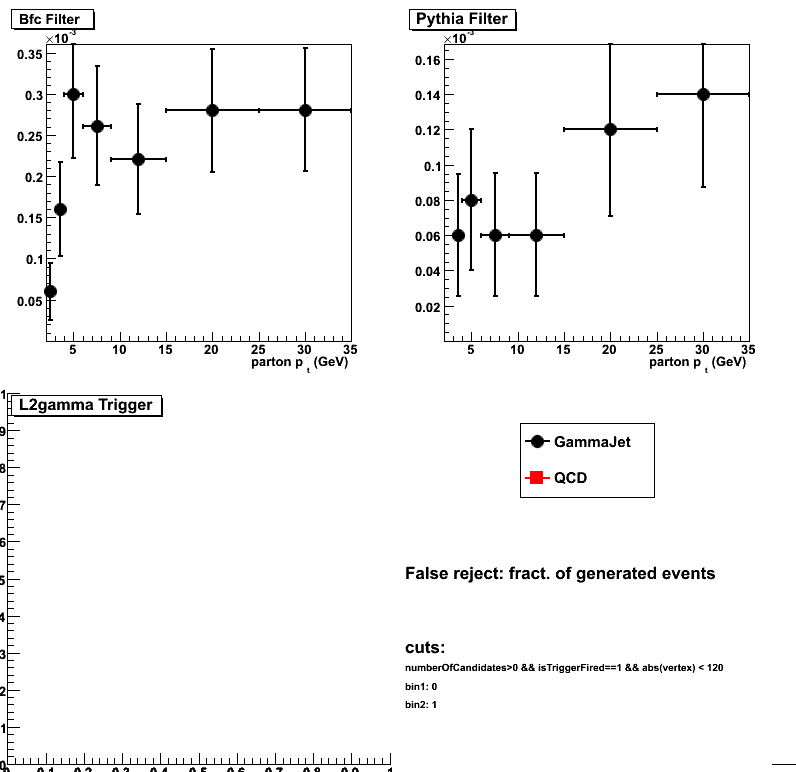
| False reject: fract. of generated events | |||
| GammaJet | |||
| pt bin | Bfc Filter | Pythia Filter | L2gamma Trigger |
| pt=2-3 | 6e-05 | 0 | 0 |
| pt=3-4 | 0.00016 | 6e-05 | 0 |
| pt=4-6 | 0.0003 | 8e-05 | 0 |
| pt=6-9 | 0.000261044 | 6.0241e-05 | 0 |
| pt=9-15 | 0.000220884 | 6.0241e-05 | 0 |
| pt=15-25 | 0.00028 | 0.00012 | 0 |
| pt=25-35 | 0.000280561 | 0.000140281 | 0 |
Accept/Reject relative to the number of Pythia filter accepted events
Figure 3: Fraction of accepted events relative to Pythia filter accepted events
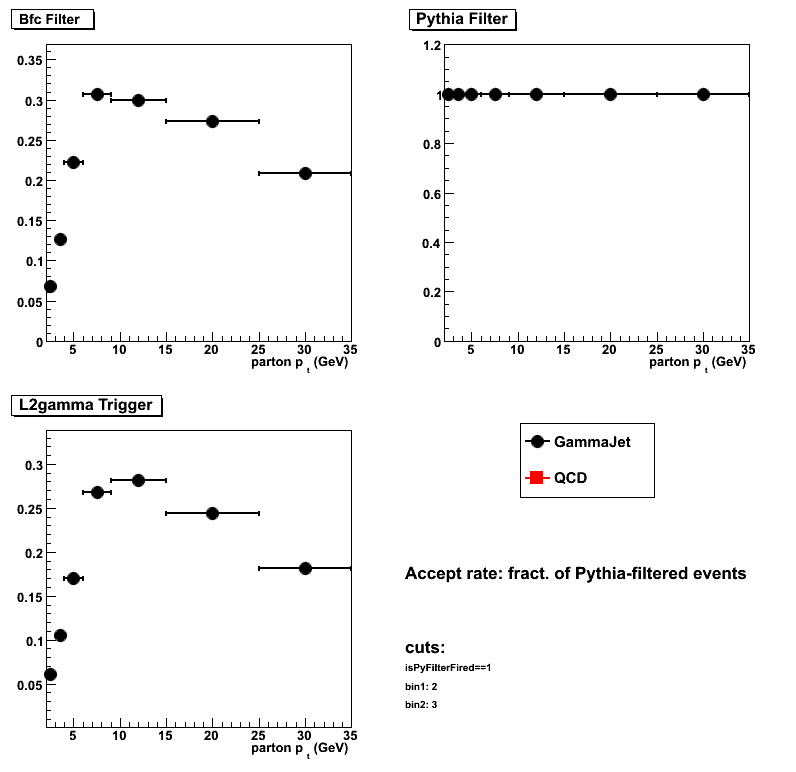
| Accept rate: fract. of Pythia-filtered events | |||
| GammaJet | |||
| pt bin | Bfc Filter | Pythia Filter | L2gamma Trigger |
| pt=2-3 | 0.0677717 | 1 | 0.0612673 |
| pt=3-4 | 0.126697 | 1 | 0.105623 |
| pt=4-6 | 0.221799 | 1 | 0.16991 |
| pt=6-9 | 0.307318 | 1 | 0.26809 |
| pt=9-15 | 0.299264 | 1 | 0.281882 |
| pt=15-25 | 0.273444 | 1 | 0.244317 |
| pt=25-35 | 0.20873 | 1 | 0.181217 |
Figure 4: False rejection relative to Pythia filter accepted events
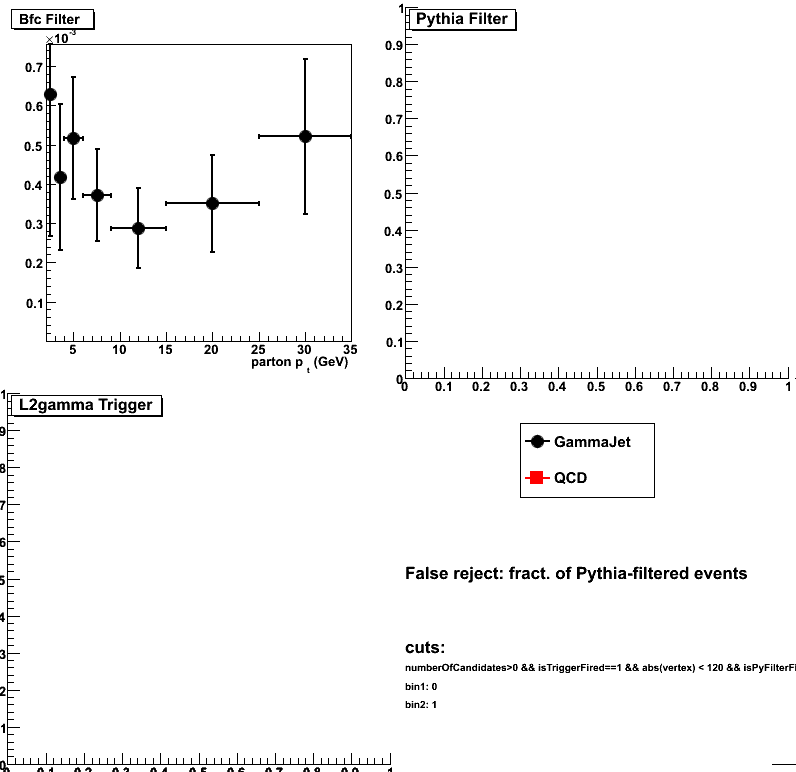
| False reject: fract. of Pythia-filtered events | |||
| GammaJet | |||
| pt bin | Bfc Filter | Pythia Filter | L2gamma Trigger |
| pt=2-3 | 0.000629459 | 0 | 0 |
| pt=3-4 | 0.000416493 | 0 | 0 |
| pt=4-6 | 0.000517014 | 0 | 0 |
| pt=6-9 | 0.00037183 | 0 | 0 |
| pt=9-15 | 0.000287305 | 0 | 0 |
| pt=15-25 | 0.000350401 | 0 | 0 |
| pt=25-35 | 0.000520524 | 0 | 0 |
2010.04.17 BFC and Pythia QA: 10% gain shift: lowered thresholds
See this post from Alice for QCD sample rates with slightly lower thresholds
QCD and gamma-jet data samples are described here (filter parameters are listed below)
Pythia filter configuration
StEemcGammaFilter:: running the TEST mode (accepting all events). Set mFilterMode=1 to actually reject events
StEemcGammaFilter:: mConeRadius 0.22 mSeedThreshold 2.4 mClusterThreshold 3.3 mEtaLow 0.95 mEtaHigh 2.1 mMaxVertex 120
StEemcGammaFilter:: mCalDepth 279.5 mMinPartEnergy 1e-05 mHadronScale 1 mFilterMode 0 mPrintLevel 1
BFC filter configuration
StChain:INFO - Init() : Using gamma filter on the EEMC
StChain:INFO - Init() : EEMC Sampling Fraction = 0.05
StChain:INFO - Init() : Seed energy threshold = 2.8 GeV
StChain:INFO - Init() : Cluster eT threshold = 3.8 GeV
StChain:INFO - Init() : Maximum vertex = +/- 120 cm
StChain:INFO - Init() : Running the TEST mode (accepting all events). Set mFilterMode=1 to actually reject events in BFC
StEEmcSlowMaker
BFC:INFO - setTowerGainSpread(): gain spread: 0; gain mean value: 1.1
Accept/Reject relative to the total number of Pythia generated events
Figure 1: Fraction of accepted events
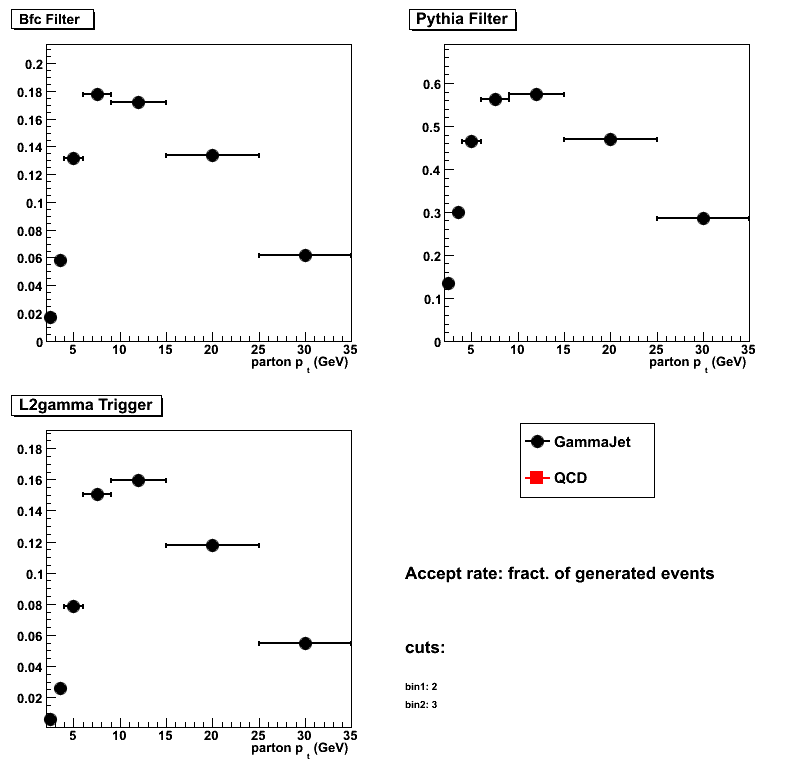
| Accept rate: fract. of generated events | |||
| GammaJet | |||
| pt bin | Bfc Filter | Pythia Filter | L2gamma Trigger |
| pt=2-3 | 0.01732 | 0.1343 | 0.00628 |
| pt=3-4 | 0.05818 | 0.3001 | 0.0261 |
| pt=4-6 | 0.1317 | 0.46492 | 0.07864 |
| pt=6-9 | 0.17804 | 0.56314 | 0.15092 |
| pt=9-15 | 0.17226 | 0.57516 | 0.15964 |
| pt=15-25 | 0.13356 | 0.46894 | 0.1179 |
| pt=25-35 | 0.062 | 0.28546 | 0.05482 |
Figure 2: False rejection (Y-axis scale is 10^-3)
.png)
| False reject: fract. of generated events | |||
| GammaJet | |||
| pt bin | Bfc Filter | Pythia Filter | L2gamma Trigger |
| pt=2-3 | 2e-05 | 2e-05 | 0 |
| pt=3-4 | 6e-05 | 6e-05 | 0 |
| pt=4-6 | 6e-05 | 4e-05 | 0 |
| pt=6-9 | 0.0001 | 6e-05 | 0 |
| pt=9-15 | 2e-05 | 2e-05 | 0 |
| pt=15-25 | 2e-05 | 0 | 0 |
| pt=25-35 | 2e-05 | 2e-05 | 0 |
Accept/Reject relative to the number of Pythia filter accepted events
Figure 3: Fraction of accepted events relative to Pythia filter accepted events
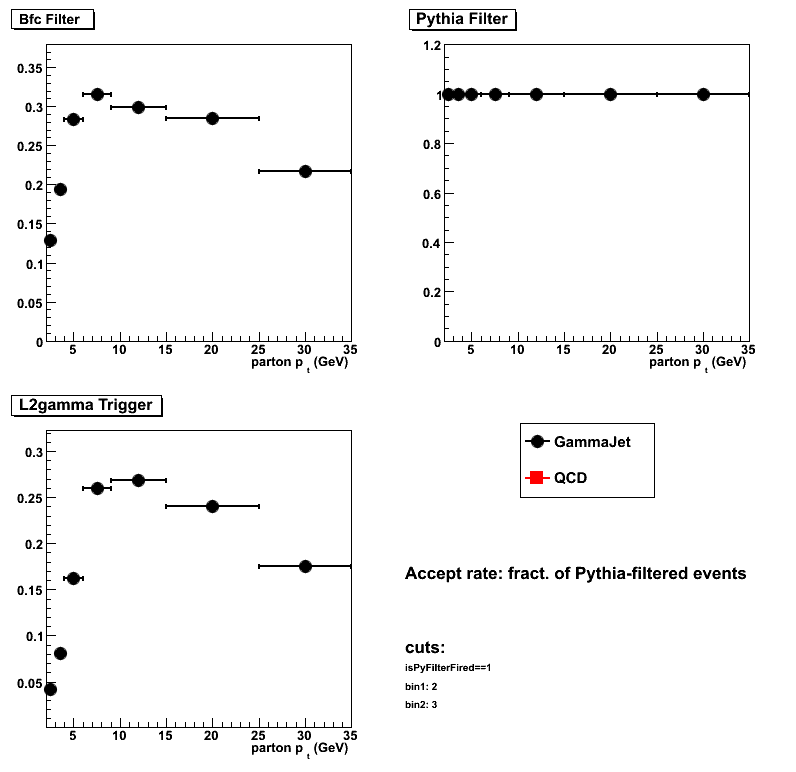
| Accept rate: fract. of Pythia-filtered events | |||
| GammaJet | |||
| pt bin | Bfc Filter | Pythia Filter | L2gamma Trigger |
| pt=2-3 | 0.128816 | 1 | 0.0415488 |
| pt=3-4 | 0.193735 | 1 | 0.0808397 |
| pt=4-6 | 0.283232 | 1 | 0.161877 |
| pt=6-9 | 0.316049 | 1 | 0.260291 |
| pt=9-15 | 0.29943 | 1 | 0.26876 |
| pt=15-25 | 0.284813 | 1 | 0.240415 |
| pt=25-35 | 0.217053 | 1 | 0.175156 |
Figure 4: False rejection relative to Pythia filter accepted events
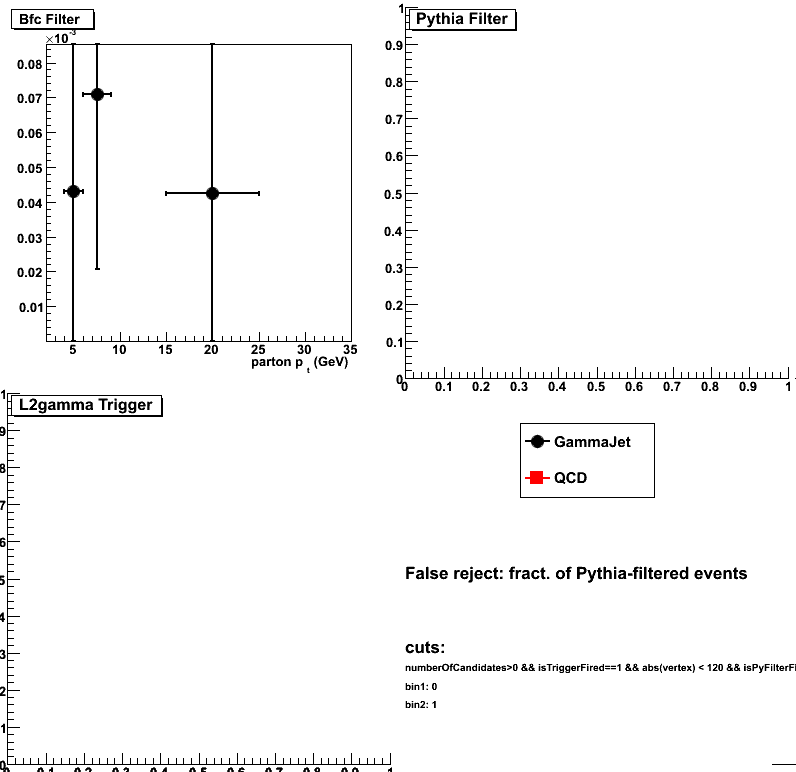
| False reject: fract. of Pythia-filtered events | |||
| GammaJet | |||
| pt bin | Bfc Filter | Pythia Filter | L2gamma Trigger |
| pt=2-3 | 0 | 0 | 0 |
| pt=3-4 | 0 | 0 | 0 |
| pt=4-6 | 4.30182e-05 | 0 | 0 |
| pt=6-9 | 7.10303e-05 | 0 | 0 |
| pt=9-15 | 0 | 0 | 0 |
| pt=15-25 | 4.26494e-05 | 0 | 0 |
| pt=25-35 | 0 | 0 | 0 |
2010.04.17 Pythia/BFC gamma-filter accaptance vs. gamma candidate pt, energy, and eta
Data sample used:
Pythia prompt photon Monte-Carlo (partonic pt bins are combined without weights)
Common event cuts:
reconstruct at least one gamma candidate, |v_z| <120, !=0 l2e-gamma-trigger=fired
Figure 1:
- upper panel:
Number of candidates vs. gamma candidate pt for specific filter/trigger fired. - lower panel:
Pythia/bfc filter false rejection vs. gamma candidate pt - left panel:
Pythis (bfc) filter configured with seed=2.6 (3.4) and cluster=3.6 (4.5) - right panel:
Pythis (bfc) filter configured with seed=2.4 (2.8) and cluster=3.3 (3.8)
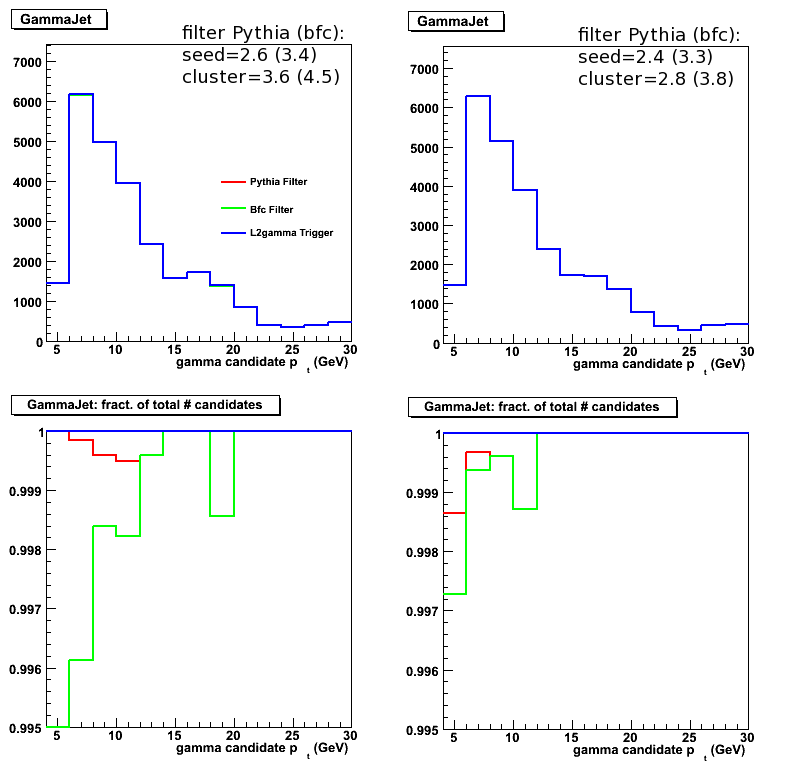
Figure 2: Same as Fig. 1 vs. gamma candidate energy
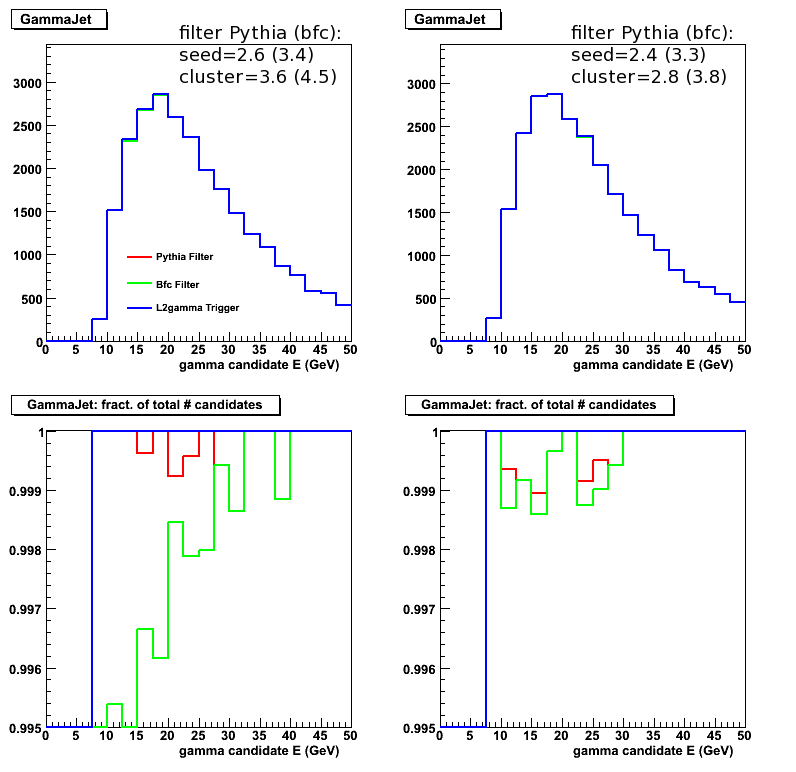
Figure 3: Same as Fig. 1 vs. gamma candidate pseudo-rapidity
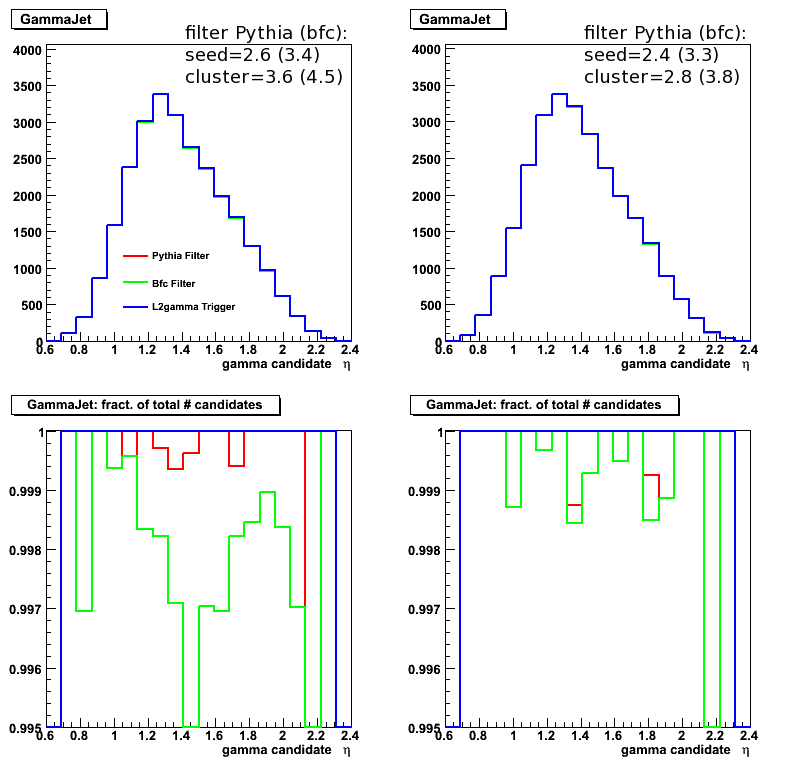
2010.04.30 BFC and Pythia QA after gamma-maker 3x3 cluser fix
Related inks:
- 3x3 clusering and gamma maker fix
- Alice' study with QCD sample
- QCD and gamma-jet data samples are described here
(filter parameters are listed below)
Number of generated events per partnic pt bin:
gamma-jet: 25K
QCD(2-4): 50K
QCD(4-55): 25K
Pythia filter configuration
StEemcGammaFilter:: running the TEST mode (accepting all events). Set mFilterMode=1 to actually reject events
StEemcGammaFilter:: mConeRadius 0.22 mSeedThreshold 3.8 mClusterThreshold 5 mEtaLow 0.95 mEtaHigh 2.1 mMaxVertex 120
StEemcGammaFilter:: mCalDepth 279.5 mMinPartEnergy 1e-05 mHadronScale 1 mFilterMode 0 mPrintLevel 1
BFC filter configuration
StChain:INFO - Init() : Using gamma filter on the EEMC
StChain:INFO - Init() : EEMC Sampling Fraction = 0.05
StChain:INFO - Init() : Seed energy threshold = 3.8 GeV
StChain:INFO - Init() : Cluster eT threshold = 5 GeV
StChain:INFO - Init() : Maximum vertex = +/- 120 cm
StChain:INFO - Init() : Running the TEST mode (accepting all events). Set mFilterMode=1 to actually reject events in BFC
StEEmcSlowMaker configuration
BFC:INFO - setTowerGainSpread(): gain spread: 0; gain mean value: 1.1
GammaMaker configuration
runSimuGammaTreeMaker():: GammaMaker config: ConeRadius 0.7 ClusterEtThreshold 5.5 SeedEnergyThreshold 4.2 ClusterEnergyThreshold 5.5 BsmdRange 0.05237 EsmdR ange 20
A2Emaker configuration
StEEmcA2EMaker *EEanalysis = new StEEmcA2EMaker("mEEanalysis");
EEanalysis->threshold(3.0, 0); // tower threshold (ped+N sigma)
EEanalysis->threshold(3.0, 1); // pre1 threshold
EEanalysis->threshold(3.0, 2); // pre2 threshold
EEanalysis->threshold(3.0, 3); // post threshold
EEanalysis->threshold(3.0, 4); // smdu threshold
EEanalysis->threshold(3.0, 5); // smdv threshold
Trigger configuration
emulate L2E-gamma trigger for Run 2006 [eemc-http-mb-l2gamma:: id 137641]
Trigger conditions:
cluster Et (2x2) = 5.2GeV
seed Et = 3.7GeV
Accept/Reject relative to the total number of Pythia generated events
Figure 1: Fraction of accepted events
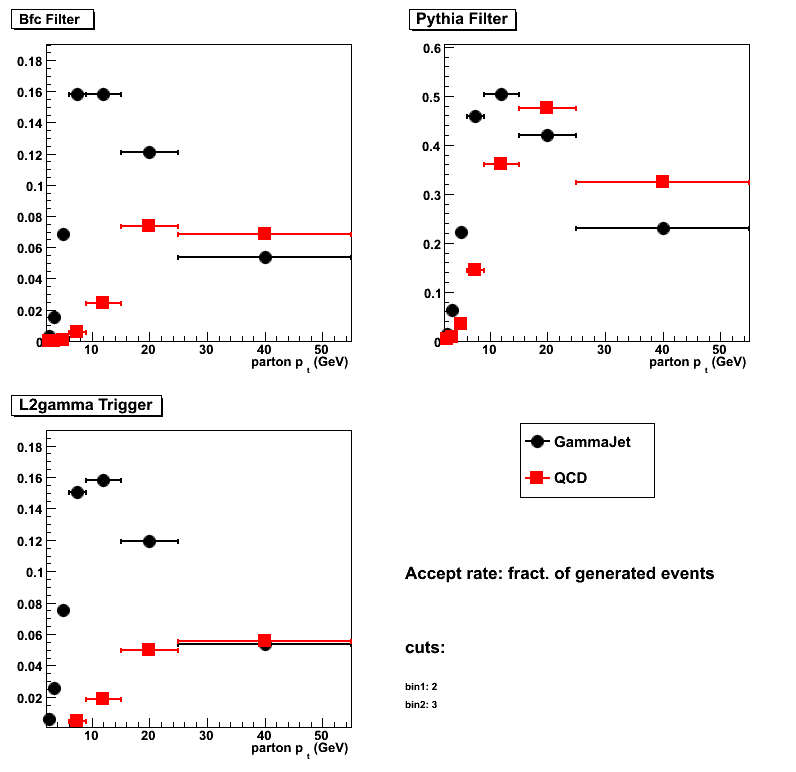
| Accept rate: fract. of generated events | |||
| GammaJet | |||
| pt bin | Bfc Filter | Pythia Filter | L2gamma Trigger |
| pt=2-3 | 0.00288 | 0.01472 | 0.00616 |
| pt=3-4 | 0.01504 | 0.06192 | 0.02576 |
| pt=4-6 | 0.06824 | 0.22112 | 0.07548 |
| pt=6-9 | 0.15848 | 0.45836 | 0.15016 |
| pt=9-15 | 0.1584 | 0.50416 | 0.15812 |
| pt=15-25 | 0.12112 | 0.42076 | 0.11916 |
| pt=25-55 | 0.05356 | 0.2292 | 0.0538 |
| QCD | |||
| pt bin | Bfc Filter | Pythia Filter | L2gamma Trigger |
| pt=2-3 | 2e-05 | 0.00258 | 6e-05 |
| pt=3-4 | 6e-05 | 0.00854 | 0.00022 |
| pt=4-6 | 0.00072 | 0.03492 | 0.00076 |
| pt=6-9 | 0.00564 | 0.144 | 0.00496 |
| pt=9-15 | 0.0242 | 0.36036 | 0.0186 |
| pt=15-25 | 0.07368 | 0.47592 | 0.05008 |
| pt=25-55 | 0.0684553 | 0.323374 | 0.0557724 |
Figure 2: False rejection (Y-axis scale is 10^-3)

| False reject: fract. of generated events | |||
| GammaJet | |||
| pt bin | Bfc Filter | Pythia Filter | L2gamma Trigger |
| pt=2-3 | 0.0002 | 0.00012 | 0 |
| pt=3-4 | 0.0002 | 0.00056 | 0 |
| pt=4-6 | 0.00096 | 0.00132 | 0 |
| pt=6-9 | 0.0006 | 0.00032 | 0 |
| pt=9-15 | 0.0002 | 4e-05 | 0 |
| pt=15-25 | 4e-05 | 0 | 0 |
| pt=25-55 | 8e-05 | 8e-05 | 0 |
| QCD | |||
| pt bin | Bfc Filter | Pythia Filter | L2gamma Trigger |
| pt=2-3 | 0 | 0 | 0 |
| pt=3-4 | 0 | 0 | 0 |
| pt=4-6 | 0 | 0 | 0 |
| pt=6-9 | 0.00012 | 0 | 0 |
| pt=9-15 | 8e-05 | 8e-05 | 0 |
| pt=15-25 | 0.00016 | 4e-05 | 0 |
| pt=25-55 | 0.000203252 | 0 | 0 |
Accept/Reject relative to the number of Pythia filter accepted events
Figure 3: Fraction of accepted events relative to Pythia filter accepted events
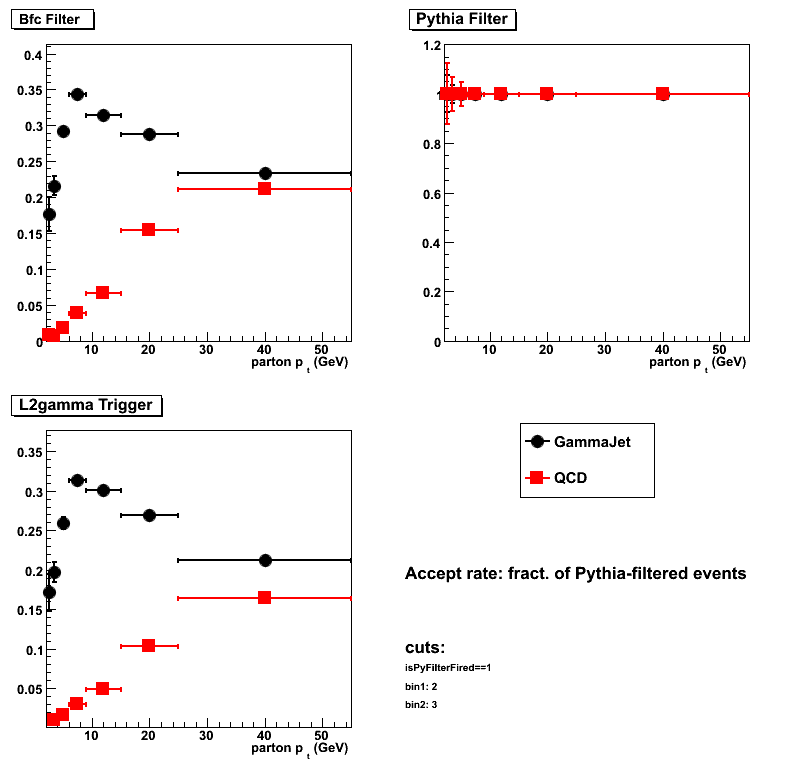
| Accept rate: fract. of Pythia-filtered events | |||
| GammaJet | |||
| pt bin | Bfc Filter | Pythia Filter | L2gamma Trigger |
| pt=2-3 | 0.17663 | 1 | 0.171196 |
| pt=3-4 | 0.215762 | 1 | 0.197028 |
| pt=4-6 | 0.291787 | 1 | 0.259407 |
| pt=6-9 | 0.344096 | 1 | 0.313814 |
| pt=9-15 | 0.314107 | 1 | 0.301254 |
| pt=15-25 | 0.28786 | 1 | 0.269798 |
| pt=25-55 | 0.233333 | 1 | 0.211693 |
| QCD | |||
| pt bin | Bfc Filter | Pythia Filter | L2gamma Trigger |
| pt=2-3 | 0.00775194 | 1 | 0 |
| pt=3-4 | 0.00702576 | 1 | 0.00936768 |
| pt=4-6 | 0.0183276 | 1 | 0.0160367 |
| pt=6-9 | 0.0386111 | 1 | 0.0294444 |
| pt=9-15 | 0.0667111 | 1 | 0.048618 |
| pt=15-25 | 0.154816 | 1 | 0.102706 |
| pt=25-55 | 0.211691 | 1 | 0.163545 |
Figure 4: False rejection relative to Pythia filter accepted events
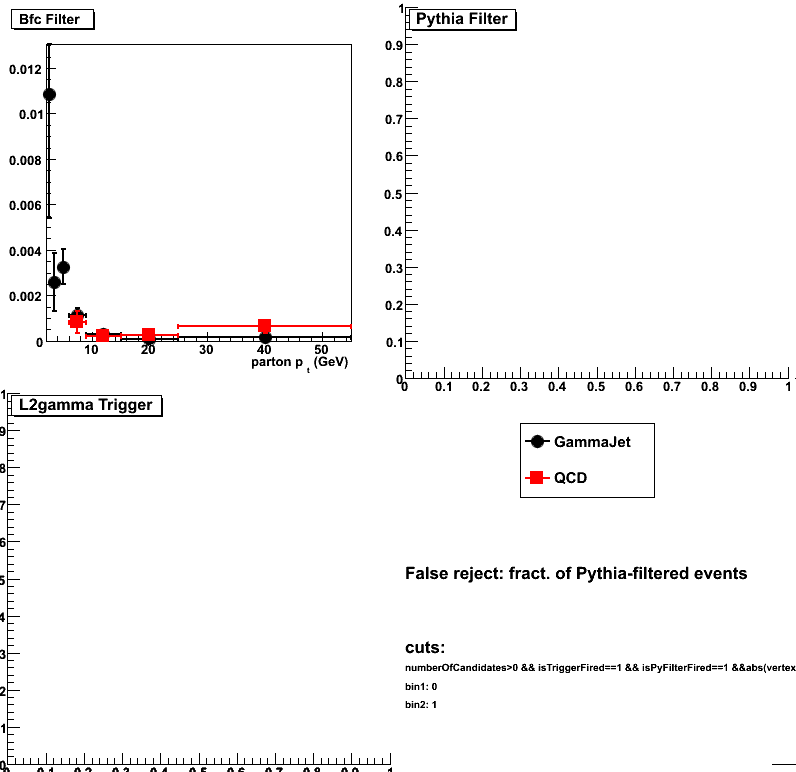
| False reject: fract. of Pythia-filtered events | |||
| GammaJet | |||
| pt bin | Bfc Filter | Pythia Filter | L2gamma Trigger |
| pt=2-3 | 0.0108696 | 0 | 0 |
| pt=3-4 | 0.00258398 | 0 | 0 |
| pt=4-6 | 0.00325615 | 0 | 0 |
| pt=6-9 | 0.00113448 | 0 | 0 |
| pt=9-15 | 0.00031736 | 0 | 0 |
| pt=15-25 | 9.50661e-05 | 0 | 0 |
| pt=25-55 | 0.00017452 | 0 | 0 |
| QCD | |||
| pt bin | Bfc Filter | Pythia Filter | L2gamma Trigger |
| pt=2-3 | 0 | 0 | 0 |
| pt=3-4 | 0 | 0 | 0 |
| pt=4-6 | 0 | 0 | 0 |
| pt=6-9 | 0.000833333 | 0 | 0 |
| pt=9-15 | 0.000222 | 0 | 0 |
| pt=15-25 | 0.000252143 | 0 | 0 |
| pt=25-55 | 0.000628536 | 0 | 0 |
Figure 5: False rejection relative to trigger accepted events

| False reject: fract. of triggered events | |||
| GammaJet | |||
| pt bin | Bfc Filter | Pythia Filter | L2gamma Trigger |
| pt=2-3 | 0.623377 | 0.558442 | 0 |
| pt=3-4 | 0.517081 | 0.464286 | 0 |
| pt=4-6 | 0.240594 | 0.192369 | 0 |
| pt=6-9 | 0.0348961 | 0.0167821 | 0 |
| pt=9-15 | 0.0111308 | 0.00151783 | 0 |
| pt=15-25 | 0.00872776 | 0.00134273 | 0 |
| pt=25-55 | 0.00966543 | 0.00148699 | 0 |
| QCD | |||
| pt bin | Bfc Filter | Pythia Filter | L2gamma Trigger |
| pt=2-3 | 0.333333 | 0.333333 | 0 |
| pt=3-4 | 0.363636 | 0.181818 | 0 |
| pt=4-6 | 0.631579 | 0.263158 | 0 |
| pt=6-9 | 0.282258 | 0.0887097 | 0 |
| pt=9-15 | 0.202151 | 0.0301075 | 0 |
| pt=15-25 | 0.0686901 | 0.000798722 | 0 |
| pt=25-55 | 0.0291545 | 0.000728863 | 0 |
05 May
May 2010 posts
2010.05.03 Pythia/BFC gamma-filter accaptance vs. gamma candidate pt (after gamma-maker 3x3 cluser fix)
Related inks:
- BFC and Pythia filter biases vs. partonic pt
- 3x3 clusering and gamma maker fix
- Alice' study with QCD sample
- QCD and gamma-jet data samples are described here
(filter parameters are listed below)
Number of generated events per partnic pt bin:
gamma-jet: 25K
QCD(2-4): 50K
QCD(4-55): 25K
Pythia filter configuration
StEemcGammaFilter:: running the TEST mode (accepting all events). Set mFilterMode=1 to actually reject events
StEemcGammaFilter:: mConeRadius 0.22 mSeedThreshold 3.8 mClusterThreshold 5 mEtaLow 0.95 mEtaHigh 2.1 mMaxVertex 120
StEemcGammaFilter:: mCalDepth 279.5 mMinPartEnergy 1e-05 mHadronScale 1 mFilterMode 0 mPrintLevel 1
BFC filter configuration
StChain:INFO - Init() : Using gamma filter on the EEMC
StChain:INFO - Init() : EEMC Sampling Fraction = 0.05
StChain:INFO - Init() : Seed energy threshold = 3.8 GeV
StChain:INFO - Init() : Cluster eT threshold = 5 GeV
StChain:INFO - Init() : Maximum vertex = +/- 120 cm
StChain:INFO - Init() : Running the TEST mode (accepting all events). Set mFilterMode=1 to actually reject events in BFC
StEEmcSlowMaker configuration
BFC:INFO - setTowerGainSpread(): gain spread: 0; gain mean value: 1.1
GammaMaker configuration
runSimuGammaTreeMaker():: GammaMaker config: ConeRadius 0.7 ClusterEtThreshold 5.5 SeedEnergyThreshold 4.2 ClusterEnergyThreshold 5.5 BsmdRange 0.05237 EsmdR ange 20
A2Emaker configuration
StEEmcA2EMaker *EEanalysis = new StEEmcA2EMaker("mEEanalysis");
EEanalysis->threshold(3.0, 0); // tower threshold (ped+N sigma)
EEanalysis->threshold(3.0, 1); // pre1 threshold
EEanalysis->threshold(3.0, 2); // pre2 threshold
EEanalysis->threshold(3.0, 3); // post threshold
EEanalysis->threshold(3.0, 4); // smdu threshold
EEanalysis->threshold(3.0, 5); // smdv threshold
Trigger configuration
emulate L2E-gamma trigger for Run 2006 [eemc-http-mb-l2gamma:: id 137641]
Trigger conditions:
cluster Et (2x2) = 5.2GeV
seed Et = 3.7GeV
Accept/Reject relative to the total number of offline selected events
Definition: offline selected events are events which satisfy to the following conditions:
- Online condition (L2E-gamma trigger fired)
- Reconstructed vetrex (|v_z|<120cm)
- Offline condition (at least one gammaMaker candidate found)
Figure 1a:
(upper plots) Gamma candidate yields vs. candidate pt (all partonic pt bins, no pt weights)
(lower plots) False rejection: histograms in the upper panel scaled by L2E-gamma-trigger yield (blue histogram)

Figure 1b: Same ad Fig. 1a with zoom into low pt region

Yields for each of partonic pt bins separately
Figure 2: Same ad Fig. 1b for partonic pt=2-3
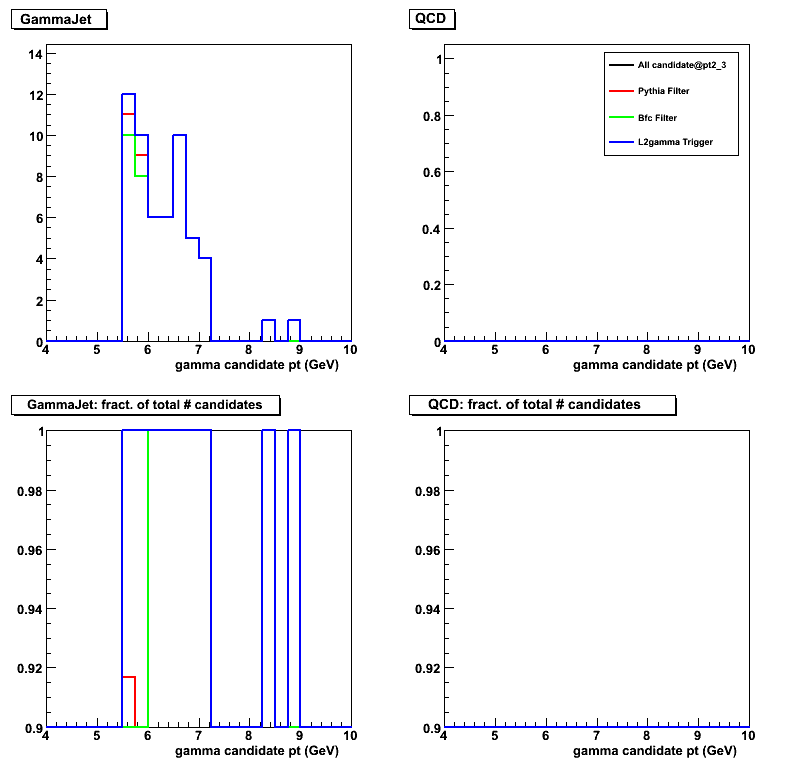
Figure 3: Same ad Fig. 1b for partonic pt=3-4
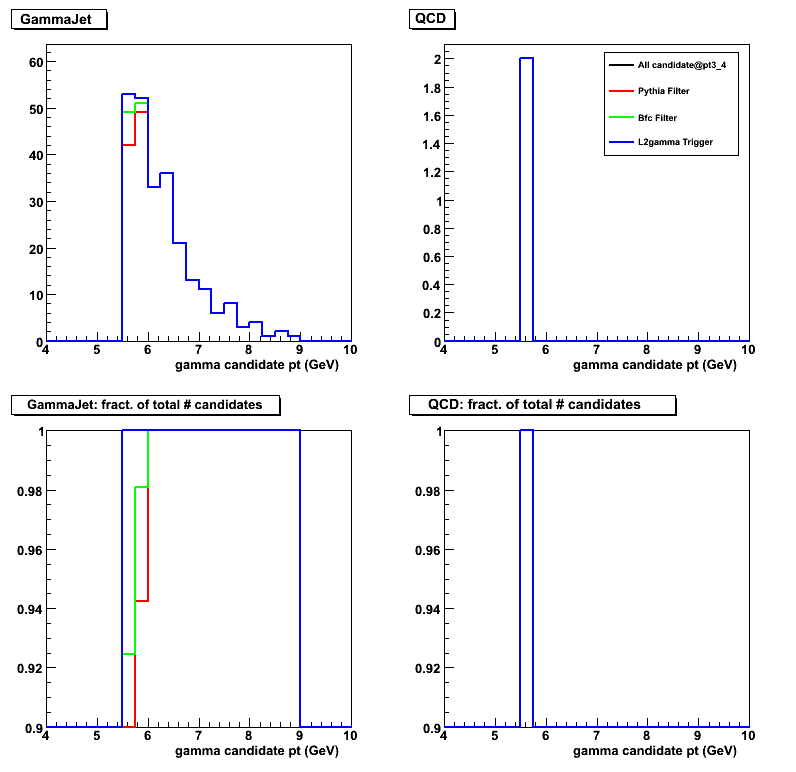
Figure 4: Same ad Fig. 1b for partonic pt=4-6
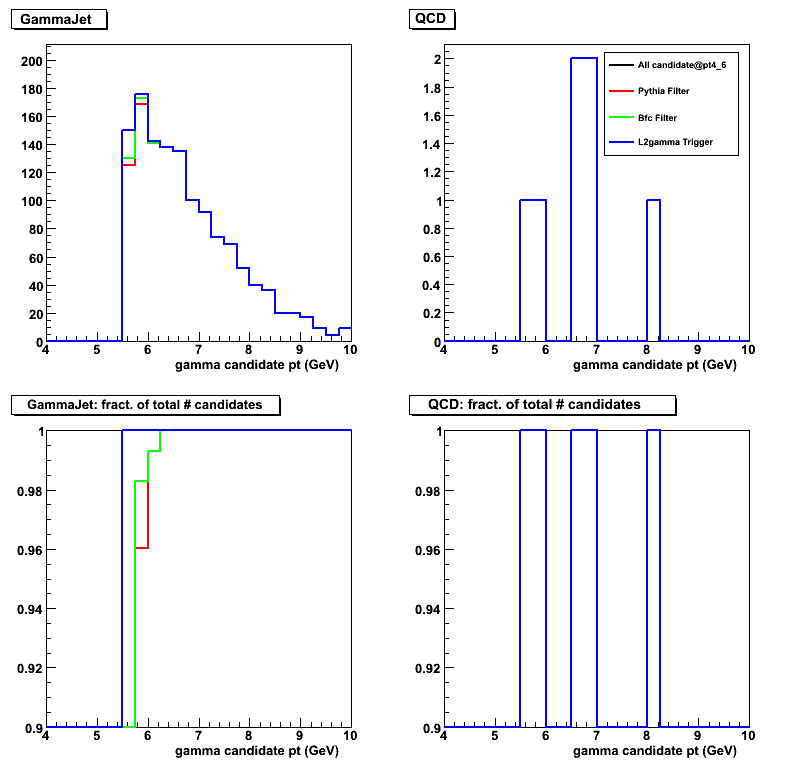
Figure 5: Same ad Fig. 1b for partonic pt=6-9
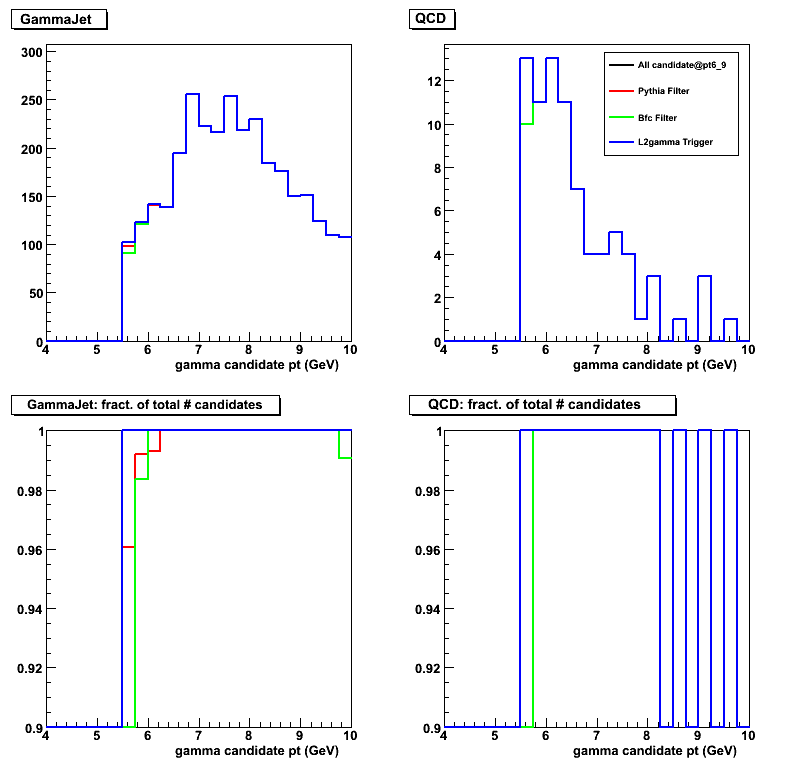
Figure 6: Same ad Fig. 1b for partonic pt=9-15
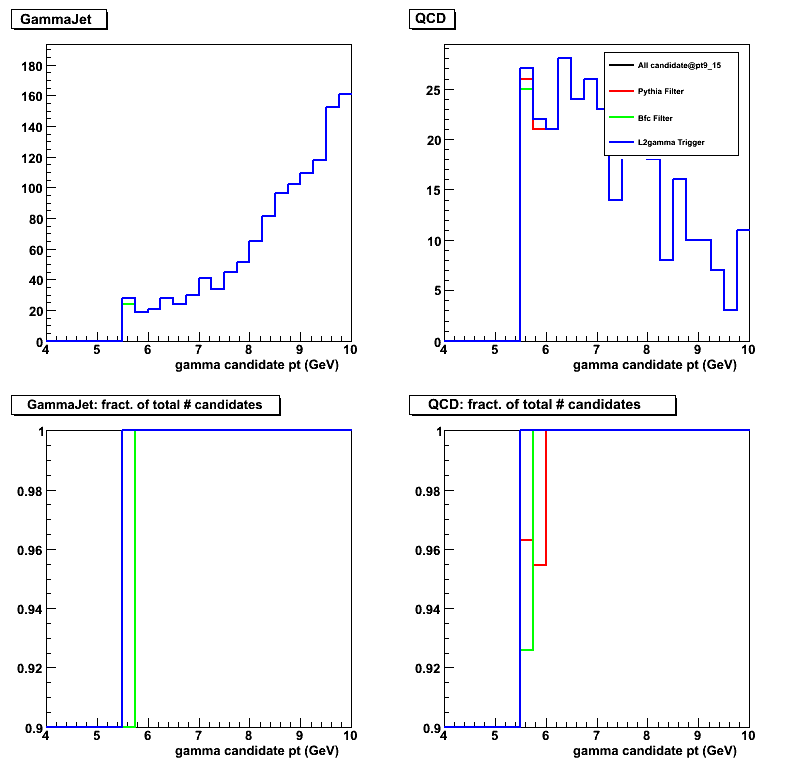
Figure 7: Same ad Fig. 1b for partonic pt=15-25
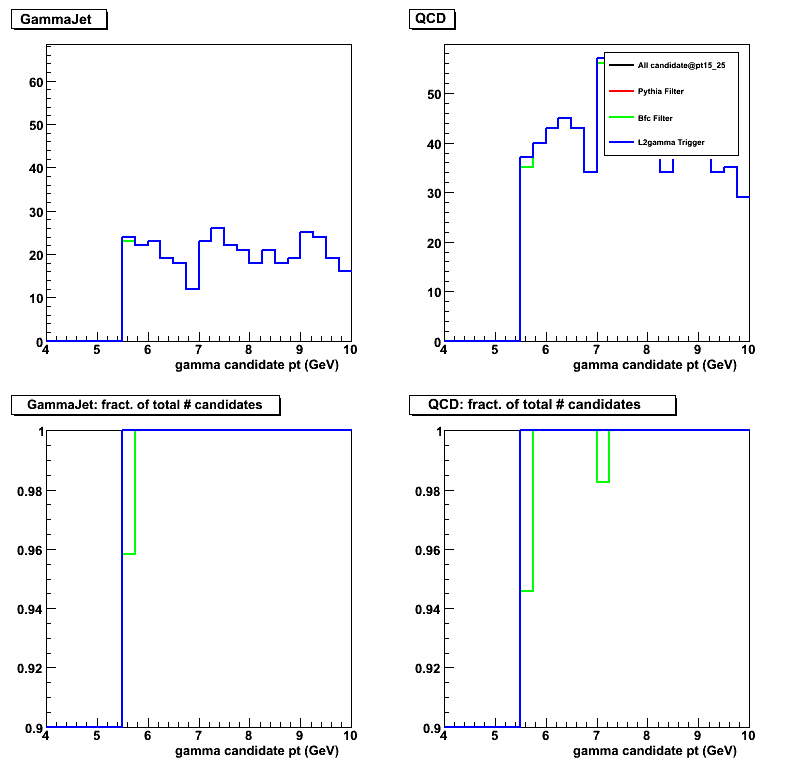
Figure 8: Same ad Fig. 1b for partonic pt=25-55
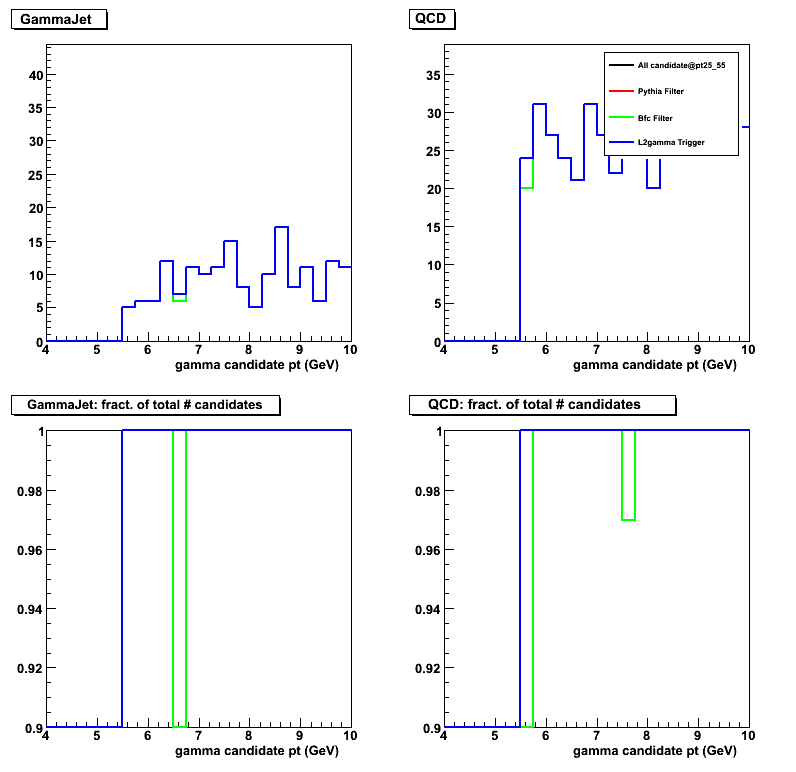
2010.05.05 Starsim/bfc timing tests
Related inks:
Figure 1: BFC filter processing time for accepted events
Note an extra peaks around 23/33/43 seconds for the QCD sample
(they also present but less pronounced in gamma-jet sample)
I found that these are processing times needed for the first accepted by filter events
(not always the time for the first processed event and depends on filter acceptance rate).
Processing is much longer due to time needed to initiaize additional stuff in bfc makers
and it is ignored in the total cpu time estimate
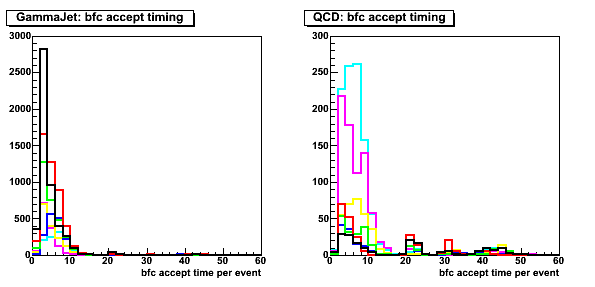
Figure 1b:
1st row: starsim time per partonic pt bin
2nd row: bfc time for accepted events per partonic pt bin
3rd row: bfc time for rejected events per partonic pt bin
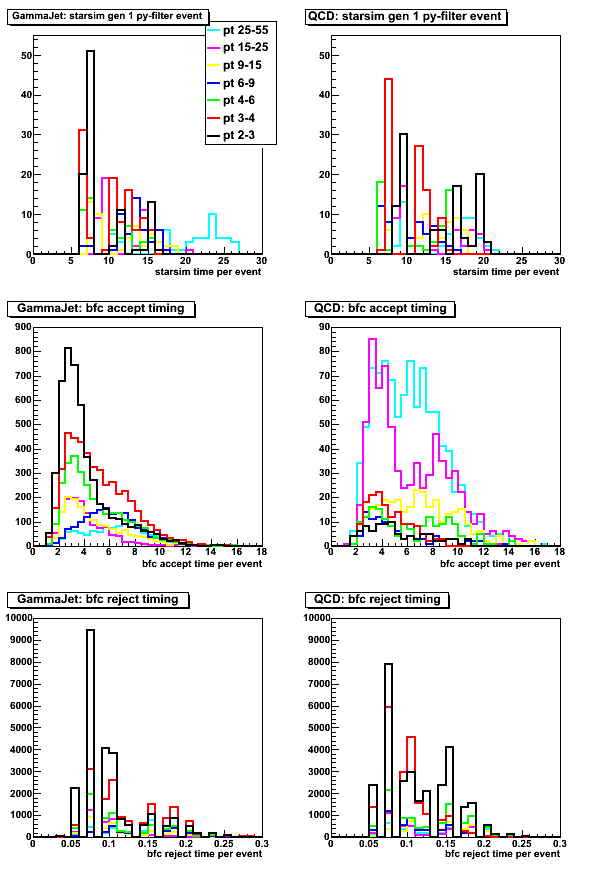
Average starsim/bfc timing (ignoring times in Fig. 1 with more that 18 seconds):
Gamma-jets bfc:acc starsim bfc:rej
pt=25-55 6.49765 20.2376 0.139911
pt=15-25 4.04562 11.8268 0.095903
pt=9-15 4.84475 11.4816 0.112344
pt=6-9 6.19909 13.0528 0.143109
pt=4-6 4.86546 9.8856 0.114983
pt=3-4 5.07415 10.404 0.12363
pt=2-3 4.04254 9.04627 0.0995413
QCD bfc:acc starsim bfc:rej
pt=25-55 6.18626 14.9944 0.13752
pt=15-25 6.20077 12.9668 0.126722
pt=9-15 6.848 13.7706 0.140625
pt=6-9 5.29513 10.3708 0.110363
pt=4-6 6.29547 11.5318 0.127077
pt=3-4 4.45859 10.1538 0.0986285
pt=2-3 5.26187 13.9151 0.114372
2010.05.13 BFC and Pythia QA after Pythia Eta -> - Eta
Related inks:
- Results before bug fix (See Fig. 1 upper right)
Pythia filter bug details:
bug in Pythia Filter StEemcGammaFilter.cxx:
double scale = (mCalDepth-v[2]) / p[2];
for(unsigned int j = 0; j < 3; ++j) p[j] = p[j] * scale + v[j];
Should be "abs(p[2])" in the "scale" factor.
Otherwise this will transfer all - Eta -> Eta,
and such tracks will pass the consequent Endcap rapidity cut:
if(detectorV.Eta() < mEtaLow || detectorV.Eta() > mEtaHigh) continue;
what will increase Pythia filter accept rate by a factor of 2.
Number of generated events per partnic pt bin:
Note: not every jib finished due to RCF scheduler upgrade
gamma-jet: 25K
QCD(2-4): 50K
QCD(4-55): 25K
Pythia filter configuration
StEemcGammaFilter:: running the TEST mode (accepting all events). Set mFilterMode=1 to actually reject events
StEemcGammaFilter:: mConeRadius 0.22 mSeedThreshold 3.8 mClusterThreshold 5 mEtaLow 0.95 mEtaHigh 2.1 mMaxVertex 120
StEemcGammaFilter:: mCalDepth 279.5 mMinPartEnergy 1e-05 mHadronScale 1 mFilterMode 0 mPrintLevel 1
BFC filter configuration
StChain:INFO - Init() : Using gamma filter on the EEMC
StChain:INFO - Init() : EEMC Sampling Fraction = 0.05
StChain:INFO - Init() : Seed energy threshold = 3.3 GeV
StChain:INFO - Init() : Cluster eT threshold = 4.5 GeV
StChain:INFO - Init() : Maximum vertex = +/- 120 cm
StChain:INFO - Init() : Running the TEST mode (accepting all events). Set mFilterMode=1 to actually reject events in BFC
StEEmcSlowMaker configuration
BFC:INFO - setTowerGainSpread(): gain spread: 0; gain mean value: 1.1
GammaMaker configuration
runSimuGammaTreeMaker():: GammaMaker config: ConeRadius 0.7 ClusterEtThreshold 5.5 SeedEnergyThreshold 4.2 ClusterEnergyThreshold 5.5 BsmdRange 0.05237 EsmdR ange 20
A2Emaker configuration
StEEmcA2EMaker *EEanalysis = new StEEmcA2EMaker("mEEanalysis");
EEanalysis->threshold(3.0, 0); // tower threshold (ped+N sigma)
EEanalysis->threshold(3.0, 1); // pre1 threshold
EEanalysis->threshold(3.0, 2); // pre2 threshold
EEanalysis->threshold(3.0, 3); // post threshold
EEanalysis->threshold(3.0, 4); // smdu threshold
EEanalysis->threshold(3.0, 5); // smdv threshold
Trigger configuration
emulate L2E-gamma trigger for Run 2006 [eemc-http-mb-l2gamma:: id 137641]
Trigger conditions:
cluster Et (2x2) = 5.2GeV
seed Et = 3.7GeV
Accept/Reject relative to the total number of Pythia generated events
Figure 1: Fraction of accepted events
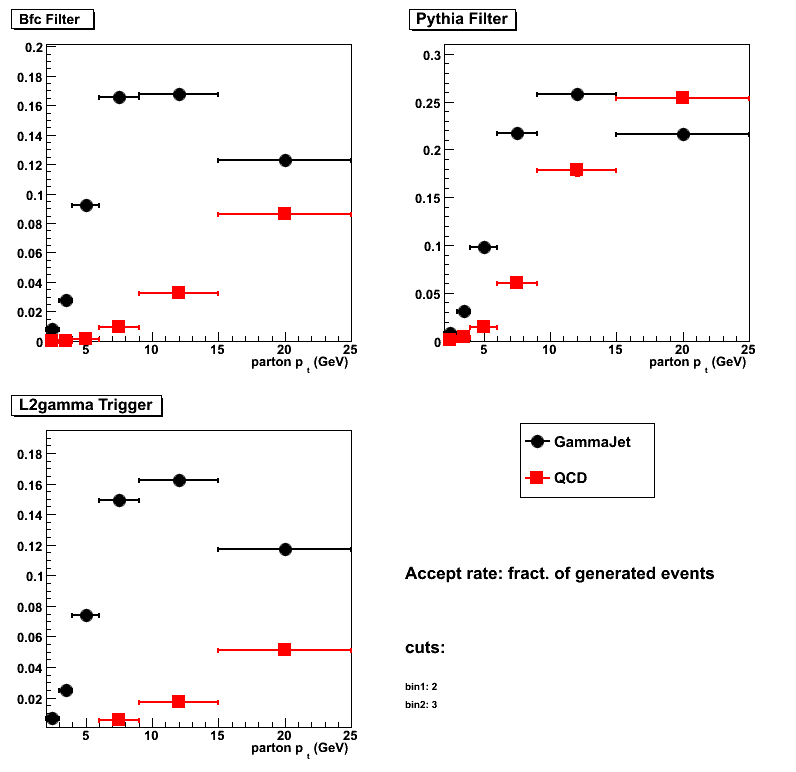
| Accept rate: fract. of generated events | |||
| GammaJet | |||
| pt bin | Bfc Filter | Pythia Filter | L2gamma Trigger |
| pt=2-3 | 0.00772455 | 0.00820359 | 0.00646707 |
| pt=3-4 | 0.0276027 | 0.0311644 | 0.024726 |
| pt=4-6 | 0.0924862 | 0.0980663 | 0.0743646 |
| pt=6-9 | 0.165708 | 0.217554 | 0.149013 |
| pt=9-15 | 0.167815 | 0.258319 | 0.162353 |
| pt=15-25 | 0.123 | 0.215667 | 0.117083 |
| QCD | |||
| pt bin | Bfc Filter | Pythia Filter | L2gamma Trigger |
| pt=2-3 | 0.000107527 | 0.000430108 | 0.000107527 |
| pt=3-4 | 0.000117647 | 0.00358824 | 5.88235e-05 |
| pt=4-6 | 0.00115385 | 0.0146154 | 0.000576923 |
| pt=6-9 | 0.00932927 | 0.06 | 0.00530488 |
| pt=9-15 | 0.0325 | 0.178846 | 0.0173077 |
| pt=15-25 | 0.0860331 | 0.253802 | 0.0510331 |
Figure 2: False rejection

| False reject: fract. of generated events | |||
| GammaJet | |||
| pt bin | Bfc Filter | Pythia Filter | L2gamma Trigger |
| pt=2-3 | 0 | 0.000359281 | 0 |
| pt=3-4 | 0 | 0.000616438 | 0 |
| pt=4-6 | 0.000165746 | 0.00436464 | 0 |
| pt=6-9 | 0.000128755 | 0.00270386 | 0 |
| pt=9-15 | 0 | 0.000210084 | 0 |
| pt=15-25 | 0.00025 | 0.00025 | 0 |
| QCD | |||
| pt bin | Bfc Filter | Pythia Filter | L2gamma Trigger |
| pt=2-3 | 0 | 0 | 0 |
| pt=3-4 | 0 | 0 | 0 |
| pt=4-6 | 0 | 0 | 0 |
| pt=6-9 | 0 | 0.000121951 | 0 |
| pt=9-15 | 0 | 0 | 0 |
| pt=15-25 | 4.13223e-05 | 0.000123967 | 0 |
Accept/Reject relative to the number of Pythia filter accepted events
| Accept rate: fract. of Pythia-filtered events | |||
| GammaJet | |||
| pt bin | Bfc Filter | Pythia Filter | L2gamma Trigger |
| pt=2-3 | 0.518248 | 1 | 0.49635 |
| pt=3-4 | 0.505495 | 1 | 0.525275 |
| pt=4-6 | 0.663662 | 1 | 0.614648 |
| pt=6-9 | 0.703492 | 1 | 0.64707 |
| pt=9-15 | 0.645576 | 1 | 0.605563 |
| pt=15-25 | 0.568006 | 1 | 0.510433 |
| QCD | |||
| pt bin | Bfc Filter | Pythia Filter | L2gamma Trigger |
| pt=2-3 | 0.02857 | 1 | 0 |
| pt=3-4 | 0.05161 | 1 | 0 |
| pt=4-6 | 0.0526316 | 1 | 0.0394737 |
| pt=6-9 | 0.126016 | 1 | 0.0731707 |
| pt=9-15 | 0.173118 | 1 | 0.0935484 |
| pt=15-25 | 0.334419 | 1 | 0.194074 |
2010.05.27 Run 6 and Run 9 jet Tree production
Useful inks:
- Run 6 Murad's note:
http://www.star.bnl.gov/HyperNews-star/protected/get/jetfinding/664/1/1.html - Run 9 Pibero's note:
http://www.star.bnl.gov/HyperNews-star/protected/get/jetfinding/1010.html - Jan's note on "tower ADC - pedestal > 3 * RMS":
http://www.star.bnl.gov/HyperNews-star/protected/get/jetfinding/1010/2.html - Ily'as post on EEMC only jets for 5-hit branch:
http://www.star.bnl.gov/HyperNews-star/protected/get/jetfinding/1010/3/1/1/1/2.html - Trigger list for Run 9:
http://www.star.bnl.gov/protected/common/common2009/trigger2009/triggers2009.html - Pibero's jet tree format:
http://www4.rcf.bnl.gov/~pibero/spin/jets/2010.04.20 - Disk space estimates for Run 9:
http://www.star.bnl.gov/HyperNews-star/protected/get/ jetfinding/1010/1/1/2/1.html
http://www.star.bnl.gov/HyperNews-star/protected/get/ jetfinding/1010/3/1/1/1.html
http://www.star.bnl.gov/HyperNews-star/protected/get/ jetfinding/1010/3/1/1/1/2/1. html
New jet tree format
Description can be found here
Jet finder Run 6 configuration
Jet tree branches
- 12-point branch
- 5-point branch (EEMC jets only)
General configuration
- cone radius = 0.7
- track/tower pT > 0.2 GeV
- trigger IDs: See the list below
- all primary vertices with rank > 0
- hadronic correction: 100% subtraction scheme
- track |DCA| < 3 cm
- pT-dependent DCAxy cut
- track (number of hits) / (number of possible hits) > 0.51
- track last point radius > 125 cm (ensure we get at least one point in TPC outer sector)
- tower E > 0
- tower status = 1
- tower ADC - pedestal > 3 * RMS
Triggers
pp@200GeV
addTrigger(127611); //HTTP
137611
5
127821 //HTTP-fast
137821
137822
127212 //HT2
137213
127501 //JP0
137501
127622 //JP0-etot
137622
127221 //JP1
137221
137222
137585 //bemc-jp2
127641 // eemc-http-mb-l2gamma
137641 // eemc-http-mb-l2gamma
6 // eemc-http-mb-l2gamma
Analysis cuts
StppAnaPars* anapars = new StppAnaPars();
anapars->setFlagMin(0);
anapars->setNhits(12);
anapars->setCutPtMin(0.2);
anapars->setAbsEtaMax(2.5);
anapars->setJetPtMin(3.5);
anapars->setJetEtaMax(100.0);
anapars->setJetEtaMin(0);
anapars->setJetNmin(0);
Cone finder configuration
StConePars* cpars = new StConePars();
cpars->setGridSpacing(105, -3.0, 3.0, 120,-TMath::Pi(),TMath::Pi());
cpars->setConeRadius(0.7);
cpars->setSeedEtMin(0.5);
cpars->setAssocEtMin(0.1);
cpars->setSplitFraction(0.5);
cpars->setPerformMinimization(true);
cpars->setAddMidpoints(true);
cpars->setRequireStableMidpoints(true);
cpars->setDoSplitMerge(true);
cpars->setDebug(false);
jetMaker->addAnalyzer(anapars, cpars, bet4pMaker, "ConeJets12");
anapars->setNhits(5);
jetMaker->addAnalyzer(anapars, cpars, bet4pMaker, "ConeJets5");
Disk space required
needs to be updated
Jet finder Run 9 configuration:
Jet tree branches
- 12-point branch
- Tower-only branch (jets without tracking)
- 5-point branch (EEMC jets only)
General configuration
- cone radius = 0.7
- track/tower pT > 0.2 GeV
- trigger IDs: JP1, L2JetHigh, BBCMB-Cat2 (luminosity monitor)
- all primary vertices with rank > 0
- hadronic correction: 100% subtraction scheme
- track |DCA| < 3 cm
- pT-dependent DCAxy cut (a la Run 6 with slight tuning around 0.5 < pT < 1.5 GeV)
- track chi^2 < 4
- track (number of hits) / (number of possible hits) > 0.51
- track last point radius > 125 cm (ensure we get at least one point in TPC outer sector)
- tower E > 0
- tower status = 1
- tower ADC - pedestal > 3 * RMS
Triggers
pp@200GeV
240410 // JP1 // lum: 0.246
240411 // JP1 // lum: 4.045
240650 // L2JetHigh // lum: 3.745
240651 // L2JetHigh // lum: 1.811
240652 // L2JetHigh // lum: 19.769
240620 // L2BGamma // lum: 23.004
240630 // L2EGamma // lum: 3.969
240631 // L2EGamma // lum: 21.592
240013 // BBCMB-Cat2 (luminosity monitor)
240113 // BBCMB-Cat2 (luminosity monitor)
240123 // BBCMB-Cat2 (luminosity monitor)
240223 // BBCMB-Cat2 (luminosity monitor)
pp@500GeV
230410 // JP1 // lum: 0.198
230411 // JP2 // lum: 8.089
230630 // L2EGamma // lum: 3.347
230013 // BBCMB-Cat2 (luminosity monitor)
Analysis cuts
StppAnaPars* anapars = new StppAnaPars;
anapars->setFlagMin(0); // track->flag() > 0
anapars->setCutPtMin(0.2); // track->pt() > 0.2
anapars->setAbsEtaMax(2.5); // abs(track->eta()) < 2.5
anapars->setJetPtMin(5.0);
anapars->setJetEtaMax(100.0);
anapars->setJetEtaMin(0);
anapars->setJetNmin(0);
Cone finder configuration
StConePars* cpars = new StConePars;
cpars->setGridSpacing(105,-3.
cpars->setSeedEtMin(0.5);
cpars->setAssocEtMin(0.1);
cpars->setSplitFraction(0.5);
cpars->setPerformMinimization(
cpars->setAddMidpoints(true);
cpars->
cpars->setDoSplitMerge(true);
cpars->setDebug(false);
Disk space required
1Tb (see links at the top of the page for mode details)
2010.05.28 Photon-jet candidates - Perugia vs. Tune A
Comments:
- See no difference in yilds for different tunes for prompt photons.
- ~ 20% shape differenbce for QCD background Monte-Carlo
Figure 1: Reconstructed gamma-jet candidate yield vs. photon candidate pt in the endcap
(di-jet events found with the jet finder) Prompt photon filtered Monte-Carlo, partonic pt 3-25 GeV
(a)

(b) Same as (a) on a log scale
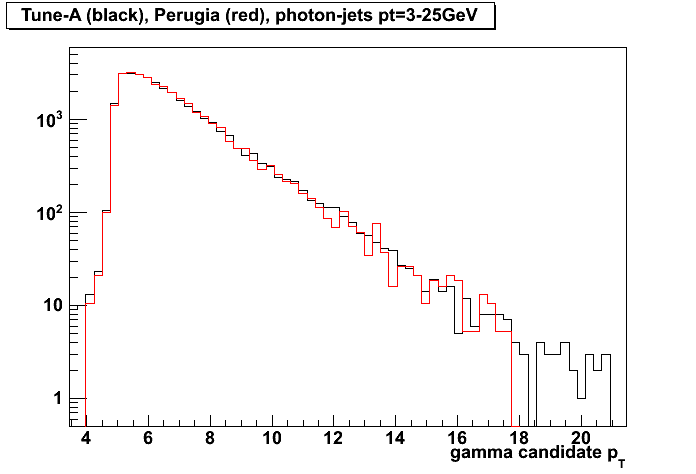
Figure 2: Same as Fig. 1 for QCD two processes filtered Monte-Carlo, partonic pt 6-9 GeV
(a)
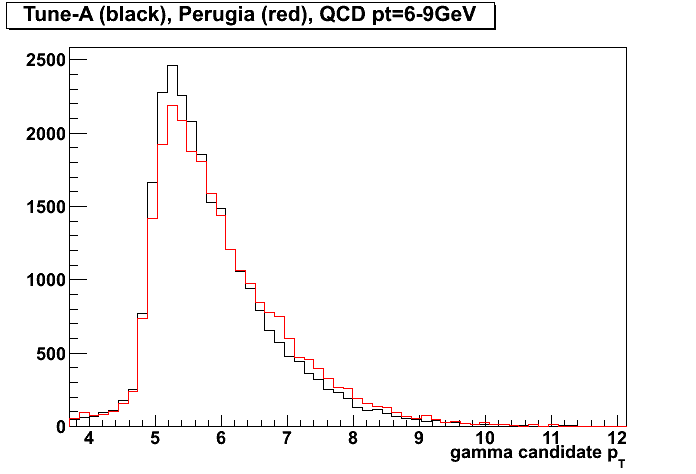
Same on a log scale
(b) Same as (a) on a log scale
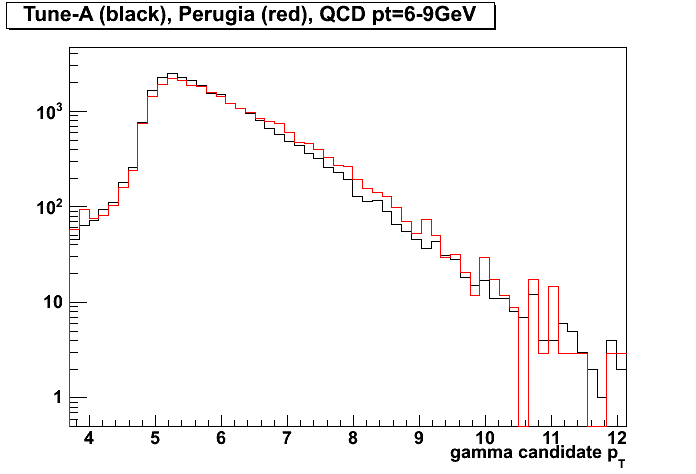
Figure 3: QCD ratio Tune-A/Perugia

EEMC simulation spreadsheet: prompt photons and QCD
Related links:
- Lowered bfc threshold bias tests and Pythia with Eta -> -Eta bug fix
- BFC bias tests with same thresholds as Pythia
- Alice pi0 bias tests with lowerd bfc thresholds
Same thresholds for Pythia/BFC
1.4M events, 6.8 CPU years, 0.29Tb disk space
| parton pt, GeV | Pythia acc | bfc acc wrt. Pythia | Total filter's acc | Sigma, pb | lumi, 1/pb | Number of filtered events to generate | Total CPU time, days | disk space, Gb | starsim CPU, sec | bfc CPU, sec | Total Starsim CPU time, days | Total bfc CPU time, days | bfc acc |
| g-jets | |||||||||||||
| 2-3 | 0.00820 | 0.2663 | 0.00218 | 1304000 | 10.0 | 28491 | 14.60576 | 4.45 | 10.72 | 4.0 | 13.270 | 1.34 | 0.00288 |
| 3-4 | 0.03116 | 0.3787 | 0.01180 | 293300 | 10.0 | 34611 | 14.85782 | 5.63 | 12.19 | 4.9 | 12.901 | 1.96 | 0.01504 |
| 4-6 | 0.09807 | 0.5521 | 0.05414 | 126300 | 10.0 | 68382 | 20.99942 | 11.34 | 12.04 | 4.7 | 17.254 | 3.75 | 0.06824 |
| 6-9 | 0.21755 | 0.6688 | 0.14550 | 26090 | 10.0 | 37961 | 7.79574 | 6.48 | 9.56 | 3.4 | 6.280 | 1.52 | 0.15848 |
| 9-15 | 0.25832 | 0.6274 | 0.16207 | 4675 | 10.0 | 7577 | 1.95231 | 1.31 | 11.56 | 3.8 | 1.616 | 0.34 | 0.15840 |
| 15-25 | 0.21567 | 0.5394 | 0.11633 | 326 | 10.0 | 379 | 0.13531 | 0.07 | 14.34 | 4.2 | 0.117 | 0.02 | 0.12112 |
| totals: | 1754691 | 177401 | 60.3 | 29.29 | |||||||||
| 0.18 | 0.16533 | years | |||||||||||
| QCD | |||||||||||||
| 2-3 | 0.00043 | 0.0185 | 0.00001 | 8226000000 | 0.1 | 6545 | 68.81525 | 1.30 | 16.62 | 9.9 | 68.064 | 0.75 | 0.00002 |
| 3-4 | 0.00359 | 0.0268 | 0.00010 | 1295000000 | 0.2 | 24907 | 140.98015 | 5.32 | 12.88 | 8.3 | 138.594 | 2.39 | 0.00006 |
| 4-6 | 0.01462 | 0.0450 | 0.00066 | 440300000 | 1.0 | 289582 | 925.73023 | 57.50 | 12.07 | 7.9 | 899.343 | 26.39 | 0.00072 |
| 6-9 | 0.06000 | 0.0744 | 0.00446 | 57830000 | 2.0 | 516306 | 915.77947 | 111.13 | 10.94 | 6.2 | 878.663 | 37.12 | 0.00564 |
| 9-15 | 0.17885 | 0.1354 | 0.02422 | 7629000 | 2.0 | 369484 | 360.48698 | 77.18 | 10.72 | 5.1 | 338.666 | 21.82 | 0.02420 |
| 15-25 | 0.25380 | 0.2754 | 0.06990 | 381900 | 1.0 | 26694 | 17.99424 | 5.57 | 14.43 | 5.9 | 16.185 | 1.81 | 0.07368 |
| totals: | 10027140900 | 1233518 | 2429.78632 | 258.01 | |||||||||
| 1.23 | 6.65695 | years | |||||||||||
| number of events, x 10e6 | CPU years | disk space, Gb | total time with 50 CPU, weeks | total time with 100 CPU, weeks | |||||||||
| 1.41 | 6.8 | 287.3 | 7.1 | 3.6 |
Lowered BFC threshold that Pythia
2M events, 6.9 CPU years, 0.41Tb disk space
| parton pt, GeV | Pythia acc | bfc acc wrt. Pythia | Total filter's acc | Sigma, pb | lumi, 1/pb | Number of filtered events to generate | Total CPU time, days | disk space, Gb | starsim CPU, sec | bfc CPU, sec | Total Starsim CPU time, days | Total bfc CPU time, days | bfc acc |
| g-jets | |||||||||||||
| 2-3 | 0.00820 | 0.51825 | 0.00425 | 1304000 | 10.0 | 55439 | 15.74249 | 8.66 | 10.72 | 3.9 | 13.270 | 2.47 | 0.00772 |
| 3-4 | 0.03116 | 0.50550 | 0.01575 | 293300 | 10.0 | 46205 | 15.47012 | 7.52 | 12.19 | 4.8 | 12.901 | 2.57 | 0.02760 |
| 4-6 | 0.09807 | 0.66366 | 0.06508 | 126300 | 10.0 | 82200 | 21.71983 | 13.64 | 12.04 | 4.7 | 17.254 | 4.47 | 0.09249 |
| 6-9 | 0.21755 | 0.70349 | 0.15305 | 26090 | 10.0 | 39930 | 7.87117 | 6.82 | 9.56 | 3.4 | 6.280 | 1.59 | 0.16571 |
| 9-15 | 0.25832 | 0.64558 | 0.16676 | 4675 | 10.0 | 7796 | 1.96162 | 1.35 | 11.56 | 3.8 | 1.616 | 0.35 | 0.16782 |
| 15-25 | 0.21567 | 0.56801 | 0.12250 | 326 | 10.0 | 399 | 0.13625 | 0.07 | 14.34 | 4.2 | 0.117 | 0.02 | 0.123 |
| totals: | 1754691 | 231970 | 62.9 | 38.05 | |||||||||
| 0.23 | 0.17233 | years | |||||||||||
| QCD | |||||||||||||
| 2-3 | 0.00043 | 0.02857 | 0.00001 | 8226000000 | 0.1 | 10108 | 68.99113 | 2.01 | 16.62 | 7.9 | 68.064 | 0.93 | 0.00011 |
| 3-4 | 0.00359 | 0.05161 | 0.00019 | 1295000000 | 0.2 | 47964 | 142.14305 | 10.25 | 12.88 | 6.4 | 138.594 | 3.55 | 0.00012 |
| 4-6 | 0.01462 | 0.05263 | 0.00077 | 440300000 | 1.0 | 338693 | 928.66220 | 67.25 | 12.07 | 7.5 | 899.343 | 29.32 | 0.00115 |
| 6-9 | 0.06000 | 0.12602 | 0.00756 | 57830000 | 2.0 | 874501 | 935.22936 | 188.22 | 10.94 | 5.6 | 878.663 | 56.57 | 0.00933 |
| 9-15 | 0.17885 | 0.17312 | 0.03096 | 7629000 | 2.0 | 472410 | 365.62683 | 98.68 | 10.72 | 4.9 | 338.666 | 26.96 | 0.0325 |
| 15-25 | 0.25380 | 0.33442 | 0.08488 | 381900 | 1.0 | 32414 | 18.35070 | 6.77 | 14.43 | 5.8 | 16.185 | 2.17 | 0.08603 |
| totals: | 10027140900 | 1776090 | 2459.00326 | 373.18 | |||||||||
| 1.78 | 6.73700 | years | |||||||||||
| number of events, x 10e6 | CPU years | disk space, Gb | total time with 50 CPU, weeks | total time with 100 CPU, weeks | |||||||||
| 2.01 | 6.9 | 411.2 | 7.2 | 3.6 |
(very rough) Run 9 estimates (with 20 sec reject and 30 sec accept bfc time)
1.4M events, 18.3 CPU years, 0.29Tb disk space
| parton pt, GeV | Pythia acc | bfc acc wrt. Pythia | Total filter's acc | Sigma, pb | lumi, 1/pb | Number of filtered events to generate | Total CPU time, days | disk space, Gb | starsim CPU, sec | bfc CPU, sec | bfc reject CPU / event | Total Starsim CPU time, days | Total bfc CPU time, days | Bfc accept CPU / event |
| g-jets | ||||||||||||||
| 2-3 | 0.00820 | 0.2663 | 0.00218 | 1304000 | 10.0 | 28491 | 41.33076 | 4.45 | 10.72 | 85.1 | 20 | 13.270 | 28.06 | 30.00 |
| 3-4 | 0.03116 | 0.3787 | 0.01180 | 293300 | 10.0 | 34611 | 38.06518 | 5.63 | 12.19 | 62.8 | 20 | 12.901 | 25.16 | 30.00 |
| 4-6 | 0.09807 | 0.5521 | 0.05414 | 126300 | 10.0 | 68382 | 53.83970 | 11.34 | 12.04 | 46.2 | 20 | 17.254 | 36.59 | 30.00 |
| 6-9 | 0.21755 | 0.6688 | 0.14550 | 26090 | 10.0 | 37961 | 23.81285 | 6.48 | 9.56 | 39.9 | 20 | 6.280 | 17.53 | 30.00 |
| 9-15 | 0.25832 | 0.6274 | 0.16207 | 4675 | 10.0 | 7577 | 5.28863 | 1.31 | 11.56 | 41.9 | 20 | 1.616 | 3.67 | 30.00 |
| 15-25 | 0.21567 | 0.5394 | 0.11633 | 326 | 10.0 | 379 | 0.32331 | 0.07 | 14.34 | 47.1 | 20 | 0.117 | 0.21 | 30.00 |
| totals: | 1754691 | 177401 | 162.7 | 29.29 | ||||||||||
| 0.18 | 0.44565 | years | ||||||||||||
| QCD | ||||||||||||||
| 2-3 | 0.00043 | 0.0185 | 0.00001 | 8226000000 | 0.1 | 6545 | 150.72171 | 1.30 | 16.62 | 1091.1 | 20 | 68.064 | 82.66 | 30.00 |
| 3-4 | 0.00359 | 0.0268 | 0.00010 | 1295000000 | 0.2 | 24907 | 356.60524 | 5.32 | 12.88 | 756.3 | 20 | 138.594 | 218.01 | 30.00 |
| 4-6 | 0.01462 | 0.0450 | 0.00066 | 440300000 | 1.0 | 289582 | 2422.48046 | 57.50 | 12.07 | 454.4 | 20 | 899.343 | 1523.14 | 30.00 |
| 6-9 | 0.06000 | 0.0744 | 0.00446 | 57830000 | 2.0 | 516306 | 2544.80915 | 111.13 | 10.94 | 278.8 | 20 | 878.663 | 1666.15 | 30.00 |
| 9-15 | 0.17885 | 0.1354 | 0.02422 | 7629000 | 2.0 | 369484 | 1013.10425 | 77.18 | 10.72 | 157.7 | 20 | 338.666 | 674.44 | 30.00 |
| 15-25 | 0.25380 | 0.2754 | 0.06990 | 381900 | 1.0 | 26694 | 41.71136 | 5.57 | 14.43 | 82.6 | 20 | 16.185 | 25.53 | 30.00 |
| totals: | 10027140900 | 1233518 | 6529.43217 | 258.01 | ||||||||||
| 1.23 | 17.88886 | years | ||||||||||||
| number of events, x 10e6 | CPU years | disk space, Gb | total time with 50 CPU, weeks | total time with 100 CPU, weeks | ||||||||||
| 1.41 | 18.3 | 287.3 | 19.1 | 9.6 |
06 Jun
June 2010 posts
2010.06.15 First look at data vs. TuneA/Perugia0 filtered MC with latest EEMC geometry
Data samples and colour coding
- black: pp2006 data
- open green: MC-QCD-TuneA, partonic pt 4-35
- solid green: MC-QCD-Perugia0, partonic pt 4-35
(these not shown yet -> still generating data points) - open red MC-prompt-photon-TuneA, partonic pt 3-35
- solid red MC-prompt-photon-Perugia0, partonic pt 3-35
Event selection
- di-jets from the cone jet-finder algorithm
- photon and jet are opposite in phi:
cos (phi_gamma-phi_jet) < -0.8 - pt away side jet > 5GeV
- detector eta of the away side jet: |eta_jet_det| < 0.8
- data: L2e-gamma triggered events
- No trigger emulation in Monte-Carlo yet
- MC scaled to 3.164^pb based on Pythia luminosity (no fudge factors)
Figure 1: Reconstructed photon candidate pt, pt_gamma (no cut on pt_gamma, pt_jet > 5GeV)
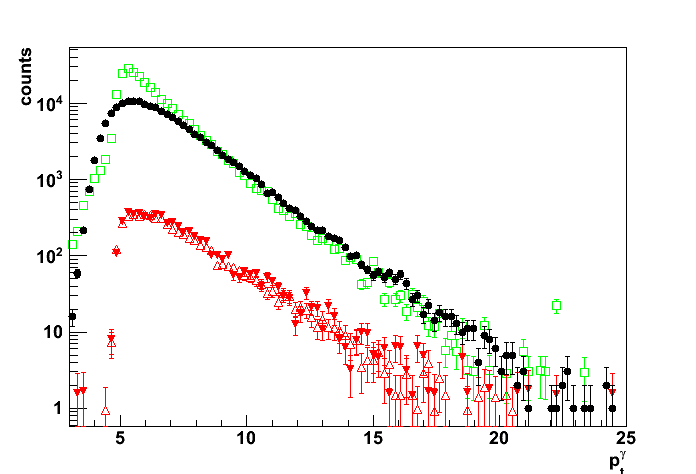
Figure 2: Partonic pt distribution (pt_gamma>7GeV, pt_jet > 5GeV)
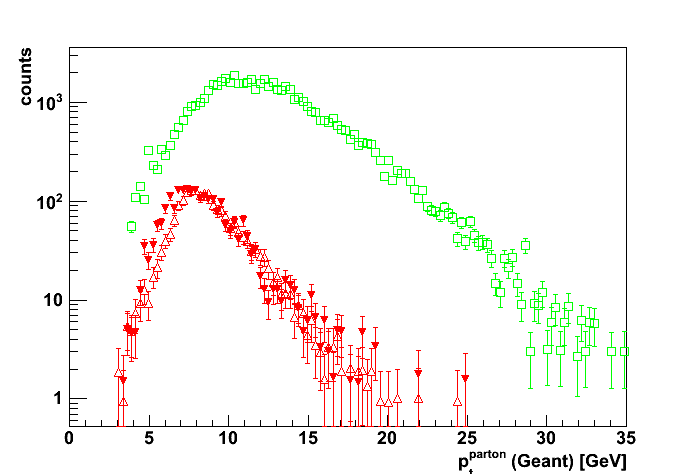
Figure 3: Estimate of the contribution from low partonic pt,
only QCD-TuneA MC are shown (pt_gamma>7GeV, pt_jet > 5GeV)
Black line: Exponential fit to partonic pt distribution in 4-7GeV range
(pt_gamma>7GeV cut for the photon candidate)
Red line: Exponential fit extrapolated to the partonic pt range below 4GeV.
Ratio of the area under the red line (integral pt=0-4geV)
to the area under the green line (integral pt=4-35GeV) is 0.0028.
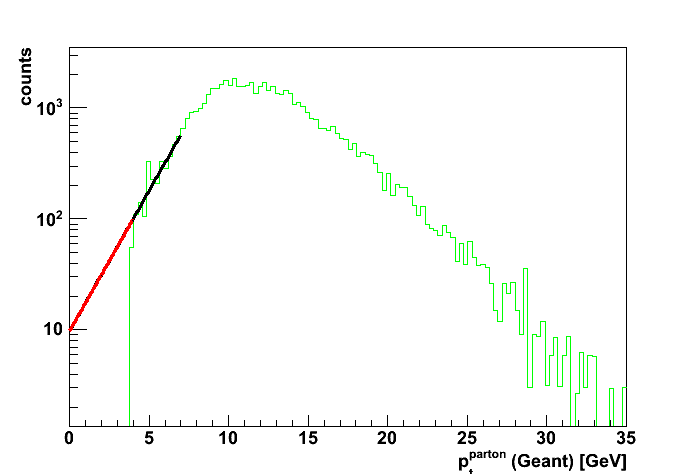
Comments
- (based on Fig. 3)
I would propose we drop both of the lowest parton pt bins,
i.e. pt=2-3 and pt=3-4 (Inherited error for pt_gamma>7GeV < 0.3%)
and instead use our CPU time to produce more
statistics in the 4-35 partonic pt range. - (based on Fig. 2)
There is a small difference between CDF-Tune-A and
Perugia0 tunes partonic pt distributions
even for the prompt photon Monte-Carlo. - Comparison with Perugia0 QCD MC is coming.
Hopefully after that we will be able to decide what
Pythia tune is better match the L2e-gamma data.
2010.06.17 Pythia TuneA/Perugia0 filtered MC vs. pp2006 data
Data samples and colour coding
- black circles: pp2006 data
- open green: MC-QCD-TuneA, partonic pt 4-35
- solid green: MC-QCD-Perugia0, partonic pt 4-35
- open red MC-prompt-photon-TuneA, partonic pt 3-35
- solid red MC-prompt-photon-Perugia0, partonic pt 3-35
Event selection
- di-jets from the cone jet-finder algorithm
- photon and jet are opposite in phi:
cos (phi_gamma-phi_jet) < -0.8 - pt away side jet > 5GeV
- detector eta of the away side jet: |eta_jet_det| < 0.8
- data: L2e-gamma triggered events
- No trigger emulation in Monte-Carlo yet
- MC scaled to 3.164^pb based on Pythia luminosity (no fudge factors)
Plots before cuts on photon candidate pt
Figure 1: Reconstructed photon candidate pt, pt_gamma (no cut on pt_gamma, pt_jet > 5GeV)
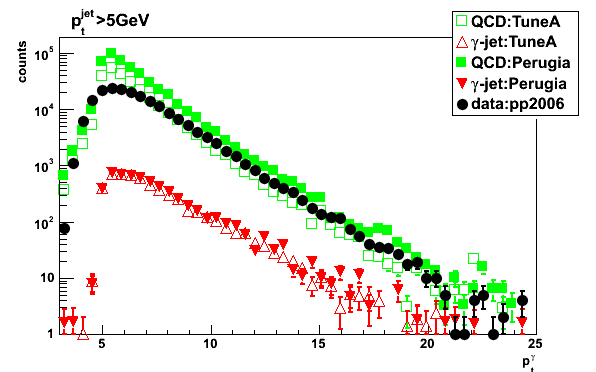
Figure 2: Partonic pt distribution (no cut on pt_gamma, pt_jet > 5GeV)

Plots with pt_gamma>7GeV cut
Figure 3: Partonic pt distribution (pt_gamma>7GeV, pt_jet > 5GeV)
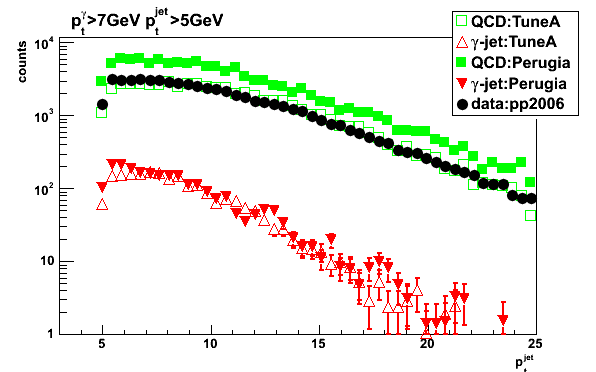
Figure 4: Away side jet pt (pt_gamma>7GeV, pt_jet > 5GeV)
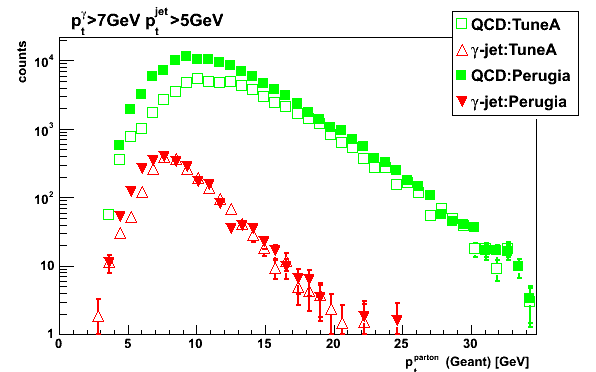
Figure 5: Reconstructed z vertex (pt_gamma>7GeV, pt_jet > 5GeV)

Figure 6: Partonic pt distribution for Pythia CDF-Tune-A QCD simulations (pt_gamma>7GeV, pt_jet > 5GeV)
Estimate of the contribution from low partonic pt:
Black line: Exponential fit to partonic pt distribution in 4-7GeV range
Red line: Exponential fit extrapolated to the partonic pt range below 4GeV.
Ratio of the area under the red line (integral over pt=0-4GeV)
to the area under the green line (integral over pt=4-35GeV) is 0.0028 (<0.3%)
Comments
-
Simulations with Perugia0 tune has a higher yield than that from CDF-Tune-A simulations
-
Shapes vs. partonic pt are different for Perugia0 and CDF-TuneA simulations
-
Shapes vs. reconstructed variables are similar for Perugia0 and CDF-TuneA simulations
-
(based on Fig. 6) I would propose we drop both of the lowest parton pt bins,
i.e. pt=2-3 and pt=3-4 (Inherited error for pt_gamma>7GeV < 0.3%)
and instead use CPU time to produce more statistics in the 4-35 partonic pt range. -
More discussion at phana hyper news:
http://www.star.bnl.gov/HyperNews-star/protected/get/ phana/496.html
Additional figures
Figure 7a: Photon candidate yield vs. rapidity (pt_gamma>7GeV, pt_jet > 5GeV)
Left: pt_gamma>7GeV; right: zoom into eta < 1 region
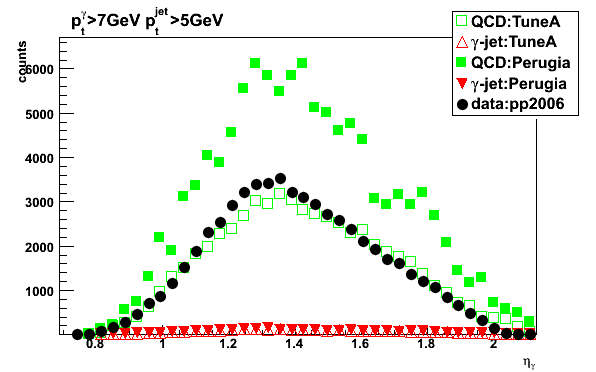
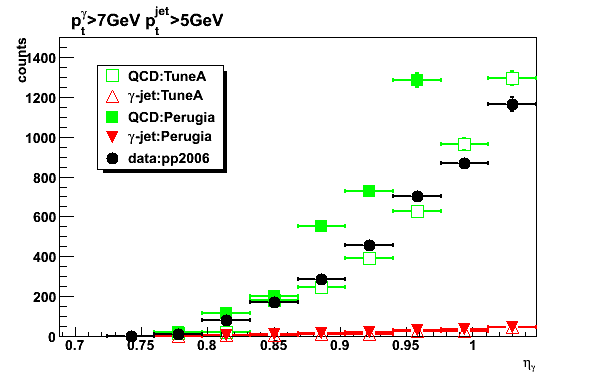
Figure 7b: yield vs. jet1 momentum (pt_gamma>7GeV, pt_jet > 5GeV)
Figure 7c: eta yield without pt_gamma cut
Yields ratio for eta <0.95 to the total yield is ~ 1.7% (1004/58766 = 0.0171)
Figure 8: Photon candidate yield vs. rapidity (pt_gamma>7GeV, pt_jet > 5GeV)

Note: trigger condition is not applied in simulations yet
but at high pt the data to Pythia CDF-Tune-A ratio is about 1.28 (at 9GeV: 3200/2500),
what is consistent with an additional 25% scaling factor
used for CIPANP 2009 presentation (see slide 6)
2010.06.18 L2e-gamma trigger effect: Py-CDF-Tune-A, Py-Perugia0, and pp2006 data comparison
Related posts
- Pythia and BFC filter QA vs. gamma candidate pt and eta
- L2e-gamma trigger effect with old Monte-Carlo (before EEMC geometry fix)
Data samples and colour coding
- black circles: pp2006 data
- open green: MC-QCD-TuneA, partonic pt 4-35
- solid green: MC-QCD-Perugia0, partonic pt 4-35
- open red MC-prompt-photon-TuneA, partonic pt 3-35
- solid red MC-prompt-photon-Perugia0, partonic pt 3-35
Event selection
- di-jets from the cone jet-finder algorithm
- photon and jet are opposite in phi:
cos (phi_gamma-phi_jet) < -0.8 - pt away side jet > 5GeV
- detector eta of the away side jet: |eta_jet_det| < 0.8
- data: L2e-gamma triggered events
- No trigger emulation in Monte-Carlo yet
- MC scaled to 3.164^pb based on Pythia luminosity (no fudge factors)
Figure 1: Reconstructed photon candidate pt, pt_gamma (no cut on pt_gamma, pt_jet > 5GeV)
Figure 2: Same as Fig. 1 with L2e-gamma condition simulated in Monte-Carlo
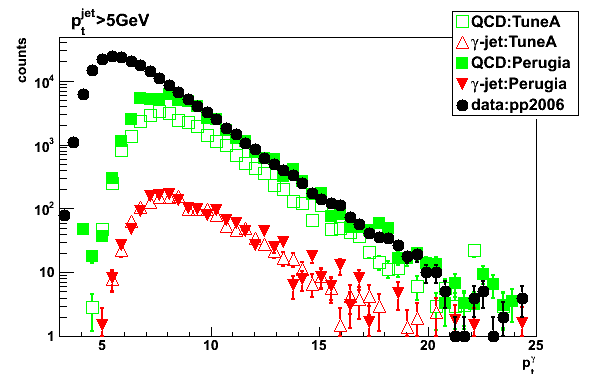
Figure 3: Same as Fig. 1, added distribution for photon pt from geant record (prompt photon MC only)

Figure 4: raw jet pt from jet trees: QCD pt=6-9
upper plot: mit0043 M. Betancourt simulations (MIT Simulation Productions)
bottom plot: new filtered MC


2010.06.28 Tests of L2e-gamma trigger emulation with single photon Monte-Carlo
Related links
- L2e-gamma trigger effect: Py-CDF-Tune-A, Py-Perugia0, and pp2006 data comparison
- http://www.star.bnl.gov/HyperNews-star/get/emc2/3531/1.html
- http://www.star.bnl.gov/HyperNews-star/protected/get/phana/499.html
Monte-Carlo configuration
- Single photon in the EEMC (flat in eta, pt, phi)
- Narrow vertex distribution with sigma=1cm
- 10 muons thrown in Barrel (|eta|<0.5) to reconstruct vertex
- 3 muons thrown in each BBC (|eta|~4) to fire the trigger
- Run 6 L2e-gamma-trigger id = 137641
- STAR geometry tag: y2006h
- Photon cuts:
1.1 < eta < 1.95
3 < pt < 15 GeV
0 < phi < 2pi
Trigger effect vs. thrown photon pt, eta, and energy
Figure 1:
Yields vs. thrown photon pt
left: Yields with (red) and without (black) L2e-gamma trigger condition
right: Yield ratio (with/without trigger)
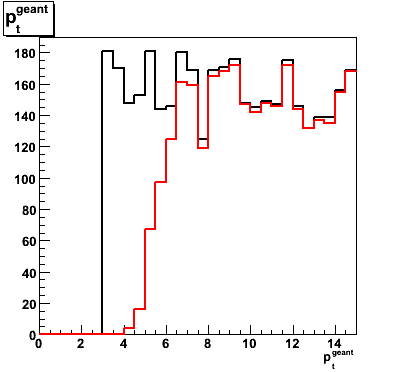
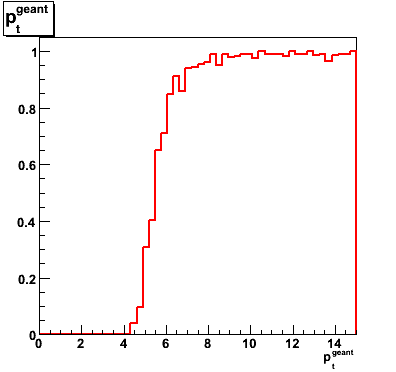
Figure 2: Same as Fig. 1 vs. thrown eta
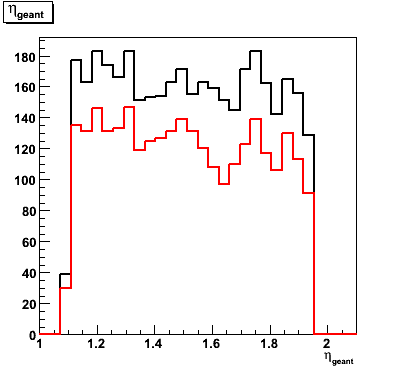
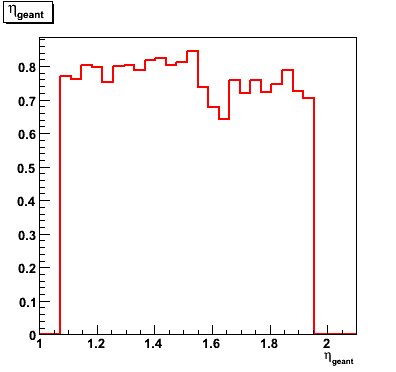
Figure 3: Same as Fig. 1 vs. thrown energy

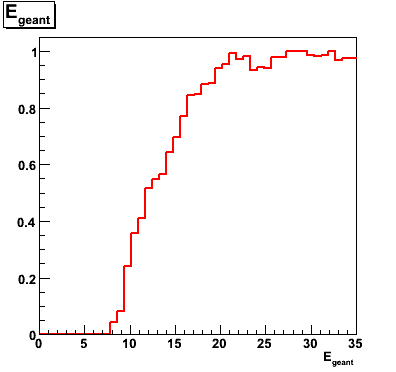
Trigger effect vs. reconstructed energy in the EEMC (high tower, 2x1, 3x3, energy and total E_T)
Figure 4: Same as Fig. 1 vs. total reconstructed transverse energy
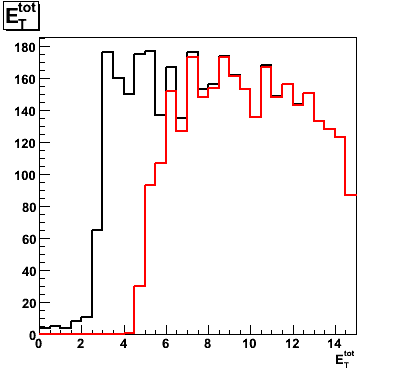
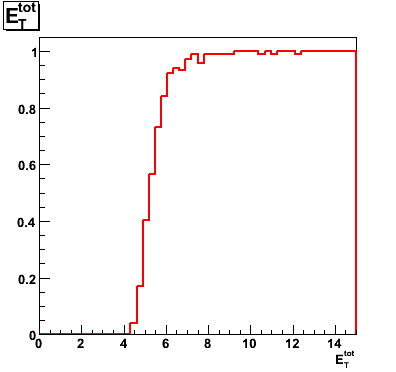
Figure 5: Same as Fig. 1 vs. reconstructed high tower energy
![]()
![]()
Figure 6: Same as Fig. 1 vs. reconstructed energy of the 2x1 tower cluster
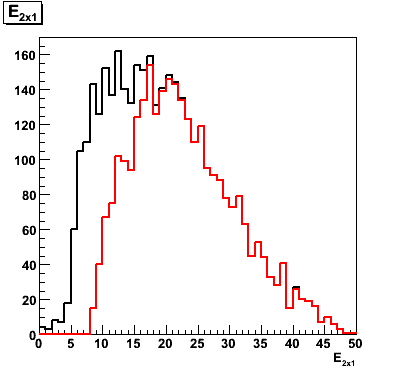
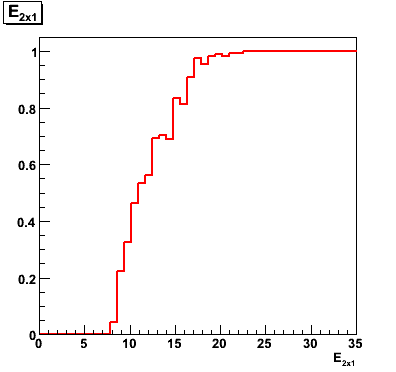
Figure 7: Same as Fig. 1 vs. reconstructed energy of the 3x3 tower cluster
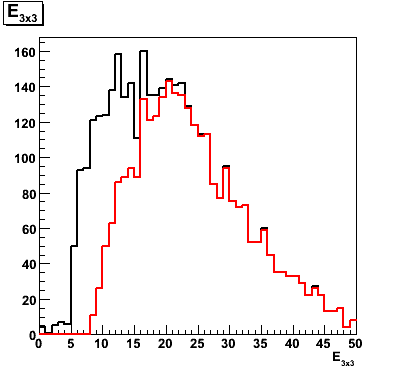
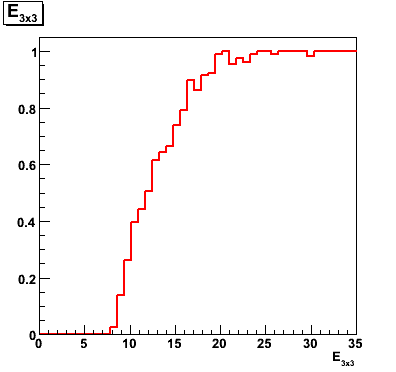
2010.06.30 Py-tunes (GEANT+L2e-gamma trigger) vs. Run 6 data
Related posts
- Michael's Perugia 0, Pro-pT0, and CDF Tune A comparison
- Previous comparison without trigger condition in simulations
- Tests of L2e-gamma trigger emulation with single photon Monte-Carlo
Data samples and colour coding
- black circles: pp2006 data
- open green: MC-QCD-TuneA, partonic pt 4-35
- solid green: MC-QCD-Perugia0, partonic pt 4-35
- open red MC-prompt-photon-TuneA, partonic pt 3-35
- solid red MC-prompt-photon-Perugia0, partonic pt 3-35
Event selection
- di-jets from the cone jet-finder algorithm
- photon and jet are opposite in phi:
cos (phi_gamma-phi_jet) < -0.8 - pt away side jet > 5GeV
- detector eta of the away side jet: |eta_jet_det| < 0.8
- data : L2e-gamma triggered events
- Monte-Carlo: emulated L2e-gamma triggered condition
- MC scaled to 3.164^pb based on Pythia luminosity (no fudge factors)
Figure 1: Reconstructed photon candidate pt (no pt_gamma cut, pt_jet > 5GeV)
L2e-gamma condition simulated in Monte-Carlo
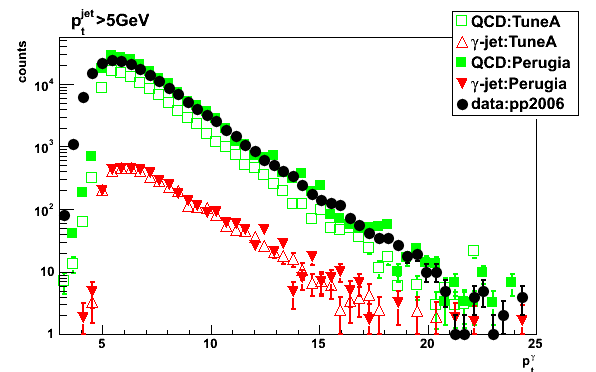
Figure 2: Yield ratios (no pt_gamma cut, pt_jet > 5GeV)
Black: data[pp2006] / QCD[Perigia0]
Green: QCD[Perigia0] / QCD[CDF-Tune-A]
Red: g-jet[Perigia0] / g-jet[CDF-Tune-A]
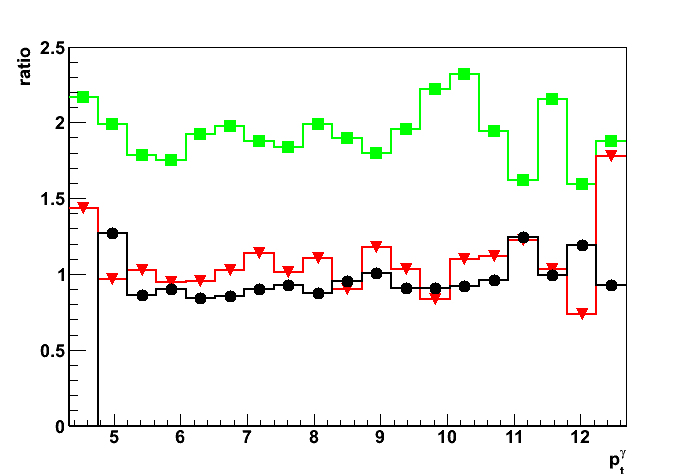
Figure 3: Vertex z distribution (pt_gamma>7GeV, pt_jet > 5GeV)
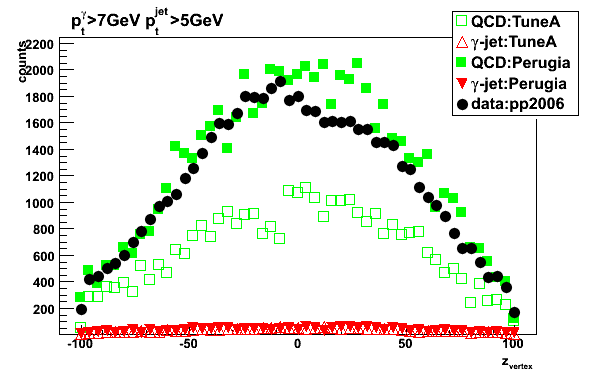
Figure 4: Simulation yield vs. partonic pt (no pt_gamma cut, pt_jet > 5GeV)
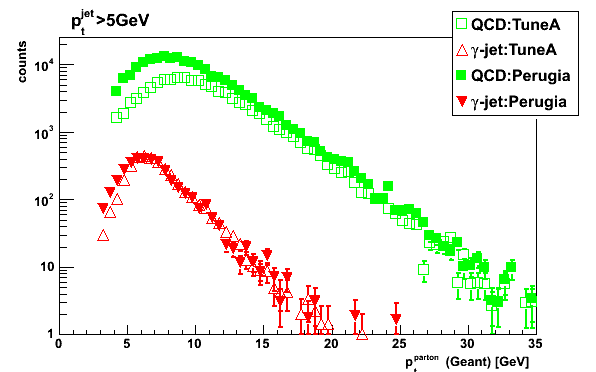
07 Jul
July 2010 posts
2010.07.02 Tests of L2e-gamma trigger emulation with full Pythia+Geant Monte-Carlo
Related posts
- Tests of L2e-gamma trigger emulation with single photon Monte-Carlo
- Yields for L2e-gamma triggered events
- Yields before applying the L2e-gamma trigger condition
- http://www.star.bnl.gov/HyperNews-star/protected/get/phana/501.html
Event selection
- di-jets from the cone jet-finder algorithm
- photon and jet are opposite in phi:
cos (phi_gamma-phi_jet) < -0.8 - pt away side jet > 5GeV
- detector eta of the away side jet: |eta_jet_det| < 0.8
- data : L2e-gamma triggered events
Run 6 L2e-gamma trigger algo: E_T[2x2] > 5.2, E_T[high tower]>3.7 - Monte-Carlo: emulated L2e-gamma triggered condition
- MC scaled to 3.164^pb based on Pythia luminosity (no fudge factors)
Plots for the ratio of N[passed L2] to N[before trigger]
Figure 1: Trigger effect vs. reconstructed photon candidate pt (3x3 patch) (no pt_gamma cut, pt_jet > 5GeV)
Dashed lines: Pythia Tune A, solid lines Pythia Perugia0 tune
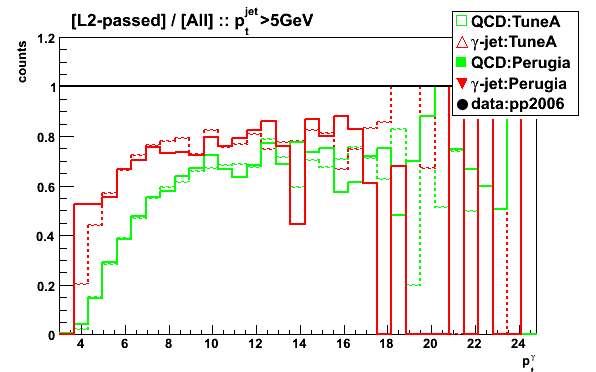
Figure 2: Trigger effect vs. simulated direct photon pt (no pt_gamma cut, pt_jet > 5GeV)
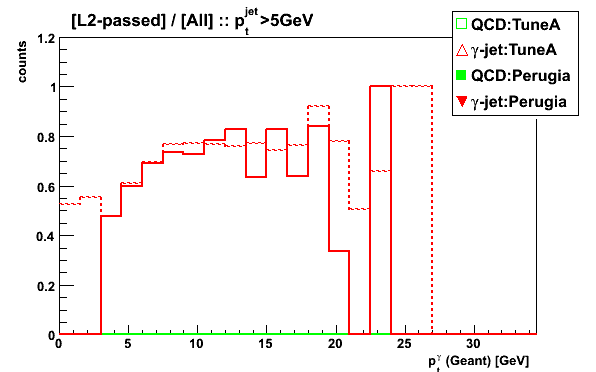
Figure 3: Trigger effect vs. simulated direct photon eta (no pt_gamma cut, pt_jet > 5GeV)

Figure 4: Trigger effect vs. reconstructed vertex z (no pt_gamma cut, pt_jet > 5GeV)

Figure 5: Trigger effect vs. reconstructed vertex z (with additional pt_gamma >7GeV, pt_jet > 5GeV)
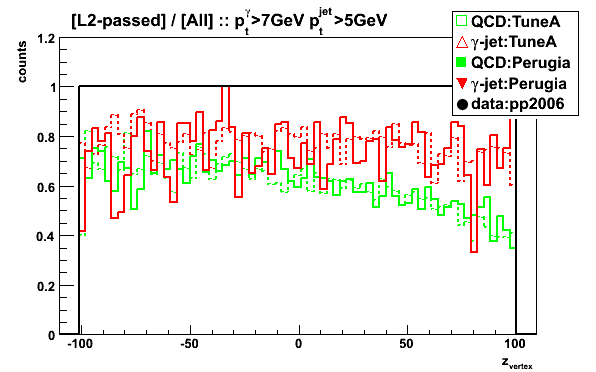
Figure 6: Trigger effect vs. 2x2 cluster Et (no pt_gamma cut, pt_jet > 5GeV)

Figure 7: Trigger effect vs. 1x1 cluster (high tower) Et (no pt_gamma cut, pt_jet > 5GeV)
![]()
2010.07.09 Table of L0-BBC, L0-EEMC, and L2Egamma triggers biases
Real and simulated trigger decisions:
- BBC stands for emulated L0 BBC trigger condition
- EEMC stands for emulated Run 6 L0 EEMC (137832) trigger condition
- L2 stands for emulated L2E-gamma (137641) trigger condition
- Trig event satisfied to all three simulated trigger conditions: BBC+EEMC+L2
- data-EEMC stands for real data L0 EEMC (137832) trigger condition
(available only for fast offline data, not filled in yet) - data-L2 stands for real data L2E-gamma (137641) trigger condition
Data samples:
- pp2006 data (3.4K events from st_physics production)
- Pythia prompt photon simulations (147 events gamma-filtered for partonic pt=3-25GeV)
- Pythia QCD 2->2 simulations (45 events gamma-filtered for partonic pt=6-9GeV)
Notations in the table:
- XXX=0 - stands for XXX trigger did not fired
- XXX=1 - stands for XXX trigger did fired
- XXX=0 YYY=1 stands for XXX trigger did not fired, but YYY did fired
| sample | Total | BBC=1 | EEMC=1 | L2=1 | L2=1 EEMC=0 | L2=1 BBC=0 | L2=0 BBC=1 | L2=0 EEMC=1 |
| pp2006, st_physics | ||||||||
| (counts) | 3396 | 3306 | 568 | 549 | 5 | 2 | 2759 | 24 |
| (%) | 1.0000 | 0.9735 | 0.1673 | 0.1617 | 0.0015 | 0.0006 | 0.8124 | 0.0071 |
| gamma-jets (3-25GeV) | ||||||||
| (counts) | 147 | 119 | 127 | 122 | 3 | 24 | 21 | 8 |
| (%) | 1 | 0.80952 | 0.86395 | 0.82993 | 0.020 | 0.16327 | 0.14286 | 0.054 |
| QCD (6-9GeV) | ||||||||
| (counts) | 45 | 38 | 19 | 19 | 1 | 4 | 23 | 1 |
| (%) | 1 | 0.84444 | 0.42222 | 0.42222 | 0.022 | 0.08889 | 0.51111 | 0.022 |
| simu vs. real triggers | data-EEMC=1 | data-L2=1 | L2=1 data-L2=0 | L2=0 data-L2=1 | Trig=1 data-L2=0 | Trig=0 data-L2=1 | EEMC=0 data-EEMC=1 | EEMC=1 data-EEMC=0 |
| 572 | 548 | 7 | 6 | 0 | 6 | 0 | 4 | |
| 0.1673 | 0.1617 | 0.0021 | 0.0018 | 0.0000 | 0.0018 | 0.0000 | 0.0012 | |
2010.07.14 Pythia/BFC gamma-filter bias tests (vs. gamma pt, eta, energy, and phi)
Related inks:
- Tests of L2e-gamma trigger emulation with full Pythia+Geant Monte-Carlo
- Previous study before filter emulator fixes
- QCD and gamma-jet data samples are described here
(filter parameters are listed below)
Number of generated events per partnic pt bin (pt binsa are: 2-3, 3-4, 4-6, 6-9, 9-15, 15-35):
gamma-jets (2-4): 25K/bin
gamma-jets (4-35): 12.5K/bin
QCD(2-4): 50K/bin
QCD(4-35): 25K/bin
Pythia filter configuration
StEemcGammaFilter:: running the TEST mode (accepting all events). Set mFilterMode=1 to actually reject events
StEemcGammaFilter:: mConeRadius 0.22 mSeedThreshold 3.8 mClusterThreshold 5 mEtaLow 0.95 mEtaHigh 2.1 mMaxVertex 120
StEemcGammaFilter:: mCalDepth 279.5 mMinPartEnergy 1e-05 mHadronScale 1 mFilterMode 0 mPrintLevel 1
BFC filter configuration
StChain:INFO - Init() : Using gamma filter on the EEMC
StChain:INFO - Init() : EEMC Sampling Fraction = 0.05
StChain:INFO - Init() : Seed energy threshold = 3.8 GeV
StChain:INFO - Init() : Cluster eT threshold = 5 GeV
StChain:INFO - Init() : Maximum vertex = +/- 120 cm
StChain:INFO - Init() : Running the TEST mode (accepting all events). Set mFilterMode=1 to actually reject events in BFC
StEEmcSlowMaker configuration
BFC:INFO - setTowerGainSpread(): gain spread: 0; gain mean value: 1 (Fig. 1 only)
BFC:INFO - setTowerGainSpread(): gain spread: 0; gain mean value: 1.1 (Fig. 2 and below)
GammaMaker configuration
runSimuGammaTreeMaker():: GammaMaker config: ConeRadius 0.7 ClusterEtThreshold 5.5 SeedEnergyThreshold 4.2 ClusterEnergyThreshold 5.5 BsmdRange 0.05237 EsmdR ange 20
A2Emaker configuration
StEEmcA2EMaker *EEanalysis = new StEEmcA2EMaker("mEEanalysis");
EEanalysis->threshold(3.0, 0); // tower threshold (ped+N sigma)
EEanalysis->threshold(3.0, 1); // pre1 threshold
EEanalysis->threshold(3.0, 2); // pre2 threshold
EEanalysis->threshold(3.0, 3); // post threshold
EEanalysis->threshold(3.0, 4); // smdu threshold
EEanalysis->threshold(3.0, 5); // smdv threshold
Trigger configuration
(Includes all recent fixes to trigger emulator configuration/software)
emulated L2E-gamma trigger for Run 2006 [eemc-http-mb-l2gamma:: id 137641]
Trigger conditions:
cluster Et (3x3) = 5.2GeV
seed Et = 3.7GeV
Accept/Reject relative to the total number of offline selected events
Definition: offline selected events are events which satisfy to the following conditions:
- Online condition (L2E-gamma trigger fired)
- Reconstructed vetrex (|v_z|<120cm)
- Offline condition (at least one gammaMaker candidate found)
Figure 1:
(upper plots) Gamma candidate yields vs. candidate pt (all partonic pt bins, no pt weights)
(lower plots) False rejection [histograms in the upper panel scaled by L2E-gamma-trigger yield (shown in blue)]
No gain shifts in StEEmcSlowMaker
Note: statistics without gain shifts is smaller because ~10-20% jobs died at RCF

Figure 2: Same as Fig. 1, but with +10% (1.1) gain shifts in StEEmcSlowMaker.
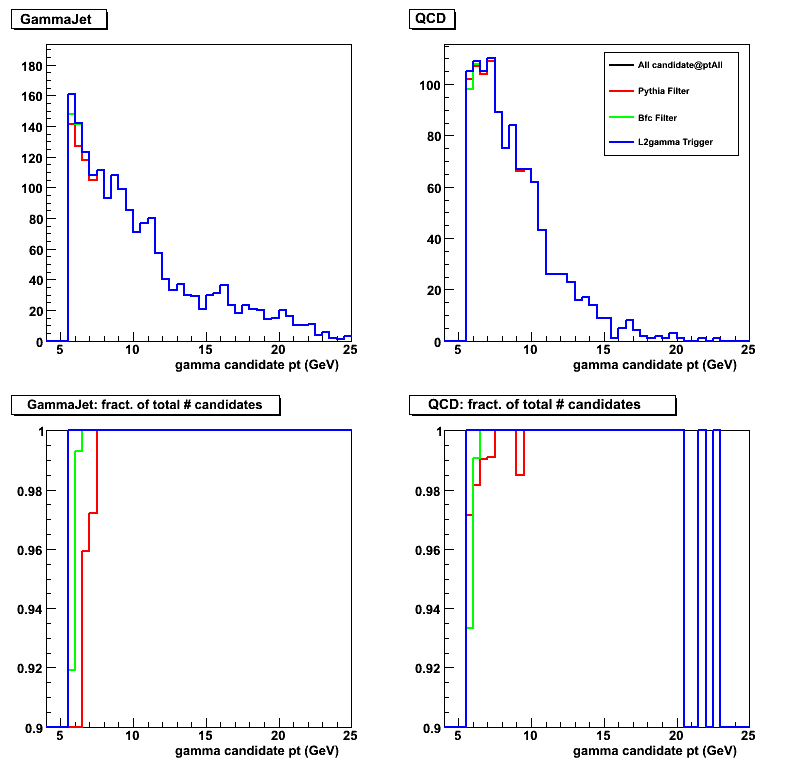
Figure 3: Same as Fig. 2 vs. candidate eta (with +10% (1.1) gain shifts in StEEmcSlowMaker).

Figure 4: Same as Fig. 2 vs. candidate azimuthal angle (with +10% (1.1) gain shifts in StEEmcSlowMaker).
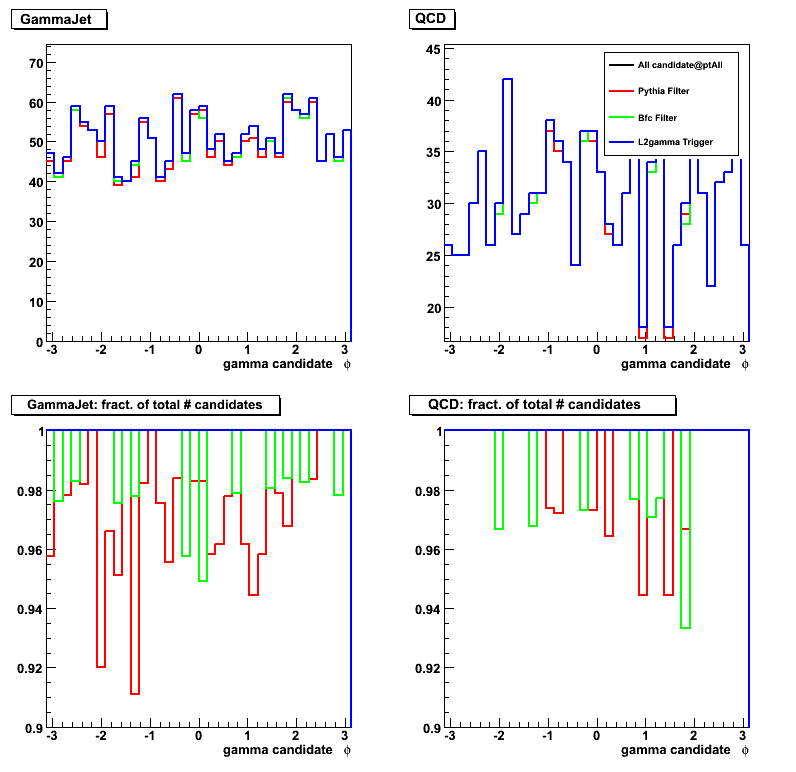
Figure 5: Same as Fig. 2 vs. energy (with +10% (1.1) gain shifts in StEEmcSlowMaker).
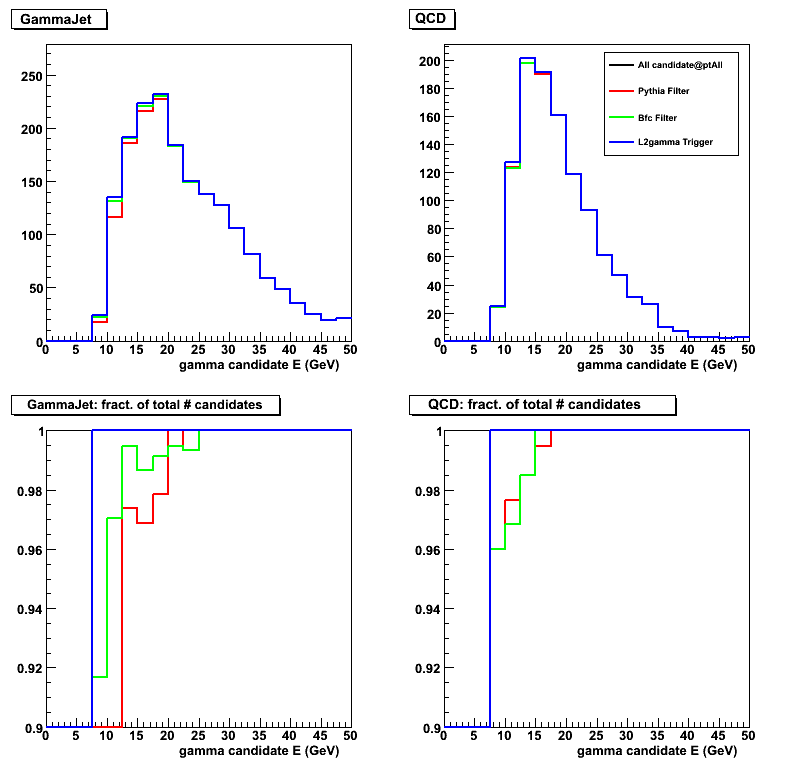
2010.07.16 Pythia/BFC gamma-filter bias tests with realistic gain variation
Related inks:
- Previous study with ideal gains and gain shift only of +10%
- Tests of L2e-gamma trigger emulation with full Pythia+Geant Monte-Carlo
- Previous study before filter emulator fixes
- QCD and gamma-jet data samples are described here
(filter parameters are listed below)
Number of generated events per partnic pt bin (pt binsa are: 2-3, 3-4, 4-6, 6-9, 9-15, 15-35):
gamma-jets (2-4): 25K/bin
gamma-jets (4-35): 12.5K/bin
QCD(2-4): 50K/bin
QCD(4-35): 25K/bin
Pythia filter configuration
StEemcGammaFilter:: running the TEST mode (accepting all events). Set mFilterMode=1 to actually reject events
StEemcGammaFilter:: mConeRadius 0.22 mSeedThreshold 3.8 mClusterThreshold 5 mEtaLow 0.95 mEtaHigh 2.1 mMaxVertex 120
StEemcGammaFilter:: mCalDepth 279.5 mMinPartEnergy 1e-05 mHadronScale 1 mFilterMode 0 mPrintLevel 1
BFC filter configuration
StChain:INFO - Init() : Using gamma filter on the EEMC
StChain:INFO - Init() : EEMC Sampling Fraction = 0.05
StChain:INFO - Init() : Seed energy threshold = 3.8 GeV
StChain:INFO - Init() : Cluster eT threshold = 5 GeV
StChain:INFO - Init() : Maximum vertex = +/- 120 cm
StChain:INFO - Init() : Running the TEST mode (accepting all events). Set mFilterMode=1 to actually reject events in BFC
StEEmcSlowMaker configuration with realistic gain shift/smearing
Figure 1: Error for gains from MIP study minus ideal
Data digitized from Scott's presentation at 2008 Calibartion workshop
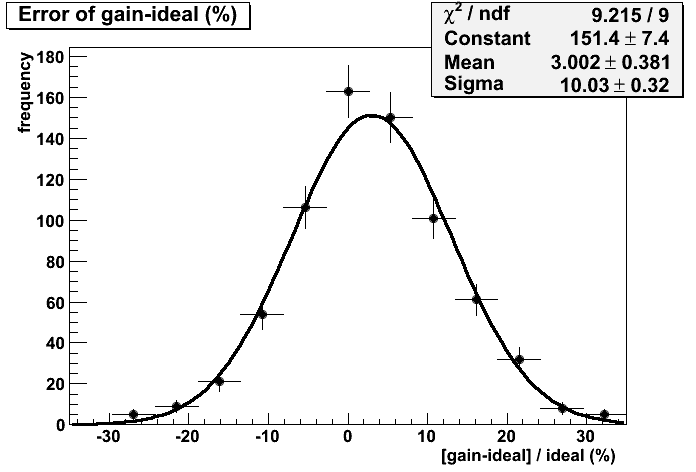
BFC:INFO - setTowerGainSpread(): gain spread: 0.1; gain mean value: 1.05 (Fig. 1,3 only)
BFC:INFO - setTowerGainSpread(): gain spread: 0.1; gain mean value: 0.95 (Fig. 2,4 and below)
GammaMaker configuration
runSimuGammaTreeMaker():: GammaMaker config: ConeRadius 0.7 ClusterEtThreshold 5.5 SeedEnergyThreshold 4.2 ClusterEnergyThreshold 5.5 BsmdRange 0.05237 EsmdR ange 20
A2Emaker configuration
StEEmcA2EMaker *EEanalysis = new StEEmcA2EMaker("mEEanalysis");
EEanalysis->threshold(3.0, 0); // tower threshold (ped+N sigma)
EEanalysis->threshold(3.0, 1); // pre1 threshold
EEanalysis->threshold(3.0, 2); // pre2 threshold
EEanalysis->threshold(3.0, 3); // post threshold
EEanalysis->threshold(3.0, 4); // smdu threshold
EEanalysis->threshold(3.0, 5); // smdv threshold
Trigger configuration
(Includes all recent fixes to trigger emulator configuration/software)
emulated L2E-gamma trigger for Run 2006 [eemc-http-mb-l2gamma:: id 137641]
Trigger conditions:
cluster Et (3x3) = 5.2GeV
seed Et = 3.7GeV
Accept/Reject relative to the total number of offline selected events
Definition: offline selected events are events which satisfy to the following conditions:
- Online condition (L2E-gamma trigger fired)
- Reconstructed vetrex (|v_z|<120cm)
- Offline condition (at least one gammaMaker candidate found)
Figure 2:
(upper plots) Gamma candidate yields vs. candidate pt (all partonic pt bins, no pt weights)
(lower plots) False rejection [histograms in the upper panel scaled by L2E-gamma-trigger yield (shown in blue)]
StEEmcSlowMaker configured with +5% (scale factor=1.05) gain shifts and 0.1 sigma
Previous plots: 125K events per pt-bin, 250K/pt-bin
(figure below combines previous statisitcs + 18K for partonic pt=6-9 and pt=9-15 GeV bins)
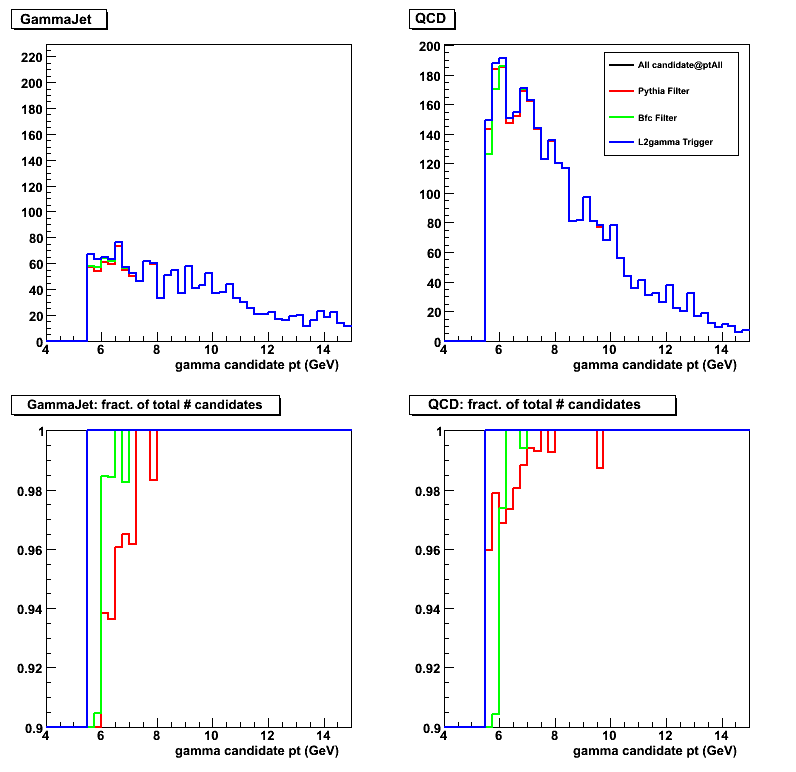
Figure 2b: Filter bias per partonic pt bin (QCD simulations only)

Figure 3: Same as Fig. 1 with gain shift=0.95 and sigma=0.1
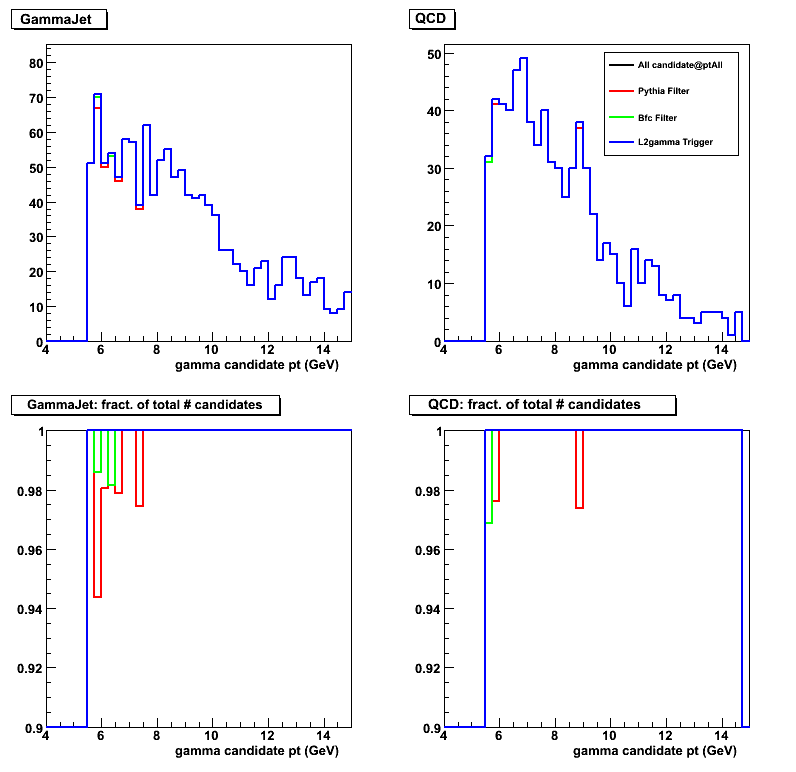
Figure 4: Same as Fig. 1 vs. candidate eta with gain shift=1.05 and sigma=0.1

Figure 5: Same as Fig. 1 vs. candidate eta with gain shift=0.95, sigma=0.1

2010.07.20 EEMC simulation spreadsheet: prompt photons and QCD (Updated)
Related links
Simulation request spreadsheet (QCD@L=2/pb, photons@L=10/pb)
| parton pt, GeV | Pythia acc | bfc acc wrt. Pythia | Total filter's acc | Sigma, pb | lumi, 1/pb | Number of filtered events to generate | Total CPU time, days | disk space, Gb |
Number of |
| g-jets | |||||||||
| 2-3 | 0.00870 | 0.2663 | 0.00232 | 1280000 | 10.0 | 29659 | 18.75 | 4.63 | 111360 |
| 3-4 | 0.03300 | 0.3787 | 0.01250 | 290000 | 10.0 | 36237 | 15.38 | 5.90 | 95700 |
| 4-6 | 0.10920 | 0.5521 | 0.06029 | 126700 | 10.0 | 76387 | 25.66 | 12.67 | 138356 |
| 6-9 | 0.22320 | 0.6688 | 0.14928 | 26860 | 10.0 | 40096 | 10.74 | 6.85 | 59952 |
| 9-15 | 0.25360 | 0.6274 | 0.15911 | 4636 | 10.0 | 7376 | 2.17 | 1.28 | 11757 |
| 15-35 | 0.21360 | 0.5394 | 0.11522 | 347 | 10.0 | 399 | 0.17 | 0.07 | 740 |
| totals: | 1728543 | 190154 | 72.9 | 31.40 | 417865 | ||||
| 0.19 | 0.2 | years | |||||||
| QCD | |||||||||
| 2-3 | 0.00067 | 0.0185 | 0.00001 | 8089000000 | 0.0 | 0 | 0.00 | ||
| 3-4 | 0.00298 | 0.0268 | 0.00008 | 1302000000 | 0.0 | 0 | 0.00 | ||
| 4-6 | 0.01312 | 0.0240 | 0.00031 | 413600000 | 2.0 | 260469 | 1428.35 | 51.72 | 10852864 |
| 6-9 | 0.06140 | 0.0640 | 0.00393 | 60620000 | 2.0 | 476425 | 1023.1 | 102.54 | 7444136 |
| 9-15 | 0.17692 | 0.1120 | 0.01982 | 7733000 | 2.0 | 306459 | 440.74 | 64.02 | 2736245 |
| 15-35 | 0.25480 | 0.2260 | 0.05758 | 404300 | 2.0 | 46563 | 34.53 | 9.72 | 206031 |
| totals: | 9873357300 | 1089916 | 2926.72 | 228.00 | 21239276 | ||||
| 1.09 | 8.02 | years | |||||||
|
QCD |
number of events, x 10e6 | CPU years | disk space, Gb | total time with 50 CPU, weeks | total time with 100 CPU, weeks | ||||
| 1 | .74 | 4.2 | 145.4 | 4.4 | 2.2 | ||||
| 2 |
1.28 | 8.2 | 259.4 | 8.6 | 4.3 |
Timing tests
Figure 1: Timing tests for BFC and Pythia gamma-filters (in seconds)
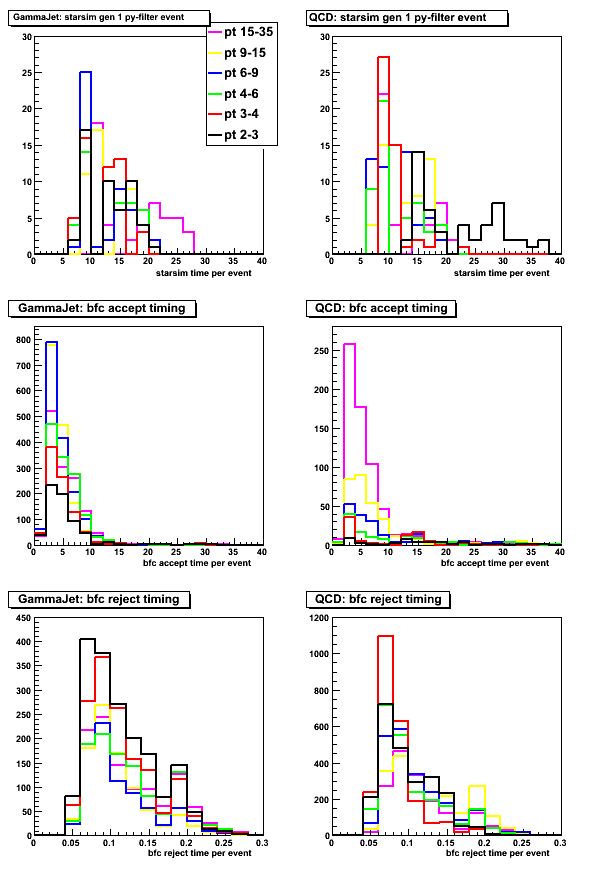
2010.07.22 Run 6 EEMC gamma-filtered simulation request
Submitted run-6 photon-jet simulation request for spin physics
Request last updated on Aug 19, 2010
Run 6 EEMC gamma-filtered simulation request summary
Total resources estimate for QCD with 1/pb and prompt-photon with 10/pb suimulations:
- CPU: 4.2 CPU years (2.2 weeks of running on a 100 CPUs)
- Disk space: 0.15Tb
- Numbe of filtered events: 0.74M
| partonic pt |
QCD | prompt photon | ||
| total | Pythia | total | Pythia | |
| 2-3 | 0 | 0 | 30K | 110K |
| 3-4 | 0 | 0 | 36K | 95K |
| 4-6 | 130K | 5.5M | 76K | 140K |
| 6-9 | 240K | 3.7M | 40K | 60K |
| 9-15 | 150K | 1.4M | 10K | 12K |
| 15-35 | 23K | 100K | 1K | 3K |
Latest filter bias/timing test and simulation request spreasheet
- EEMC simulation spreadsheet and timing tests
- Pythia/bfc filter bias
- Pythia tunes comparison agains data (CDF-Tune-A vs. Perugia0)
- Estimate of the contribution from lowerst partonic pt, pt<4GeV (see Fig. 6)
- L2-Endcap-gamma filter emulation study with single photon Monte-Carlo
- Bias tests with pi0 finder (last updated May 14, 2010)
- Combined Ru6/Run9 request
Note: These and all other studies are linked from here
Filter code in cvs
- Pythia gamma-filter code:
- BFC gamma-filter code:
StEemcGammaFilterMaker.cxx
StEemcGammaFilterMaker.h
eemcGammaFilterMakerParams.idl
Run 6 GMT timestamps
See this study for more details and plots
Request an equal fraction (10%) for each of the 10 timestamps below:
sdt20060516.152000 (GMT during run 7136022)
sdt20060518.073700 (GMT during run 7138010)
sdt20060520.142000 (GMT during run 7140024)
sdt20060521.052000 (GMT during run 7141011)
sdt20060522.124500 (GMT during run 7142029)
sdt20060523.204400 (GMT during run 7143044)
sdt20060525.114000 (GMT during run 7145023)
sdt20060526.114000 (GMT during run 7146020)
sdt20060528.144500 (GMT during run 7148028)
sdt20060602.071500 (GMT during run 7153015)
------------------------ REQUEST DETAILS BELOW ----------------------------------------
prompt photons and QCD simulations
2010.07.23 PyTune comparison with photon candidates: Perugia0 vs. Pro-PT0
Related posts
- Perugia0 and CDF-Tune-A comparison vs. Run6 data
- Michael's Perugia 0, Pro-pT0, and CDF Tune A comparison
- Thread at the phana list
Data samples and colour coding
- black Pythia QCD Monte-Carlo with Pro-Pt0 tune (pytune=329), partonic pt 9-15
- red Pythia QCD Monte-Carlo with Perugia0 tune (pytune=320), partonic pt 9-15
Event selection
Ran full Pythia+GSTAR simulation and require at least one
reconstucred EEMC photon candidate in the gamma Maker.
Figure 1:
Left: Reconstructed photon candidate transverse momentum (no normalization factor applied)
Right: ratio of Pro-Pt0/Perugia0 simulations (solid Line: "a+b*x" fit to ratio)
Event selections: require at least one reconstucred EEMC photon candidate
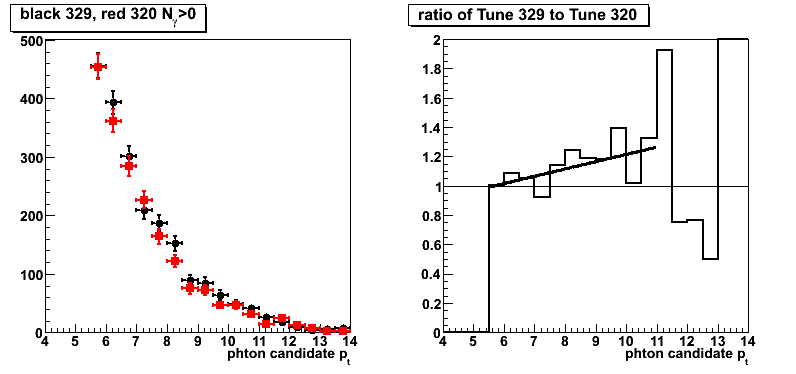
Figure 2:
Same as in Fig. 1 with different event selection criteria:
L2E-gamma, |v_z| < 120cm, at least one EEMC gamma candidate
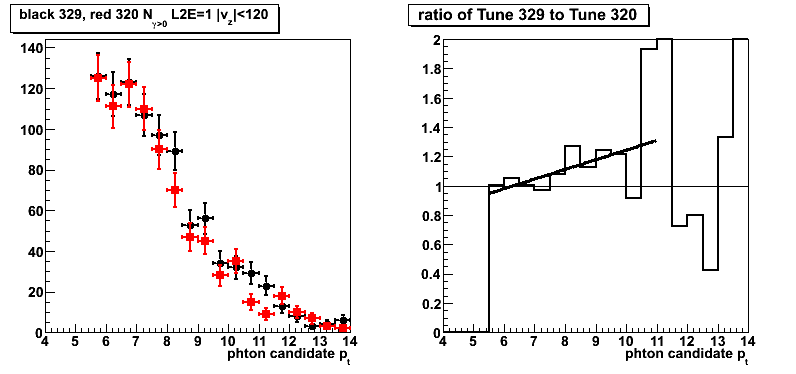
Pytune parameters comparison table
pytune(320) Perugia 0
P. Skands, Perugia MPI workshop October 2008
and T. Sjostrand & P. Skands, hep-ph/0408302
CR by M. Sandhoff & P. Skands, in hep-ph/0604120
LEP parameters tuned by Professor
pytune(329) Pro-pT0
See T. Sjostrand & P. Skands, hep-ph/0408302
and M. Sandhoff & P. Skands, in hep-ph/0604120
LEP/Tevatron parameters tuned by Professor
Red text indicates the parameter which are different between tunes
| Parameter | Perugia 0 | Pro-pT0 | Parameter description |
| MSTP(51) | 7 | 7 | PDF set |
| MSTP(52) | 1 | 1 | PDF set internal (=1) or pdflib (=2) |
| MSTP(64) | 3 | 2 | ISR alphaS type |
| PARP(64) | 1.0000 | 1.3000 | ISR renormalization scale prefactor |
| MSTP(67) | 2 | 2 | ISR coherence option for 1st emission |
| PARP(67) | 1.0000 | 4.0000 | ISR Q2max factor |
| MSTP(68) | 3 | 3 | ISR phase space choice & ME corrections (Note: MSTP(68) is not explicitly (re-)set by PYTUNE) |
| MSTP(70) | 2 | 2 | ISR IR regularization scheme |
| MSTP(72) | 1 | 0 | ISR scheme for FSR off ISR |
| PARP(71) | 2.0000 | 2.0000 | FSR Q2max factor for non-s-channel procs |
| PARJ(81) | 0.2570 | 0.2570 | FSR Lambda_QCD scale |
| PARJ(82) | 0.8000 | 0.8000 | FSR IR cutoff |
| MSTP(81) | 21 | 21 | UE model |
| PARP(82) | 2.0000 | 1.8500 | UE IR cutoff at reference ecm (Note: PARP(82) replaces PARP(62).) |
| PARP(89) | 1800.0000 | 1800.0000 | UE IR cutoff reference ecm |
| PARP(90) | 0.2600 | 0.2200 | UE IR cutoff ecm scaling power |
| MSTP(82) | 5 | 5 | UE hadron transverse mass distribution |
| PARP(83) | 1.7000 | 1.8000 | UE mass distribution parameter |
| MSTP(88) | 0 | 0 | BR composite scheme |
| MSTP(89) | 1 | 1 | BR colour scheme |
| PARP(79) | 2.0000 | 1.1800 | BR composite x enhancement |
| PARP(80) | 0.0500 | 0.0100 | BR breakup suppression |
| MSTP(91) | 1 | 1 | BR primordial kT distribution |
| PARP(91) | 2.0000 | 2.0000 | BR primordial kT width <|kT|> |
| PARP(93) | 10.0000 | 7.0000 | BR primordial kT UV cutoff |
| MSTP(95) | 6 | 6 | FSI colour (re-)connection model |
| PARP(78) | 0.3300 | 0.1700 | FSI colour reconnection strength |
| PARP(77) | 0.9000 | 0.0000 | FSI colour reco high-pT dampening streng |
| MSTJ(11) | 5 | 5 | HAD choice of fragmentation function(s) |
| PARJ(21) | 0.3130 | 0.3130 | HAD fragmentation pT |
| PARJ(41) | 0.4900 | 0.4900 | HAD string parameter a |
| PARJ(42) | 1.2000 | 1.2000 | HAD string parameter b |
| PARJ(46) | 1.0000 | 1.0000 | HAD Lund(=0)-Bowler(=1) rQ (rc) |
| PARJ(47) | 1.0000 | 1.0000 | HAD Lund(=0)-Bowler(=1) rb |
08 Aug
August 2010 posts
2010.08.09 PyTune comparison with gamma candidates from dijets: Perugia0 vs. Pro-PT0
Related posts
- Previous comparison for Perigia0 and Tune A
- PyTune comparison with photon candidates: Perugia0 vs. Pro-PT0
Tunes compared
- CDF Tune A
- Perugia0
- Pro-pT0
Event selection
- di-jets from the cone jet-finder algorithm
- photon and jet are opposite in phi:
cos (phi_gamma-phi_jet) < -0.8 - pt away side jet > 5GeV
- detector eta of the away side jet: |eta_jet_det| < 0.8
- data : L2e-gamma triggered events
- Monte-Carlo: emulated L2e-gamma triggered condition
- MC scaled to 3.164^pb based on Pythia luminosity (no fudge factors)
Figure 1a: Reconstructed photon candidate pt (L2e-gamma condition simulated in Monte-Carlo)
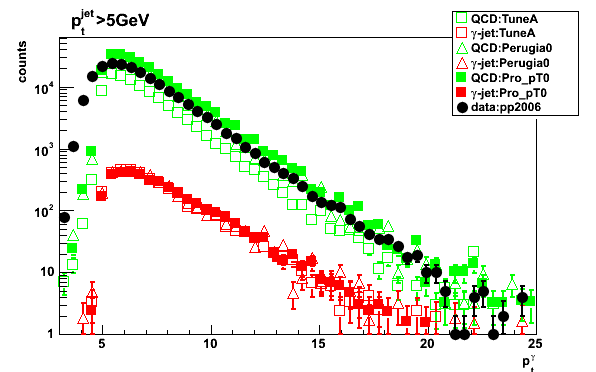
Figure 1b: Same as Fig. 1 on a linear scale and zoom into low pt
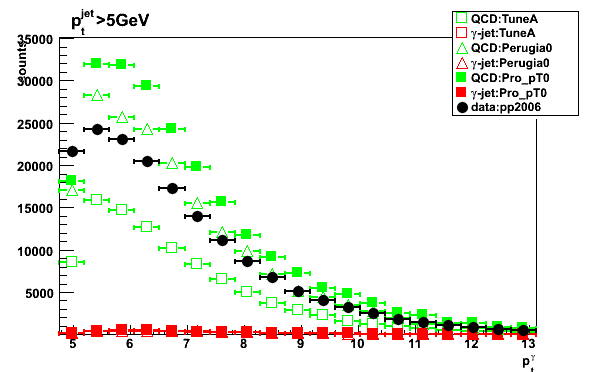
Figure 2: QCD Monte-Carlo yield to pp2006 data ratio
.png)
Figure 3: Prompt photon Monte-Carlo yield to pp2006 data ratio
.png)
Figure 4: Simulation yield vs. partonic pt (on a linear scale)
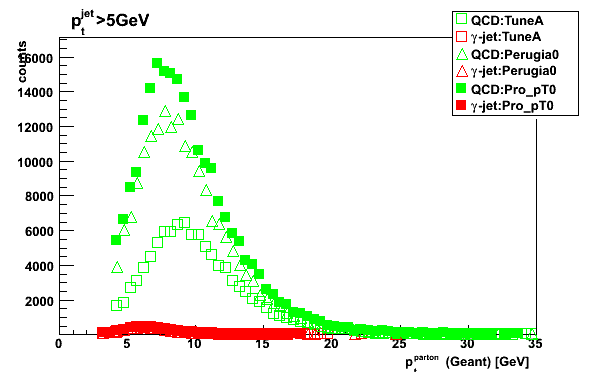
Figure 5: Simulation yield vs. partonic pt (log scale)
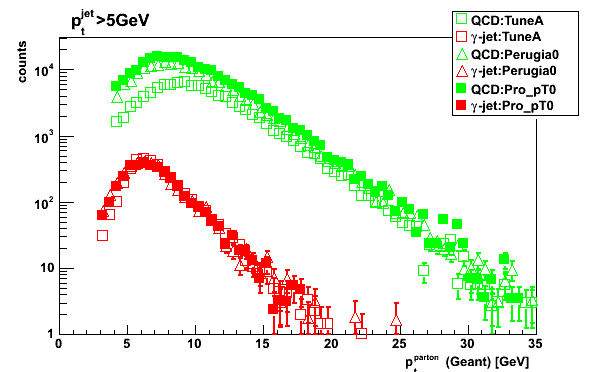
2010.08.10 Timestamps study for the simulation request
Summary for the gamma filtered simulation request
Generate Monte-Carlo events for
10 different timestamps and 10% of statistics each:
sdt20060516.152000 (GMT during run 7136022)
sdt20060518.073700 (GMT during run 7138010)
sdt20060520.142000 (GMT durign run 7140024)
sdt20060521.052000 (GMT during run 7141011)
sdt20060522.124500 (GMT during run 7142029)
sdt20060523.204400 (GMT during run 7143044)
sdt20060525.114000 (GMT during run 7145023)
sdt20060526.114000 (GMT during run 7146020)
sdt20060528.144500 (GMT during run 7148028)
sdt20060602.071500 (GMT during run 7153015)
Original list of timestamps
(from http://www.star.bnl.gov/HyperNews-star/protected/get/phana/481.html)
sdt20060512.043500 (GMT during run 7132005)
sdt20060513.064000 (GMT during run 7133011)
sdt20060514.090000 (GMT during run 7134015)
sdt20060516.152000 (GMT during run 7136022)
sdt20060518.073700 (GMT during run 7138010)
sdt20060520.142000 (GMT durign run 7140024)
sdt20060521.052000 (GMT during run 7141011)
sdt20060522.124500 (GMT during run 7142029)
sdt20060523.204400 (GMT during run 7143044)
sdt20060525.114000 (GMT during run 7145023)
sdt20060526.114000 (GMT during run 7146020)
sdt20060528.144500 (GMT during run 7148028)
sdt20060602.071500 (GMT during run 7153015)
sdt20060604.191200 (GMT during run 7155043)
Figure 1: Number of events from Run 6 golden runs
which fired L2e-gamma trigger (trigger id 137641 and 127641)
(using jet trees regenerated in new format by Wayne/Renee)
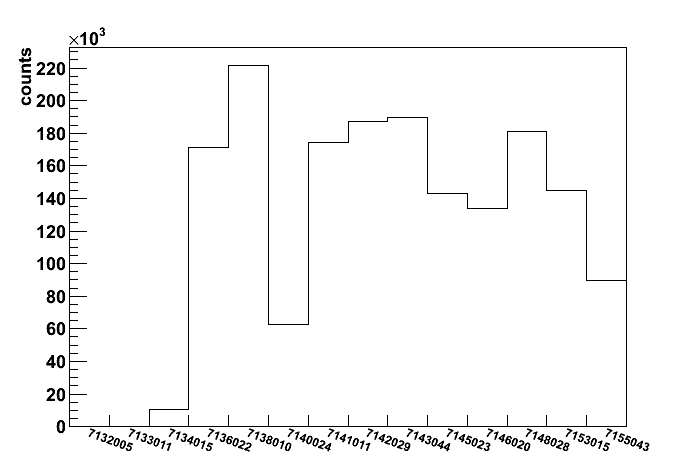
7132005: 0
7133011: 0
7134015: 10474
7136022: 171217
7138010: 221567
7140024: 62826
7141011: 174207
7142029: 187048
7143044: 189752
7145023: 142799
7146020: 133758
7148028: 181269
7153015: 145129
7155043: 89428
Figure 2: Fraction of events per time stamps

09 Sep
September 2010 posts
2010.09.08 First look at the official EEMC gamma filtered production
Related posts
- Tune comparison with private Monte-Carlo (Tune A vs. Perugia0 vs. Pro-pT0)
Event selection
- Official EEMC gamma filtered Monte-Carlo with Pro-pT0 tune
- di-jets from the cone jet-finder algorithm
- photon and jet are opposite in phi:
cos (phi_gamma-phi_jet) < -0.8 - pt away side jet > 5GeV
- detector eta of the away side jet: |eta_jet_det| < 0.8
- data : L2e-gamma triggered events
- Monte-Carlo: emulated L2e-gamma triggered condition
- MC scaled to 3.164^pb based on Pythia luminosity (no fudge factors)
Figure 1: Reconstructed photon candidate pt (L2e-gamma condition simulated in Monte-Carlo)

Figure 2: Partonic pt
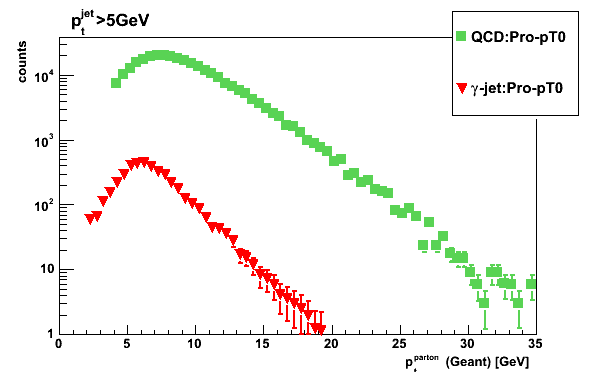
Figure 3: Thrown photon pt (from Geant record, prompt photon sample only)
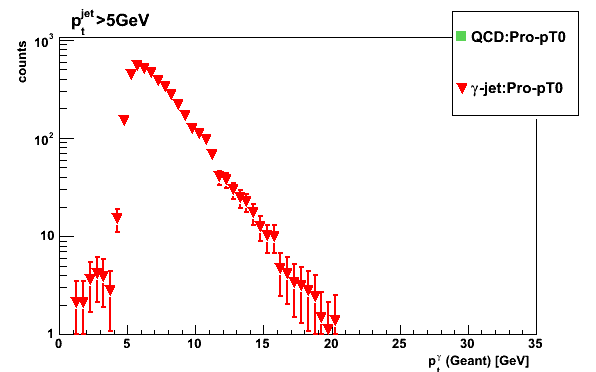
2010.09.10 Data to MC comparison with official EEMC gamma filtered production
Related posts
Event selection
- Official EEMC gamma filtered Monte-Carlo with Pro-pT0 tune
- di-jets from the cone jet-finder algorithm
- photon and jet are opposite in phi:
cos (phi_gamma-phi_jet) < -0.8 - pt away side jet > 5GeV
- detector eta of the away side jet: |eta_jet_det| < 0.8
- data : L2e-gamma triggered events
- Monte-Carlo: emulated L2e-gamma triggered condition
- QCD Monte-Carlo scaled to the yield in the data (MC down scaled by a factor of 1.8)
- All plots with gamma pt >7GeV cut
Figure 1: Reconstructed photon candidate pt
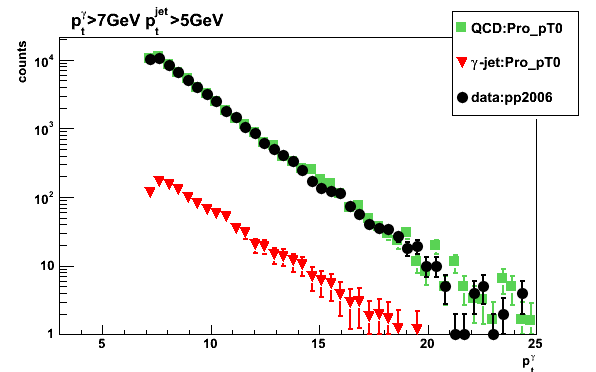
Figure 2: Reconstructed away side jet pt
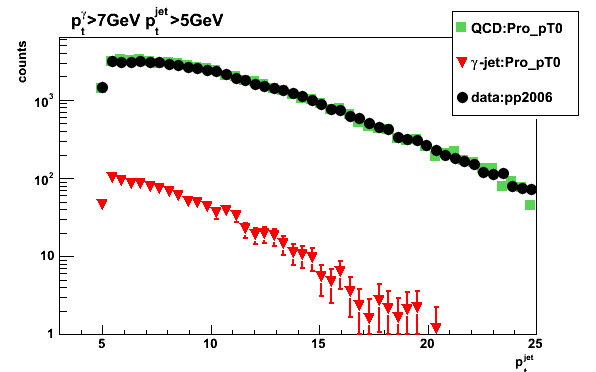
Figure 3: z vertex distribution

Figure 4: 3x3 tower cluster energy

Figure 5: 2x1 tower cluster energy
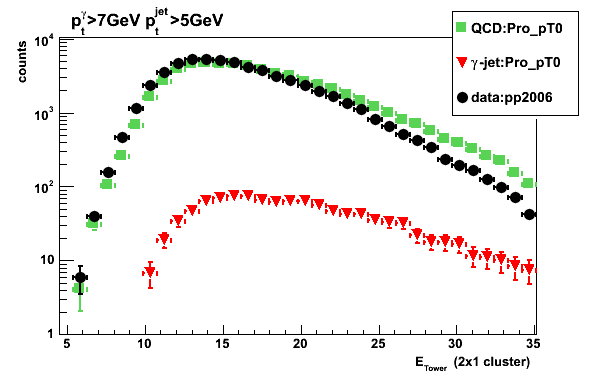
Figure 6: Reconstructed photon candidate (detector) rapidity
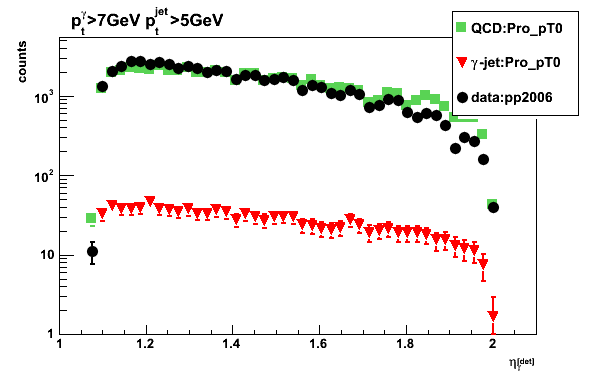
Figure 7: Reconstructed away side jet rapidity
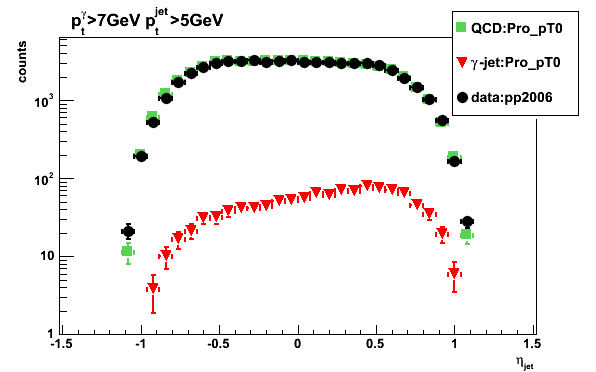
2010.09.13 Data vs. official filtered MC: cluster energy ratios
Related posts
- Previous data to MC comparison with official EEMC gamma filtered production
- Plots with old filtered Monte-Cerlo
Event selection
- Official EEMC gamma filtered Monte-Carlo with Pro-pT0 tune
- di-jets from the cone jet-finder algorithm
- photon and jet are opposite in phi:
cos (phi_gamma-phi_jet) < -0.8 - pt away side jet > 5GeV
- detector eta of the away side jet: |eta_jet_det| < 0.8
- data : L2e-gamma triggered events
- Monte-Carlo: emulated L2e-gamma triggered condition
- QCD Monte-Carlo scaled to the yield in the data (MC down scaled by a factor of 1.8)
- All plots with gamma pt >7GeV and jet pt >5GeV cuts
Figure 1: Cluster energy ratio: 2x1/2x2
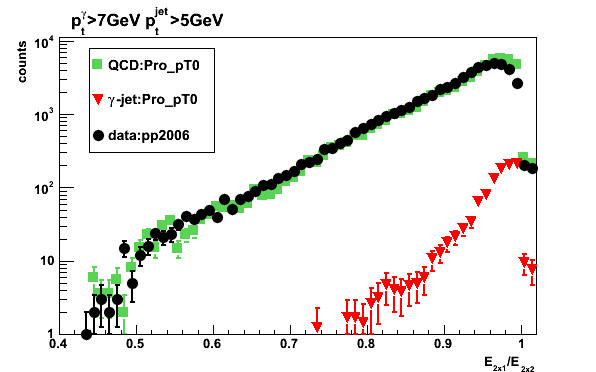
Figure 2: Cluster energy ratio: 2x1/3x3
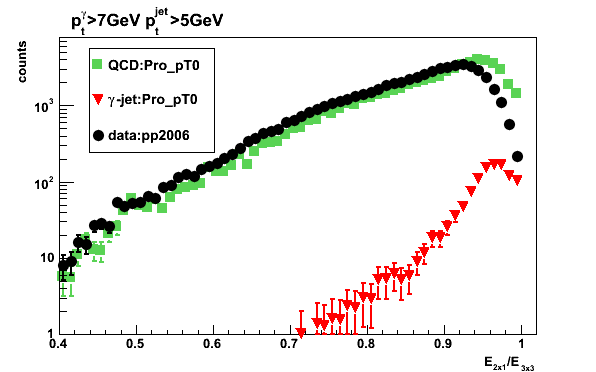
Figure 3: Cluster energy ratio: 2x2/3x3
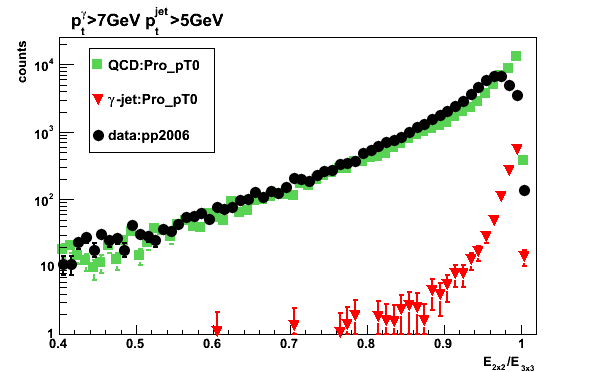
Figure 4: Cluster energy ratio: 2x1/E(R=0.7)
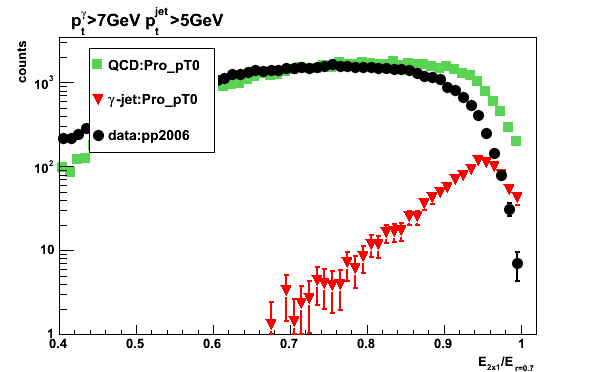
Figure 5: Cluster energy ratio: 2x2/E(R=0.7)
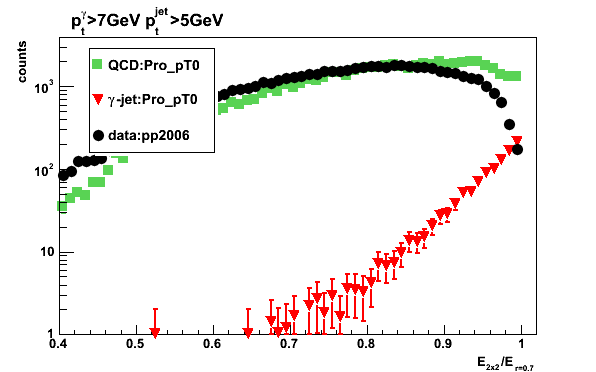
Figure 6: Cluster energy ratio: 3x3/E(R=0.7)
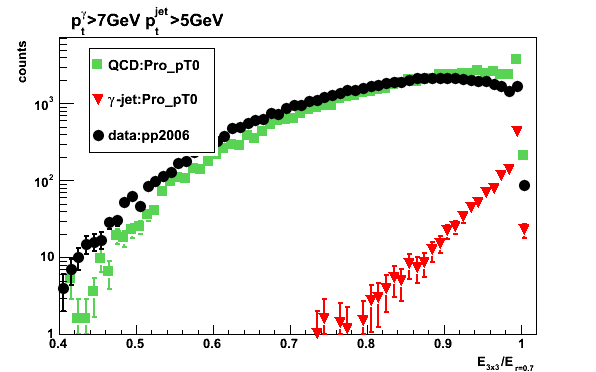
2010.09.15 Data vs. official filtered MC: energy deposition in various EEMC layers
Related posts
- Data vs. official filtered MC: cluster energy ratios
- Previous data to MC comparison with official EEMC gamma filtered production
- Plots with old filtered Monte-Cerlo
Event selection
- Official EEMC gamma filtered Monte-Carlo with Pro-pT0 tune
- di-jets from the cone jet-finder algorithm
- photon and jet are opposite in phi:
cos (phi_gamma-phi_jet) < -0.8 - pt away side jet > 5GeV
- detector eta of the away side jet: |eta_jet_det| < 0.8
- data : L2e-gamma triggered events
- Monte-Carlo: emulated L2e-gamma triggered condition
- QCD Monte-Carlo scaled to the yield in the data (MC down scaled by a factor of 1.8)
- All plots with gamma pt >7GeV and jet pt >5GeV cuts
Figure 1: 3x3 tower cluster energy

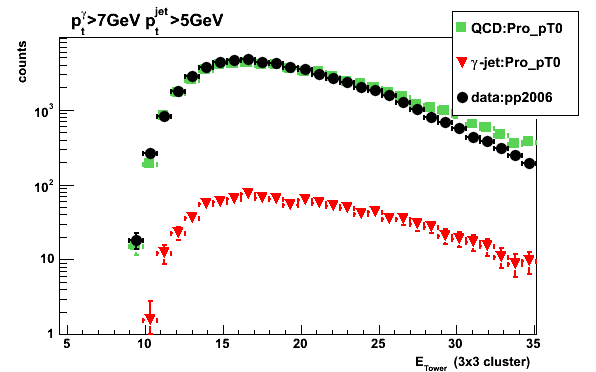
Figure 2: 25 central SMD u-strip energy
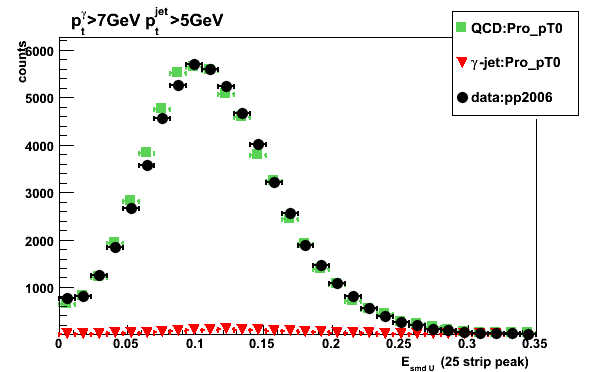
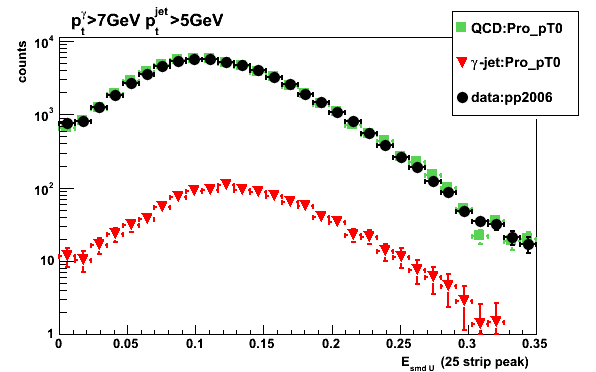
Figure 3: 3x3 pre-shower1 cluster energy

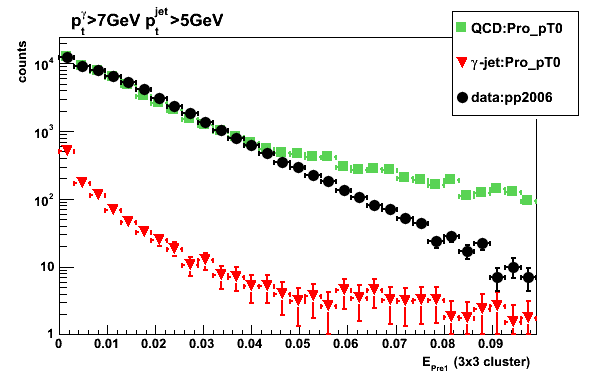
Figure 4: 3x3 pre-shower2 cluster energy
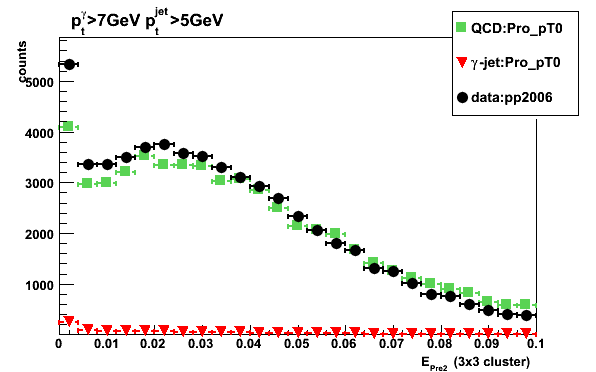
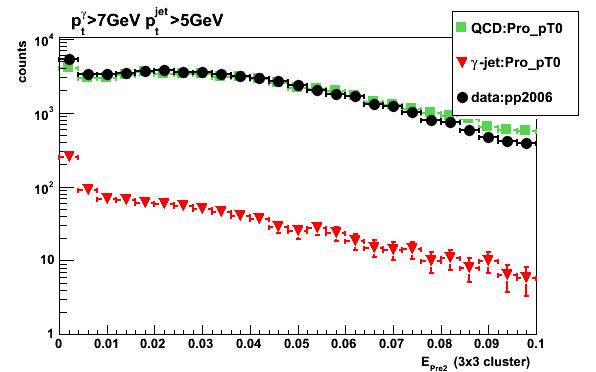
Figure 5: 3x3 post-shower cluster energy

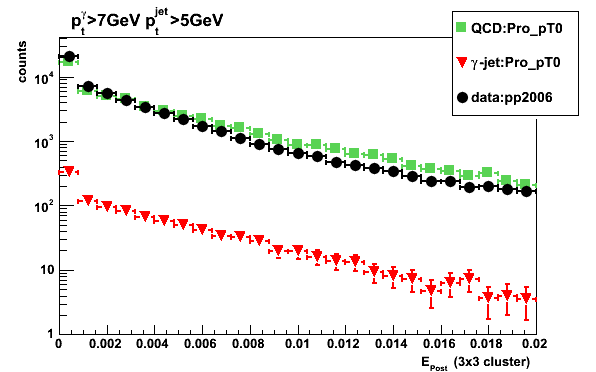
2010.09.23 Neutral energy jet shape comparison for various tunes
Related posts
Event selection
- Official EEMC gamma filtered Monte-Carlo with Pro-pT0 tune vs. Ilya's private production for Pro-pT0, Perugia0, and CDF Tune A
- di-jets from the cone jet-finder algorithm
- photon and jet are opposite in phi:
cos (phi_gamma-phi_jet) < -0.8 - pt away side jet > 5GeV
- detector eta of the away side jet: |eta_jet_det| < 0.8
- data : L2e-gamma triggered events
- Monte-Carlo: emulated L2e-gamma triggered condition
- QCD Monte-Carlo scaled to the yield in the data (All Monte-Carlo normalized to the total yield in the data)
- All plots with gamma pt >7GeV and jet pt >5GeV cuts
Figure 1: 3x3 tower cluster energy to jet R=0.7 energy ratio
Left: Official production (Pro-Pt0), Right: Pro-Pt0 (Ilya private production)
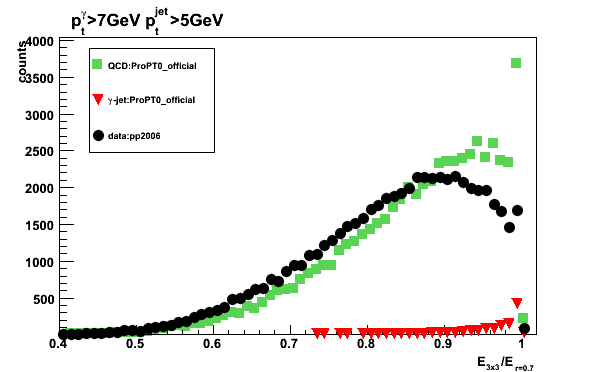
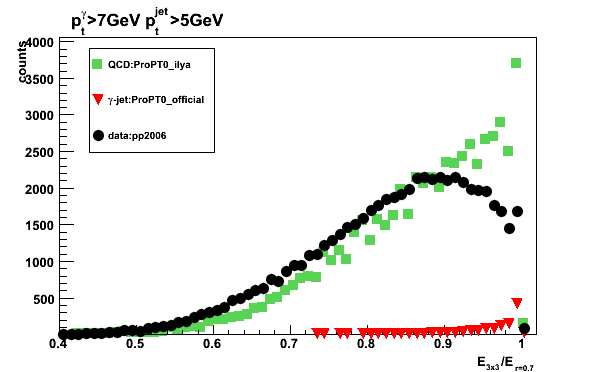
Figure 2: 3x3 tower cluster energy to jet R=0.7 energy ratio - Perugia0 (Ilya private production)

Figure 3: 3x3 tower cluster energy to jet R=0.7 energy ratio - CDF Tune A (Ilya private production)
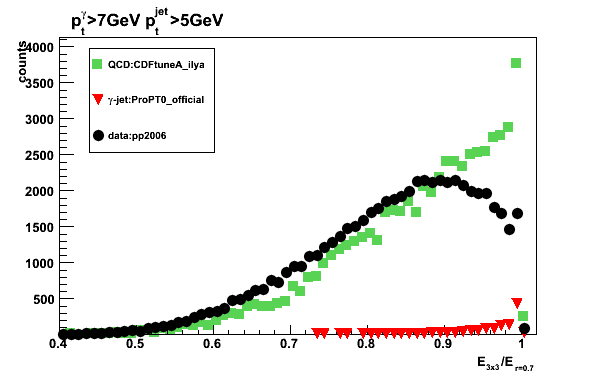
Figure 4: 3x3 tower cluster with jet thresholds energy to jet R=0.7 energy ratio - Official production (Pro-Pt0)
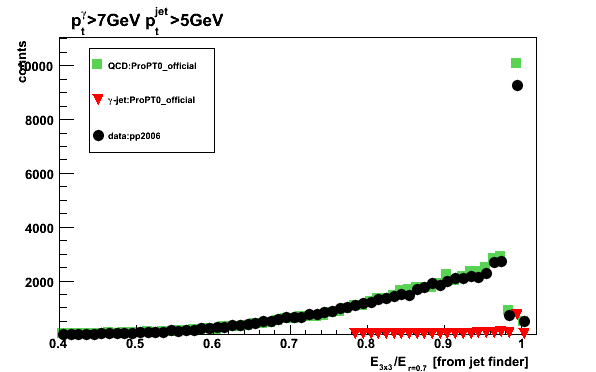
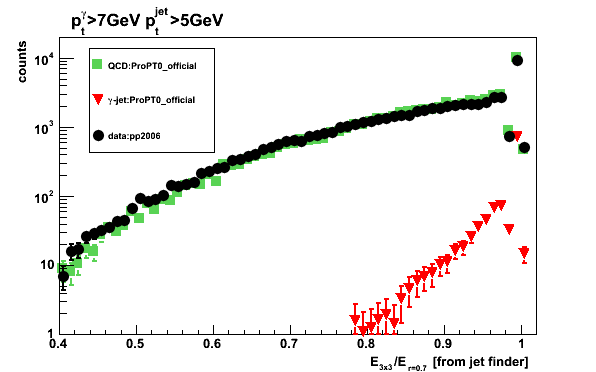
Calorimeter studies for the STAR W analysis
Ilya Selyuzhenkov for the STAR Collaboration
Analysis links
Year 2010
- January 2010
- 2010/01/26: Endcap/Barrel clustering with official W-MC
- 2010/01/18: W test sample: Cluster ratios and skewed gaussian fits
- 2010/01/15: W test sample QA: Pass 3
- 2010/01/13: W test sample QA: Pass 2
- 2010/01/12: W test sample QA
Year 2009
- December 2009
- 2009/12/01: BEMC 1x1, 2x1, 2x2, 3x3 clustering
- November 2009
- 2009/11/17: BEMC sampling fraction: energy dependence
- 2009/11/10: BEMC sampling fraction and clustering (y2009 geometry)
- 2009/11/03: BEMC sampling fraction: with and without LOW_EM option (y2006g geometry)
Documentation for the photon-jet reconstruction code
Documentation for the photon-jet reconstruction code (Ilya Selyuzhenkov)
-
StEemcGammaFilter maker is the Pythia level EEMC gamma filter
-
StEemcGammaFilterMaker maker is the BFC level Endcap gamma filter
-
STAR Jet finder code and the new (Pibero's) jet tree format description
-
StEemcDstMaker is the maker which copies the Eemc detector response and TPC tracks
from MuDst into the StEemcDstEvent tree -
StGammaJetMaker is the maker which reads jet, skim, and EemcDst trees simultaneously
and generates an StGammaJetEvent tree of gamma-jet candidate -
StGammaJetAna is the maker which runs the shower shape and sided residual analyses.
As result it generates the StGammaJetAnaEvent tree
(StGammaJetAnaEvent is an event container which stores the gamma-jet sided residual info) -
StGammaJetDraw is the maker which applies final analysis cuts and generates histograms
-
Signal to background optimization with multi-variant analysis:
macros to run TMVA analysis (LDA, neural network MLP, etc) -
Macros to run various makers
2009 Endcap geometry update (ecalgeo6.g)
2009/2010 GEANT geometry file update summary (ecalgeo v6.0):
Final updates (ecalgeo v6.2):
- Ecalgeo-v6.2: embedded LOW_EM cuts after TPC/EEMC overlap fix
- Ecalgeo-v6.2: embedded LOW_EM cuts in the calorimeter geometry
- Low EM timing study: 10KeV vs. 100KeV cut settings
- Low EM study: LOW_EM option, 100KeV cuts, and DCUTE=100KeV
See also:
- Endcap geometry description
- Endcap EMC project page (1998-2008 archives: MIT, IUCF)
Analysis flow chart
- Copy the StRoot directory from here (for example $my_dir)
- Change to the parent directory for StRoot:
cd $my_dir
- compile everything with cons
- To run makers (expect starsim and bfc) use macros from here and run:
root4star -b -q 'RunXXXMaker.C("inputFileName.extension.root")'
Note: You can use files from iucf disk
Anylysis flow chart:
starsim (Kumac) -> fzd.gz
bfc.C (fzd) -> MuDst.root / geant.root
JetFinder (MuDst) -> jet.root / skim.root
EEmcDstMaker (MuDst) -> eemc.root
GammaJetMaker (jet/skim) -> dijet.root
GammaJetAnaMaker (dijet/eemc) -> ana.root
GammaJetDrawMaker (ana) -> draw.root / mlp.root
EEMC related MuDst/jet/skim/gamma trees location
Main directory for Ilya's private directory files at RCF IUCF disk:
/star/institutions/iucf/IlyaSelyuzhenkov/gammaFilterMC
CDF Tune A simulations (private production)
fzd.gz, geant.root, and MuDst.root are in files/ subdirectory
logs (MuDst.log.gz, sim.log.gz) in logs/ subdirectory
Prompt photons (partonic pt range 3-25, single bin):
/star/institutions/iucf/IlyaSelyuzhenkov/gammaFilterMC/20100630/GammaJet_pt3_25_pytune100
QCD (partonic pt range 4-35, bins: 4-6, 6-9, 9-15, 15-35):
/star/institutions/iucf/IlyaSelyuzhenkov/gammaFilterMC/20100630/QCD_pt4_6_pytune100
/star/institutions/iucf/IlyaSelyuzhenkov/gammaFilterMC/20100630/QCD_pt6_9_pytune100
/star/institutions/iucf/IlyaSelyuzhenkov/gammaFilterMC/20100630/QCD_pt9_15_pytune100
/star/institutions/iucf/IlyaSelyuzhenkov/gammaFilterMC/20100630/QCD_pt15_35_pytune100
Perugia0 simulations (private production)
fzd.gz, geant.root, and MuDst.root are in files/ subdirectory
logs (MuDst.log.gz, sim.log.gz) in logs/ subdirectory
Prompt photons (partonic pt range 3-25, single bin):
/star/institutions/iucf/IlyaSelyuzhenkov/gammaFilterMC/20100630/GammaJet_pt3_25_pytune320
QCD (partonic pt range 4-35, bins: 4-6, 6-9, 9-15, 15-35):
/star/institutions/iucf/IlyaSelyuzhenkov/gammaFilterMC/20100630/QCD_pt15_35_pytune320
/star/institutions/iucf/IlyaSelyuzhenkov/gammaFilterMC/20100630/QCD_pt4_6_pytune320
/star/institutions/iucf/IlyaSelyuzhenkov/gammaFilterMC/20100630/QCD_pt6_9_pytune320_1
/star/institutions/iucf/IlyaSelyuzhenkov/gammaFilterMC/20100630/QCD_pt6_9_pytune320_2
/star/institutions/iucf/IlyaSelyuzhenkov/gammaFilterMC/20100630/QCD_pt9_15_pytune320
Pro-pT0 simulations (private production)
fzd.gz, geant.root, and MuDst.root are in files/ subdirectory
logs (MuDst.log.gz, sim.log.gz) in logs/ subdirectory
Prompt photons (partonic pt range 3-25, single bin):
/star/institutions/iucf/IlyaSelyuzhenkov/gammaFilterMC/20100727/GammaJet_pt3_25_pytune329
QCD (partonic pt range 4-35, bins: 4-6, 6-9, 9-15, 15-35):
/star/institutions/iucf/IlyaSelyuzhenkov/gammaFilterMC/20100727/QCD_pt4_6_pytune329
/star/institutions/iucf/IlyaSelyuzhenkov/gammaFilterMC/20100727/QCD_pt6_9_pytune329
/star/institutions/iucf/IlyaSelyuzhenkov/gammaFilterMC/20100727/QCD_pt9_15_pytune329
/star/institutions/iucf/IlyaSelyuzhenkov/gammaFilterMC/20100727/QCD_pt15_35_pytune329
Pro-pT0 (official production)
trees (ana, dijet, draw, eemc, gamma, geant, jet, mlp, MuDst, skim) are in:
/star/institutions/iucf/IlyaSelyuzhenkov/gammaFilterMC/official/pp200/pythia6_423/
logs for:
ana, dijet, draw, eemc, gamma, jet, mlp, skim:
/star/institutions/iucf/IlyaSelyuzhenkov/gammaFilterMC/official/prodlog/trees/
MuDst and geant:
/star/institutions/iucf/IlyaSelyuzhenkov/gammaFilterMC/official/prodlog/P10ii/log/trs/
Prompt photons (partonic pt range 2-35, bins: 2-3, 3-4, 4-6, 6-9, 9-15, 15-35):
/star/institutions/iucf/IlyaSelyuzhenkov/gammaFilterMC/official/pp200/pythia6_423/pt_2-3gev/eemcgammafilt100_gamma
/star/institutions/iucf/IlyaSelyuzhenkov/gammaFilterMC/official/pp200/pythia6_423/pt_3-4gev/eemcgammafilt100_gamma
/star/institutions/iucf/IlyaSelyuzhenkov/gammaFilterMC/official/pp200/pythia6_423/pt_4-6gev/eemcgammafilt100_gamma
/star/institutions/iucf/IlyaSelyuzhenkov/gammaFilterMC/official/pp200/pythia6_423/pt_6-9gev/eemcgammafilt100_gamma
/star/institutions/iucf/IlyaSelyuzhenkov/gammaFilterMC/official/pp200/pythia6_423/pt_9-15gev/eemcgammafilt100_gamma
/star/institutions/iucf/IlyaSelyuzhenkov/gammaFilterMC/official/pp200/pythia6_423/pt_15-35gev/eemcgammafilt100_gamma
QCD (partonic pt range 4-35, bins: 4-6, 6-9, 9-15, 15-35):
/star/institutions/iucf/IlyaSelyuzhenkov/gammaFilterMC/official/pp200/pythia6_423/pt_4-6gev/eemcgammafilt100_qcd
/star/institutions/iucf/IlyaSelyuzhenkov/gammaFilterMC/official/pp200/pythia6_423/pt_6-9gev/eemcgammafilt100_qcd
/star/institutions/iucf/IlyaSelyuzhenkov/gammaFilterMC/official/pp200/pythia6_423/pt_9-15gev/eemcgammafilt100_qcd
/star/institutions/iucf/IlyaSelyuzhenkov/gammaFilterMC/official/pp200/pythia6_423/pt_15-35gev/eemcgammafilt100_qcd
Run 6 Jet/skim trees
/star/institutions/iucf/IlyaSelyuzhenkov/jetTrees/2006/ppProductionLong/
Run 6 gamma trees
/star/institutions/anl/Run6GammaTrees/log/
/star/institutions/anl/Run6GammaTrees/root/
Kumac file examples
Examples of different kumac files:
- Single particle Monte-Carlo:
Combine singleParticle_begin.kumac with singleParticle_end.kumac
using needed geometry tag (example: detp geom y2006h)
- Prompt photon Pythia Monte-Carlo testGammaJet.kumac
MSUB (14)=1
MSUB (18)=1
MSUB (29)=1
MSUB (114)=1
MSUB (115)=1
- QCD 2->2 processes testQCD.kumac
MSUB (11) = 1
MSUB (12) = 1
MSUB (13) = 1
MSUB (28) = 1
MSUB (53) = 1
MSUB (68) = 1
L2Egamma trigger emulator howto
Running Run 6 L2 gamma trigger emulator
TObjArray* HList=new TObjArray;
StTriggerSimuMaker *simuTrig = new StTriggerSimuMaker("StarTrigSimu");
simuTrig->setHList(HList);
simuTrig->setMC(true); // must be before individual detectors, to be passed
simuTrig->useBbc();
simuTrig->useBemc();
simuTrig->useEemc(0);
simuTrig->bemc->setConfig(StBemcTriggerSimu::kOffline);
StGenericL2Emulator* simL2Mk = new StL2_2006EmulatorMaker;
assert(simL2Mk);
simL2Mk->setSetupPath("/afs/rhic.bnl.gov/star/users/kocolosk/public/StarTrigSimuSetup/");
simL2Mk->setOutPath("/star/institutions/iucf/IlyaSelyuzhenkov/data/MCFilter/StGenericL2Emulator_log/");
simuTrig->useL2(simL2Mk);
Macros to run TMVA analysis over the EEMC photon-jet events
Macros to run various makers
macros to run various makers for the gamma-jet analysis:
- DrawAllPtPionCuts.C
- DrawHistFromRootFile.C
- DrawHistRatios.C
- DrawImagesForHistsInFile.C
- DrawLoopHist.C
- DrawMCtoDataRatios.C
- DrawTuneComparison.C
- DrawscaleGammaJetBGsimu.C
- compareShowerShapesWithPibero.C
- getchain.C
- ComparePyTunes.C
- ComparePyTunesXsection.C
- DrawTimingPlots.C
- drawAll.C
- draw_candidatePt_vsFilter.C
- draw_filterQA_plots.C
- draw_reject_plots.C
Macros to run various makers:
Run 6 and Run 9 bfc chain examples
Run 9 bfc options with EEMC slow and fast simulators (EEfs EEss):
"trs,fss,Idst,IAna,l0,tpcI,fcf,ftpc,Tree,logger,ITTF,Sti,MakeEvent,McEvent,
geant,evout,IdTruth,tags,bbcSim,tofsim,emcY2,EEfs,EEss,
GeantOut,big,-dstout,fzin,-MiniMcMk,beamLine,clearmem,eemcDB,VFPPVnoCTB"
Run 6 bfc options with EEMC slow and fast simulators (EEfs EEss):
"trs fss y2006h Idst IAna l0 tpcI fcf ftpc Tree logger
ITTF Sti VFPPV bbcSim tofsim tags emcY2 EEfs EEss evout
-dstout IdTruth geantout big fzin MiniMcMk clearmem eemcDb beamLine sdt20060523"
Run 6 bfc options with EEMC gamma filter in the chain (FiltEemcGamma):
"FiltEemcGamma trs fss y2006h Idst IAna l0 tpcI fcf ftpc Tree logger
ITTF Sti VFPPV bbcSim tofsim tags emcY2 EEfs EEss evout
-dstout IdTruth geantout big fzin MiniMcMk clearmem eemcDb beamLine sdt20060523"
Note:
need to use a special macro RunEemcGammaFilterBfc.C
to run FiltEemcGamma with bfc
Scheduler xml template file examples
Official scheduler documentation
Schedule template file examples:
- Schedule-template_FullChain.xml -
advanced template to submit jobs for all (or selected) makers in one job (run over private Monte-Carlo files) - Schedule-template_FullChain_official.xml -
advanced template to submit jobs for all (or selected) makers in one job (for official Monte-Carlo) - Schedule-template_GammaJetDraw.xml - submit jobs for RunGammaJetDrawMC.C for private Monte-Carlo
- Schedule-template_GammaJetDraw_official.xml - submit jobs for RunGammaJetDrawMC.C for private Monte-Carlo
- Schedule-template_candidate.xml - submit jobs for RunGammaMaker.C / RunCreateFilterTree.C
Catalog request to get official Gamma filtered Monte-Carlo files:
get_file_list.pl -distinct -keys 'path,filename' -cond 'production=P10ii,path~pt_4-6gev/eemcgammafilt100_qcd/y2006h,filetype=MC_reco_MuDst,storage=nfs'
or
get_file_list.pl -distinct -keys 'path,filename' -cond 'production=P10ii,runnumber=2000010060,filetype=MC_reco_MuDst,storage=nfs
where run number = 2000000000 + 10060
StEemcDstMaker (Emc dst event container - similar to the gamma maker code structure)
StEemcDstMaker is Eemc dst event container (similar to the gamma maker code structure).
Creates root tree from MuDst which stores the relevant information
for the photon-jet analysis
- StEemcDstEventMaker.h / StEemcDstEventMaker.cxx - gets pointer to the MuDst information
- StEemcDstMaker.h / StEemcDstMaker.cxx - init EemcDstRawMaker
- StEemcDstRawMaker.h / StEemcDstRawMaker.cxx - copy the information from MuDst with GetEndcap() and GetTracks() methods
- StEemcDstStrip.h / StEemcDstStrip.cxx - container for the EEMC SMD strip
- StEemcDstTower.h / StEemcDstTower.cxx - container for the EEMC tower and pre/post shower layers
- StEemcDstTrack.h / StEemcDstTrack.cxx - container for the TPC track
- StGeantRecord.h / StGeantRecord.cxx - copy the relevant GEANT/Pythia information from geant.root
- StGeantRecordMaker.h / StGeantRecordMaker.cxx - TBD
StEemcGammaFilter (Pythia level EEMC gamma filter)
StEemcGammaFilter is the Pythia level EEMC gamma filter.
The code is available at STAR/cvs: StEemcGammaFilter.h / StEemcGammaFilter.cxx
Basic algo description:
- Loop over particles and search for the ones with energy higher than threshold and falls into the fiducial (in rapidity) volume
- Search for clusters around each seed include tracks in eta and phi (detector Eta and Phi) space within the cone radious
Algo parameters:
mConeRadius - eta-phi cluster cone radius
mSeedThreshold - seed track threshold
mClusterThreshold - track cluster threshold
mEtaLow - lowerst rapidity cut
mEtaHigh - highest rapidity cut
mMaxVertex - vertex cut
Other parameters:
mCalDepth - calorimeter depth at which tracks are extrapolated
mMinPartEnergy - minimum particle energyto be included in the cluster
mHadronScale - down scale factor for hadrons (be careful when playing with this) No scaling by default
mFilterMode - filter mode: 0 - test mode (no event rejection), 1 - filter reject events
mPrintLevel - print level (0 - no output, 1 or 2 print some logs)
StEemcGammaFilterMaker (BFC level Endcap gamma filter)
StEemcGammaFilterMaker big full chain (BFC) Endcap gamma filter
Code is accessible in CVS/STRoot: StEemcGammaFilterMaker.h / StEemcGammaFilterMaker.cxx
Parameter can be stored in the data base (see eemcGammaFilterMakerParams.idl file),
but this is not enabled in the current implementation.
Basic idea of StEemcGammaFilterMaker algo:
- Search for the 3x3 tower cluster with high tower and cluster Et above thresholds
Available parameters to vary:
Seed energy threshold (mSeedEnergyThreshold, GeV)
Cluster eT threshold (mClusterEtThreshold GeV)
Maximum z vertex (mMaxVertex, cm)
Macro to run StEemcGammaFilterMaker with BFC
(fixes the problem of loading StJetSkimEvent library):
StGammaJetAna (maker which does the shower shape analysis)
StGammaJetAna is the main maker which actually do the shower shape analysis.
StGammaJetAna.h / StGammaJetAna.cxx
StRoot/StGammaJetAna/StGammaJetAna:
- CheckNeighbors.h - short method to get the adjacent towers
- Cluster.h -
- Constants.h - parameters
- CreateHistLists.h -
- Cuts.h
- FillAnaTree.h
- FillHists.h
- FindMaxEnergySector.h
- FindSmdCluster.h - redundant
- FindSmdGammaCluster.h
- FitSMDstripsGaus.h - redundant
- FitSMDstripsSidedResidual.h
- GetEemcEnergiesForMaxTower.h
- GetPolarization.h
- Init.h
- Make.h
- SetPreshowerBin.h
- getNextEemcTowerId.h
StGammaJetAnaEvent (event container which stores the gamma-jet sided residual info)
StGammaJetAnaEvent is an event container which stores the information
on gamma-jet candidates, output from shower shape fits and sided residual analysis
Also it has an information from the crude pi0 (multi-photon event) finder
- StEemcSector.h / StEemcSector.cxx
- StGammaJetAnaEvent.h / StGammaJetAnaEvent.cxx
- StGammaJetGamma.h / StGammaJetGamma.cxx
- StGammaJetPion.h / StGammaJetPion.cxx
StGammaJetDraw (applying analsyis cutsand generate histograms)
StGammaJetDraw - applying analsyis cuts
(such as photon isolation, photon and jet pt cuts, etc)
and generate pre-shower sorted histograms
StRoot/StGammaJetDraw/StGammaJetDraw:
- Constants.h
- Constants_1Dhists.h
- Constants_1Dhists_Geant.h
- Constants_1Dprofiles.h
- Constants_2Dhists.h
- Constants_2Dhists_Geant.h
- Constants_2Dprofiles.h
- Constants_partonicPtBins.h
- FillCandidateTxtFile.h - dumps gamma-jet info in txt file in format request by Hal Spinka
- GetJetDetEta.h - short code calculates jet detector rapidity
- GetPolarization.h
- Init.h
- Make.h
- ReadSpinInfo.h
- SetDrawOptions.h
- SetPartonicWeight.h - sets partonic pt weigts for Monte-Carlo
- createResidualHists.h
- drawEemc.h
- drawResidual.h - applying analysis cuts and fill histograms
StGammaJetEvent (simple container for the gamma-jet events)
StGammaJetEvent - container for the gamma-jet candidate events
(stores the information on selected di-jets from the jet finder and Eemdc Dst trees).
- StEmcJet.h / StEmcJet.cxx
- StEmcJetTower.h / StEmcJetTower.cxx
- StGammaJetEvent.h / StGammaJetEvent.cxx
- diJetTreeConstants.h
StGammaJetMaker (read jet, skim, and EemcDst trees and generate gamma-jet tree)
StGammaJetMaker read jet, skim, and EemcDst trees and select/write gamma-jet tree.
- StGammaJetMaker.h / StGammaJetMaker.cxx
- StRoot/StGammaJetMaker/StGammaJetMaker subdirectory has:
CheckNeighbors.h - simple code to check if the towers are adjacent
Constants.h - list of constant used by the StGammaJetMaker
getNextEemcTowerId.h - get the id of the adjacent tower
Make.h - pice of code which reads the trees and fills the EemcDst event
Photon-jets
Ilya Selyuzhenkov for the STAR Collaboration
Photon-jet reconstruction software documentation
Analysis links
Year 2010
- September 2010
- 2010/09/23: Neutral energy jet shape comparison for various tunes
- 2010/09/15: Data vs. official filtered MC: energy deposition in various EEMC layers
- 2010/09/13: Data vs. official gamma filtered Monte-Carlo: cluster energy ratios
- 2010/09/10: Data to MC comparison with official EEMC gamma filtered production
- 2010/09/08: First look at the official EEMC gamma filtered production
- August 2010
- July 2010
- 2010/07/23: PyTune comparison with photon candidates: Perugia0 vs. Pro-PT0
- 2010/07/22: Run 6 EEMC gamma-filtered simulation request
- 2010/07/20: Updated EEMC simulation spreadsheet: prompt photons and QCD
- 2010/07/16: Pythia/BFC gamma-filter bias tests with realistic gain variation
- 2010/07/14: Pythia/BFC gamma-filter bias tests (vs. gamma pt, eta, energy, and phi)
- 2010/07/09: Table of L0-BBC, L0-EEMC, and L2Egamma triggers biases
- 2010/07/02: Tests of L2e-gamma trigger emulation with full Pythia+Geant Monte-Carlo
- June 2010
- 2010/06/30: Py-tunes (GEANT+L2e-gamma trigger) vs. Run 6 data
- 2010/06/28: Tests of L2e-gamma trigger emulation with single photon Monte-Carlo
- 2010/06/18: L2e-gamma trigger effect: Py-CDF-Tune-A, Py-Perugia0, and pp2006 data comparison
- 2010/06/17: Pythia TuneA/Perugia0 filtered MC vs. pp2006 data
- 2010/06/15: First look at data vs. TuneA/Perugia0 filtered MC
- May 2010
- 2010/05/28: Photon-jet candidates - Perugia vs. Tune A
- 2010/05/27: Run 6 and Run 9 jet Tree production: details specific to the photon-jet analysis
- 2010/05/13: Pythia filter QA after fixed "Eta -> -Eta" bug
- 2010/05/05: Starsim/bfc timing tests
- 2010/05/03: EEMC simulation spreadsheet: prompt photons and QCD
- 2010/05/03: Pythia/BFC filter biases vs. gamma candidate pt (with fixed gamma-maker)
- April 2010
- 2010/04/30: BFC and Pythia biases after gamma-maker 3x3 cluser fix has been updated
- 2010/04/17: Pythia/BFC gamma-filter accaptance vs. gamma candidate pt, energy, and eta
- 2010/04/17: BFC and Pythia QA: 10% gain shift: lowered thresholds
- 2010/04/09: BFC and Pythia Filter QA: +10% gain shift (after filter code peer review)
- March 2010
- 2010/03/02: Photon-jet simulation request (draft)
- February 2010
- 2010/02/16: Pythia and BFC filter QA vs. gamma candidate pt and eta
- 2010/02/12: Final Pythia and BFC EEMC-gamma-filter paramter settings
- 2010/02/11: BFC and Pythia Filter QA: +5% gain shift (no spread, mean=1.05)
- 2010/02/11: BFC and Pythia Filter QA: Gain study with "-5%" shift (mean=0.95, spread=0.05)
- 2010/02/09: BFC and Pythia gamma filters: accept/reject rates relative to triggered events
- 2010/02/08: Eemc-Gamma-Filter QA: QCD vs. gamma-jet ccept/reject rates
- January 2010
Year 2009
- December 2009
- 2009/12/20: Ecalgeo-v6.2: embedded LOW_EM cuts after TPC/EEMC overlap fix
- 2009/12/17: Ecalgeo-v6.2: embedded LOW_EM cuts in the calorimeter geometry
- 2009/12/08: Low EM timing study: 10KeV vs. 100KeV cut settings
- 2009/12/07: Low EM study: LOW_EM option, 100KeV cuts, and DCUTE=100KeV
- 2009/12/03: Photon-jet simulation request
- November 2009
- 2009/11/23: New EEMC geometry (CVS v6.1): y2006 vs. y2009 STAR configurations
- 2009/11/19: LOW_EM and EEMC time/event in starsim
- 2009/11/16: Tests of EEMC geometry, version 6.1: lead vs. mixture
- 2009/11/11: Tests of EEMC geometry, version 6.1
- 2009/11/06: new EEMC geometry: Pure lead and new SMD layers
- 2009/11/03: Jason EEMC geometry: Effect of ELED block change
- 2009/11/02: Jason EEMC geometry: results with and without LOW_EM options
- October 2009
- 2009/10/30: Jason EEMC geometry: Jason with ELED block from CVS file
- 2009/10/27: Jason EEMC geometry: comparison without LOW_EM option
- 2009/10/27: Jason EEMC geometry: effect of removing new SMD layers
- 2009/10/26: Jason vs. CVS EEMC: removed SMD layers
- 2009/10/20: Sampling fraction problem: full STAR vs. EEMC stand alone geometry
- 2009/10/16: Jason geometry file: Full STAR simulations (sampling fraction, shower shapes)
- 2009/10/13: Jason geometry tests: SMD energy, number of strip vs. thrown photon position
- 2009/10/12: Effect of added layers in Jason geometry file
- 2009/10/05: Volume id fix in Jason geometry file
- 2009/10/02: Jason vs. CVS EEMC geometry: sampling fraction and shower shapes
- September 2009
- August 2009
- 2009/08/27: Single particle MC with corrected geometry vs. eta-meson from data
- 2009/08/25: Corrected EEMC geometry: shower shapes
- 2009/08/24: Corrected EEMC geometry (bug 1618)
- 2009/08/17: Plan for extracting photon-jet cross section from pp@200GeV data
- July 2009
- 2009/07/20: EEMC tower response in Monte-Carlo (pt_reco vs. pt_true)
- June 2009
- 2009/06/22: CIPANP 2009 proceedings on "photon-jet coincidence measurements"
- May 2009
- 2009/05/31: CIPANP 2009 presentation on "photon-jet coincidence measurements"
- 2009/05/12: Various distributions after LDA cut at 70% efficiency (LDA Set1 vs. Set2 for various pre-shower bins)
- 2009/05/07: Photon-jets analysis with the Endcap Calorimeter (analysis status update for Spin PWG)
- 2009/05/06: Applying purity or efficiency driven cuts on LDA discriminant
- 2009/05/04: LDA: added more SMD info, 3x3 tower energy, correlation matrix
- 2009/05/03: Varying pt, eta cuts with LDA (LDA includes SMD, r2x1, r2x2, post-shower)
- April 2009
- 2009/04/28: LDA plus SMD analysis with pre-shower sorting
- 2009/04/22: Combining LDA with shower shape analysis
- 2009/04/17: The STAR spin program with long. polarized proton beams (seminar at Wayne State U.)
- March 2009
- 2009/03/26: Photon-jets with the STAR Endcap Calorimeter (STAR Collaboration Meeting at BNL)
- 2009/03/09: Application of the LDA and MLP classifiers for the cut optimization
- 2009/03/02: Neural network application for the cut optimization (zero try)
- February 2009
- 2009/02/19: Photon-jets from the Endcap Calorimeter (Analysis status update for Spin PWG)
- 2009/02/16: pp2006, pp2008, and mc2006: pt_jet>5GeV; pre-shower sorting
- 2009/02/12: CIPANP 2009 abstract
- 2009/02/09: pp2006, pp2008, and mc2006 comparison
- 2009/02/06: Pre-shower energy: Run6 vs. Run8 geometry
- 2009/02/03: Data to Monte-Carlo matching: pt_jet>7GeV vs. no pt_jet cut
- 2009/02/02: Data to Monte-Carlo matching: fudge factor 1.24 (no pt_jet cuts, no pre-shower cuts)
- January 2009
- 2009/01/27: Away side jet and partonic pt contributions (fiducial cuts: |eta_jet| < 0.7, pre1<10MeV)
- 2009/01/27: Away side jet and partonic pt contributions: pt_jet>7GeV (detector |eta_jet| < 0.8)
- 2009/01/20: Data to Monte-Carlo normalization (pt and vertex z distributions, no isolation cuts)
- 2009/01/08: Away side jet pt vs. photon pt (no isolation cuts)
Year 2008
- December 2008
- 2008/12/19: Parton pt distribution: QCD vs. gamma-jet events (more QCD statistics from Michael)
- 2008/12/16: Effect of L2gamma trigger in simulations
- 2008/12/11: ppProduction2008 QA (presentation for Spin PWG)
- 2008/12/08: pp2008 data QA (x vs. y photon position, pre1:sector 10 problem, vertex z for pp06/pp08 data)
- November 2008
- 2008/11/25: Yields vs. analysis cuts: eta dependence
- 2008/11/21: Cluster Isolation cut from 2x1, 2x2, and 3x3 patch: rapidity dependence
- 2008/11/18: Isolation cut for 2x1, 2x2 and 3x3 tower clusters
- 2008/11/11: Yields vs. analysis cuts (event counter, data/MC ratio)
- 2008/11/06: Gamma-jet reconstruction with the Endcap EMC (Analysis status update for Spin PWG)
- October 2008
- 2008/10/30: SMD energy and shower shapes for various cuts: pt>8.5, Esmd>0.1, 8 vs. 12 strips replaced
- 2008/10/27: SMD-based shower shape scaling (25 strips cluster energy, raw vs. data-driven MC)
- 2008/10/21: Shower shapes, 5/25 strips cluster energy, raw vs. data-driven MC (with new filtered events)
- 2008/10/15: Purity/efficiency/rejection: R_cluster > 0.9 vs. 0.98 (update with gamma-filtered events)
- 2008/10/15: Gamma-jets from Michael's filtered events vs. old MC gamma-jet and QCD jets events
- 2008/10/14: Purity/efficiency/rejection: R_cluster > 0.98
- 2008/10/13: Jet and skim trees for Michael's gamma filtered events
- September 2008
- 2008/09/30: Sided residual: purity, efficiency, and background rejection
- 2008/09/23: Right-left SMD tail asymmetries
- 2008/09/23: Sided residual plot study
- 2008/09/23: QA plots for maximum sided residual (bug fixed update)
- 2008/09/16: QA plots for maximum sided residual (obsolete)
- 2008/09/09: Maximum sided residual from shower shapes sorted by uv- and pre-shower bins
- 2008/09/02: Shower shape's triple Gaussian fits
- August 2008
- 2008/08/27: Gamma-jet candidates detector position for different pre-shower conditions
- 2008/08/26: Shower shapes: more constrains for pre1>4E-3 bin (2D and projections for sided residual, pre1<10MeV cut)
- 2008/08/25: Di-jets QA from pp2008 vs. pp2006 data
- 2008/08/19: Shower shape from pp2008 vs pp2006 data
- 2008/08/14: Shower shape with bug fixed dd-library (raw shapes, pre1=4MeV cut, u/v shapes within 12 and 40 strips from peak)
- July 2008
- 2008/07/29: Shower shape comparison with new dd-library (pre1=4MeV cut, u/v shapes within 12 and 40 strips from peak)
- 2008/07/22: Photons from eta-meson: library QA (shower shapes [pre1=4E-3 cut], energy plots, etc)
- 2008/07/16: Gamma-gamma invariant mass cut study (inv mass, pt, shower shapes plots)
- 2008/07/07: Pre-shower1 < 5MeV cut study (shower shapes, pre1:pre2, pre1, pt, sided residual plots)
- June 2008
- 2008/06/18: Photon-jet reconstruction with the EEMC detector (Davis Collaboration Meeting)
- 2008/06/10: Longitudinal double spin asymmetry for gamma-jet candidates
- 2008/06/09: STAR White paper plots (pt distribution: R_cluster 0.99 and 0.9 cuts)
- 2008/06/04: 3x3 cluster energy in various EEMC layers (MC to data matching)
- May 2008
- 2008/05/30: Gamma and away side jet pt, eta and phi (MC to data matching)
- 2008/05/27: Shower shapes comparison (pp2006, MC gamma-jet, QCD jets, eta-meson gammas)
- 2008/05/21: Some eta-meson QA plots (invariant mass, detector eta, etc)
- 2008/05/20: Shower shapes (sorted by: pre-shower, z-vertex; gamma pt, eta, and phi)
- 2008/05/15: Vertex z distribution for gamma-jet candidates
- 2008/05/14: R_cluster>0.99 and pt matching (gamma and jet pt asymmetry)
- 2008/05/09: TPC tracking (detector eta 1
<1.4) - 2008/05/08: SMD high strips positioning (x:y and in-sector distributions)
- 2008/05/05: pt distributions and 1D-sided residual plots (data vs. MC g-jet and QCD jets)
- April 2008
- 2008/04/23: Sided residual and gamma:jet pt 2D plots (data driven MC vs. data)
- 2008/04/17: Sided residual (data driven vs. raw MC, pp2006) (plus: Geant vs. reconstructed pt, event counter)
- 2008/04/16: Sided residual (partonic pt 9-11) (plus: event counter)
- 2008/04/09: Reconstructing raw MC gamma-jet events (shapes, gamma:jet pt, phi, eta, sided residual, logD, chi2 plots)
- 2008/04/03: chi2-shape subtraction (request from Hal)
- 2008/04/02: Sided residual: 3 Gaussian fits and inv. mass sorting (plus: projections and signal/bg separation)
- 2008/04/02: Shower shapes: eta-meson and pp2006 vs. MC gamma-jets and single gammas
- 2008/04/02: Single gamma MC (sided residual plot)
- March 2008
- 2008/03/28: Shower shapes: pp2006 gamma-jets, MC (from Pibero), and eta-meson (plus: stip-by-strip energy, chi2 plots)
- 2008/03/26: Sided residual (2 Gaussian fits, with/without pt cuts) and chi2 (plus: pt, eta, phi, by-sector 2D plots)
- 2008/03/20: First look at sided residual and chi2 (plus: pdf-file with event-by-event EEMC response)
- 2008/03/12: M_2gamma invariant mass plots (plus: pdf-files with event-by-event EEMC response)
- 2008/03/03: EEMC SMD QA plots (mean energy for SMD high strips)
- February 2008
- 2008/02/27: EEMC vs. BEMC gamma-jet candidates (pt, eta, phi, 3x3 R_cluster vs. nTowers, various pt-cuts)
- 2008/02/20: NEF, pt, eta, phi for gamma-jet candidates (more statistics)
- 2008/02/13: Vertex z, m_2gamma inv. mass from simple pi0 finder (plus: pdf-files with event-by-event EEMC response)
- January 2008
- 2008/01/30: Gamma-jet candidates: numberOfJets/event, NEF, pt, eta, phi (first look, only runId=7136022)
Selected figures
Figure 1:. Gamma candidate pt distributions for a three different data samples:
- pp2006 - STAR 2006 pp longitudinal data (~ 3.164 pb^1) after applying gamma-jet isolation cuts.
- gamma-jet - Pythia gamma-jet sample (~170K events). Partonic pt range 5-35 GeV.
- QCD jets - Pythia QCD jets sample (~4M events). Partonic pt range 3-65 GeV.
Note: Same algorithm has been used to analyse Monte-Carlo and real data events

Figure 2: Sided residual and sample gamma-jet candidate (EEMC response)

Various
2009.08.17 Direct photon - charge particle correlation paper GPC
proposed modification ot the title/abstract
Comments on Neutral Pion Production in Au+Au Collisions
EEMC geometry file (ecalgeo)
l2-gamma EEMC monitoring
Instructions on how to produce eemc-l2-gamma monitoring plots by hands
-
Get l2 software
Currently copied from ~rcorliss/l2/official-2009a -
Compile
# cd onlineL2
# make lib
# make -
Run
# m 5000 -
Convert "bin" file format to root file:
# ./binH2rootH-exe out/run9.l2eemcGamma.hist.bin out/run9.l2eemcGamma.hist.root -
Create ps file with plots from root file with plotl2eemcGamma.C macro:
# root -b -q 'plotl2eemcGamma.C("out/run9.l2eemcGamma.hist.root","run9.l2eemcGamma.ps")'
# ps2pdf run9.l2eemcGamma.ps run9.l2eemcGamma.pdf -
Sample pdf plots:
pythia_pT7-9_rcf1225.eve_.bin-348k
pythia500_QCD_pt10_Filter20Bemc_LT10invpb
run9 l2 rates monitoring